Comparison of superb microvascular imaging and shear wave elastography for assessing liver fibrosis in chronic hepatitis B
- PMID: 35026886
- PMCID: PMC8942734
- DOI: 10.14366/usg.21136
Comparison of superb microvascular imaging and shear wave elastography for assessing liver fibrosis in chronic hepatitis B
Abstract
Purpose: The present study investigated the effectiveness and applicability of superb microvascular imaging (SMI) in determining the degree of liver fibrosis noninvasively in comparison with shear wave elastography (SWE).
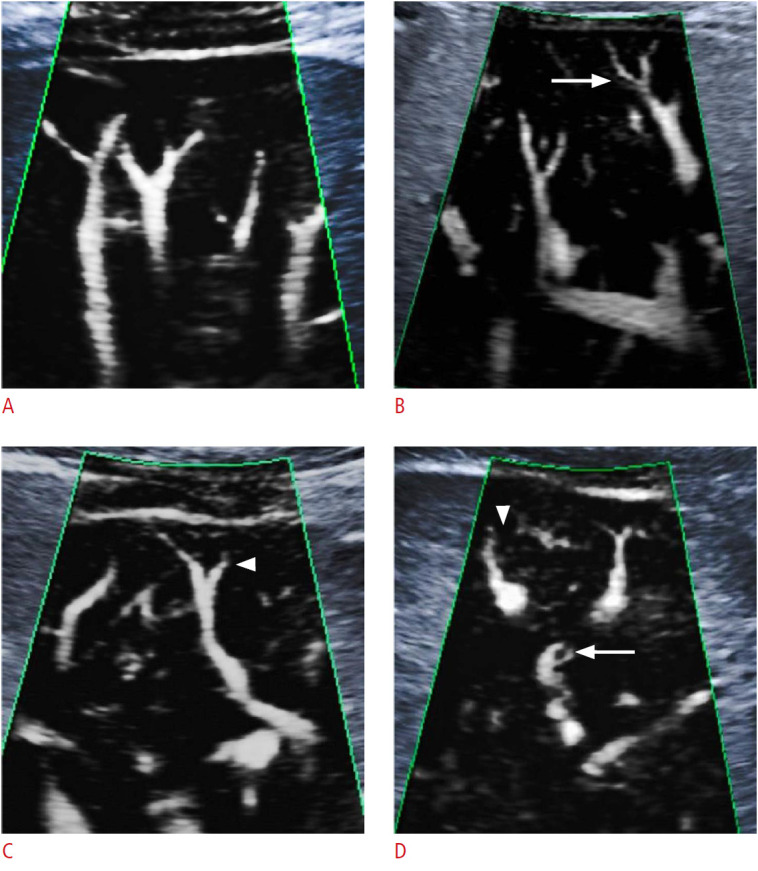
Methods: Ninety-eight consecutive patients with chronic hepatitis B who underwent ultrasound (US)-guided needle biopsy were examined using US combined with SMI and SWE. The predictive performance of the two US techniques in staging liver fibrosis and inflammation was compared with reference to the histological findings obtained from liver biopsy. The intraobserver and interobserver reproducibility of SMI in vascularity scores were evaluated.
Results: SWE values and SMI vascular scores were statistically significantly different among fibrosis stages (χ2(3)=76.3, χ2(3)=81.5, P<0.001). The SWE and SMI models significantly predicted fibrosis stages separately, and SMI scores alone predicted fibrosis stages better than SWE values (50.1% for SWE, 63.5% for SMI, P<0.001). A model with both SMI scores and SWE values together explained 73.2% of variance in fibrosis stages. When other clinical and laboratory predictors were added to the model (81.5%, P<0.001), SWE values and SMI scores remained the main predictors of fibrosis stages. SWE and SMI were also applicable in predicting inflammatory grades, explaining 31% and 34% of variance, respectively, and 37.7% when used together (P<0.001).
Conclusion: Both SWE and SMI had good diagnostic performance in determining the degree of liver fibrosis in chronic hepatitis B patients. The efficacy of SMI was better than that of SWE. SMI can improve diagnostic performance for staging liver fibrosis and shows potential for estimating necroinflammation of the liver.
Keywords: Chronic hepatitis B; Inflammation; Liver cirrhosis; Shear wave US elastography; Superb microvascular imaging; Vascularity score.
Conflict of interest statement
No potential conflict of interest relevant to this article was reported.
Figures


References
-
- Ferraioli G, Filice C, Castera L, Choi BI, Sporea I, Wilson SR, et al. WFUMB guidelines and recommendations for clinical use of ultrasound elastography: Part 3: liver. Ultrasound Med Biol. 2015;41:1161–1179. - PubMed
LinkOut - more resources
Full Text Sources