. 2022 Jan 14;20(1):26.
doi: 10.1186/s12916-021-02228-6.

Long-term perturbation of the peripheral immune system months after SARS-CoV-2 infection

Affiliations

Long-term perturbation of the peripheral immune system months after SARS-CoV-2 infection

Feargal J Ryan et al. BMC Med. .

Abstract

Background: Severe acute respiratory syndrome coronavirus 2 (SARS-CoV-2) is a highly infectious respiratory virus which is responsible for the coronavirus disease 2019 (COVID-19) pandemic. It is increasingly clear that recovered individuals, even those who had mild COVID-19, can suffer from persistent symptoms for many months after infection, a condition referred to as "long COVID", post-acute sequelae of COVID-19 (PASC), post-acute COVID-19 syndrome, or post COVID-19 condition. However, despite the plethora of research on COVID-19, relatively little is known about the molecular underpinnings of these long-term effects.

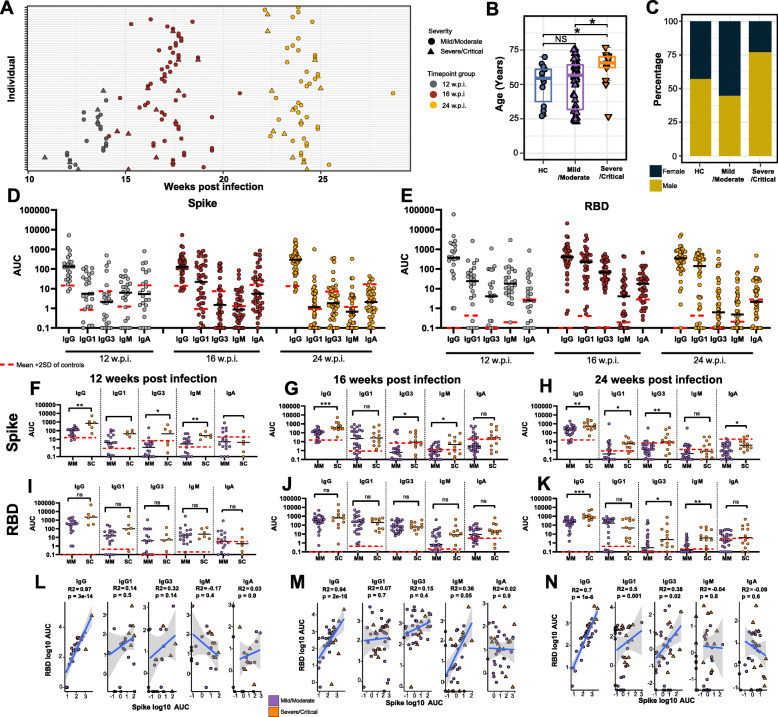
Methods: We have undertaken an integrated analysis of immune responses in blood at a transcriptional, cellular, and serological level at 12, 16, and 24 weeks post-infection (wpi) in 69 patients recovering from mild, moderate, severe, or critical COVID-19 in comparison to healthy uninfected controls. Twenty-one of these patients were referred to a long COVID clinic and > 50% reported ongoing symptoms more than 6 months post-infection.

Results: Anti-Spike and anti-RBD IgG responses were largely stable up to 24 wpi and correlated with disease severity. Deep immunophenotyping revealed significant differences in multiple innate (NK cells, LD neutrophils, CXCR3+ monocytes) and adaptive immune populations (T helper, T follicular helper, and regulatory T cells) in convalescent individuals compared to healthy controls, which were most strongly evident at 12 and 16 wpi. RNA sequencing revealed significant perturbations to gene expression in COVID-19 convalescents until at least 6 months post-infection. We also uncovered significant differences in the transcriptome at 24 wpi of convalescents who were referred to a long COVID clinic compared to those who were not.

Conclusions: Variation in the rate of recovery from infection at a cellular and transcriptional level may explain the persistence of symptoms associated with long COVID in some individuals.

Keywords: Antibody responses; COVID-19; Convalescent patients; Immunity; Immunophenotyping; Infection; Long COVID; Post COVID-19 condition; Post-acute sequelae of COVID-19 (PASC); RNA-Seq; SARS-CoV-2; T cell.


Conflict of interest statement

The authors declare that they have no competing interests.

Figures

Fig. 1
Fig. 1
Anti-Spike and anti-RBD-specific antibodies at 12, 16, and 24 weeks post-infection (w.p.i.). A Blood sample collection timepoints. B Age and C sex distribution of healthy controls (HC) in comparison to mild/moderate and severe/critical COVID-19 convalescents. D Anti-Spike and E anti-RBD-specific IgG, IgG1, IgG3, IgM, and IgA titres at 12, 16, and 24 w.p.i. End point titres are reported as area under the curve (AUC). The mean is denoted by the horizontal black lines. Seronegative samples were assigned a value of 0.1. Red dashed lines represent the mean AUC + 2 SD in HC for each isotype. F–K Antibody titres subdivided by disease severity. L–M Pearson correlations between anti-Spike and anti-RBD antibody subclass titres at each timepoint. Statistical significance was assessed in B,F–K using Wilcoxon rank sum tests. ns = non-significant. * P < 0.05, ** P < 0.01, *** P < 0.001
Fig. 2
Fig. 2
Flow cytometry analysis of major immune cell populations in peripheral blood mononuclear cells (PMBCs) collected from COVID-19 convalescents at 12, 16, and 24 weeks post-infection (w.p.i.) and from healthy controls (HC). A Heatmap representing the frequency of immune cell populations in HC and in convalescents. Brighter red color represents higher frequency. B–D Volcano plots of immune cell populations at each timepoint. Horizontal line represents FDR = 0.05. Populations shown in red or blue were significantly (FDR < 0.05) increased or decreased (fold change > 1.5-fold), respectively, in convalescents. E–M The proportion of selected immune cell populations at 12, 16, and 24 w.p.i. compared to HC. Statistical significance was assessed using Wilcoxon rank sum tests. P values were adjusted for multiple testing using the Benjamini-Hochberg method. ns = non-significant. * FDR < 0.05, ** FDR < 0.01, *** FDR < 0.001
Fig. 3
Fig. 3
Flow cytometry analysis of T helper (Th), T follicular helper (Tfh), and T regulatory cell (Treg) populations in peripheral blood mononuclear cells (PMBCs) collected from COVID-19 convalescents at 12, 16, and 24 weeks post-infection (w.p.i.) and from healthy controls (HC). A Heatmap representing the frequency of immune cell populations in HC and in convalescents. Brighter red color represents higher frequency. B–D Volcano plots of immune cell populations at each timepoint. Populations shown in red or blue were significantly (FDR < 0.05) increased or decreased (fold change > 1.5-fold), respectively, in convalescents. E–P The proportion of selected immune cell populations at 12, 16, and 24 w.p.i. compared to HCs. Statistical significance was assessed using Wilcoxon rank sum Tests. P values were adjusted for multiple testing using the Benjamini-Hochberg method. ns = non-significant. * FDR < 0.05, ** FDR < 0.01, *** FDR < 0.001
Fig. 4
Fig. 4
RNA-Seq was used to profile gene expression in peripheral whole blood samples collected from COVID-19 convalescents at 12, 16, and 24 weeks post-infection (w.p.i.) and from healthy controls (HC). A–C Multidimensional scaling (MDS) analysis of RNA-Seq gene expression data at 12, 16, and 24 w.p.i. compared to HC. D The number of differentially expressed (DE) genes (FDR < 0.05 and fold change > 1.25-fold) identified at each timepoint. E Heatmap showing the expression of DE genes in each sample. Data were adjusted for sex and batch effects prior to MDS analysis and visualisation of the heatmap. F–G Selected REACTOME pathways enriched among F upregulated and G downregulated genes at each timepoint. See Table S4 for all enriched pathways. H–L The expression of selected genes in convalescents at 12, 16, and 24 w.p.i. compared to HC. Statistical significance comparing all convalescents to HC was assessed in (H–L) using EdgeR. P values were adjusted for multiple testing using the Benjamini-Hochberg method. ns = non-significant. * FDR < 0.05, ** FDR < 0.01, *** FDR < 0.001
Fig. 5
Fig. 5
RNA-Seq was used compare gene expression in peripheral whole blood samples collected from COVID-19 convalescents who were clinically referred to a long COVID clinic and those who were not. A Self-reported long COVID symptoms in convalescent individuals. B Volcano plot showing genes that were differentially expressed (DE) at 24 wpi in convalescents referred to a long COVID clinic. Horizontal line corresponds to FDR = 0.05. Positive log2 fold change values correspond to genes with increased expression in those referred to a long COVID clinic relative to convalescent patients who were not referred. C Heatmap showing the expression of DE genes in each sample at 24 wpi. D Selected REACTOME pathways enriched among up- and downregulated genes by long COVID clinic referral status. See Table S5 for all enriched pathways. E Heatmap showing the expression of DE genes in the REACTOME “platelet activation, signaling and degranulation” pathway. F Barplot showing the enrichment of gene sets from the MSigDB cell type collection. G–N The expression of selected genes at 24 wpi in convalescents referred to a long COVID clinic and those who were not referred. Statistical significance in G–N was assessed using EdgeR. * FDR < 0.05
Fig. 6
Fig. 6
Integrated network analysis of correlations between blood transcriptional modules (BTMs), the frequency of immune cell populations assessed by flow cytometry and anti-Spike and anti-RBD antibody titres. A Selected BTMs identified to be differentially active in COVID-19 convalescents. Each circle represents the activity of that BTM in a specific convalescent individual. Darker red indicates increased BTM activity relative to healthy control (HC); darker blue decreased. The size of the circle is proportionate to BTM activity relative to HC. Samples are ordered on the X-axis by BTM M85 (Platelet activation) activity score. B Network showing Pearson correlations (as edges) between BTMs, immune cell populations, and serology data. Red and blue edges indicate positive and negative correlations, respectively. BTM-BTM correlations were determined across all timepoints. Only those with r2 > 0.7 and FDR < 0.05 are shown. Correlations between BTMs, immune cell populations, and antibody titres were determined at each timepoint. Only those with FDR < 0.05 at a specific timepoint are shown. Node sizes and colours are scaled relative to HC. Red and blue nodes indicate increased and decreased values, respectively, relative to HC. Grey nodes were not significantly altered in convalescents. The network was visualised using Cytoscape v3.8.1

References

    1. Marshall M. COVID’s toll on smell and taste: what scientists do and don’t know. Nature. 2021;589(7842):342–343. doi: 10.1038/d41586-021-00055-6. - DOI - PubMed
    1. Huang C, Wang Y, Li X, Ren L, Zhao J, Hu Y, Zhang L, Fan G, Xu J, Gu X, Cheng Z, Yu T, Xia J, Wei Y, Wu W, Xie X, Yin W, Li H, Liu M, Xiao Y, Gao H, Guo L, Xie J, Wang G, Jiang R, Gao Z, Jin Q, Wang J, Cao B. Clinical features of patients infected with 2019 novel coronavirus in Wuhan. China Lancet. 2020;395(10223):497–506. doi: 10.1016/S0140-6736(20)30183-5. - DOI - PMC - PubMed
    1. Dong E, Du H, Gardner L. An interactive web-based dashboard to track COVID-19 in real time. Lancet Infect Dis. 2020;20(5):533–534. doi: 10.1016/S1473-3099(20)30120-1. - DOI - PMC - PubMed
    1. Carfi A, Bernabei R, Landi F, Gemelli Against C-P-ACSG. Persistent symptoms in patients after acute COVID-19. JAMA. 2020;324(6):603–605. doi: 10.1001/jama.2020.12603. - DOI - PMC - PubMed
    1. Huang C, Huang L, Wang Y, Li X, Ren L, Gu X, Kang L, Guo L, Liu M, Zhou X, Luo J, Huang Z, Tu S, Zhao Y, Chen L, Xu D, Li Y, Li C, Peng L, Li Y, Xie W, Cui D, Shang L, Fan G, Xu J, Wang G, Wang Y, Zhong J, Wang C, Wang J, Zhang D, Cao B. 6-month consequences of COVID-19 in patients discharged from hospital: a cohort study. Lancet. 2021;397(10270):220–232. doi: 10.1016/S0140-6736(20)32656-8. - DOI - PMC - PubMed

Publication types

Substances