. 2022 Jan 18;119(3):e2112566119.
doi: 10.1073/pnas.2112566119.

A connectivity-constrained computational account of topographic organization in primate high-level visual cortex

Affiliations

A connectivity-constrained computational account of topographic organization in primate high-level visual cortex

Nicholas M Blauch et al. Proc Natl Acad Sci U S A. .

Abstract

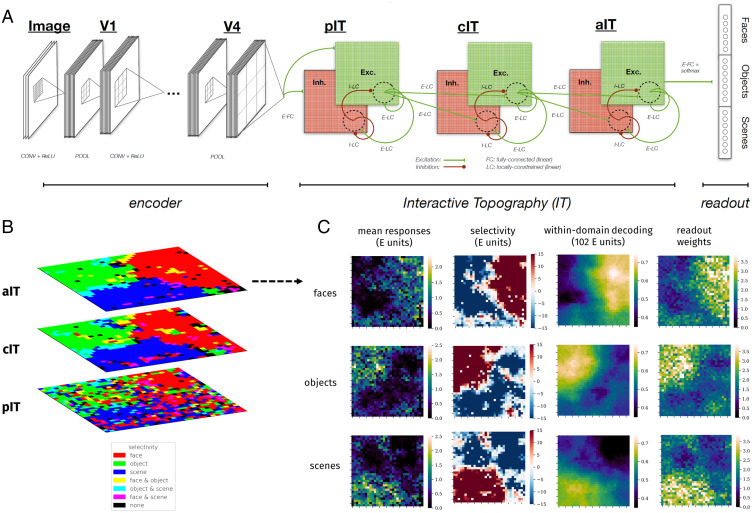
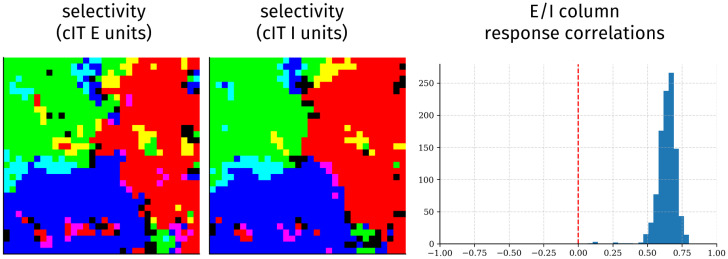
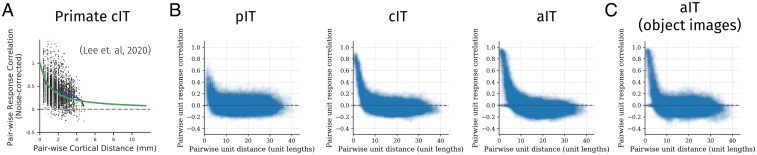
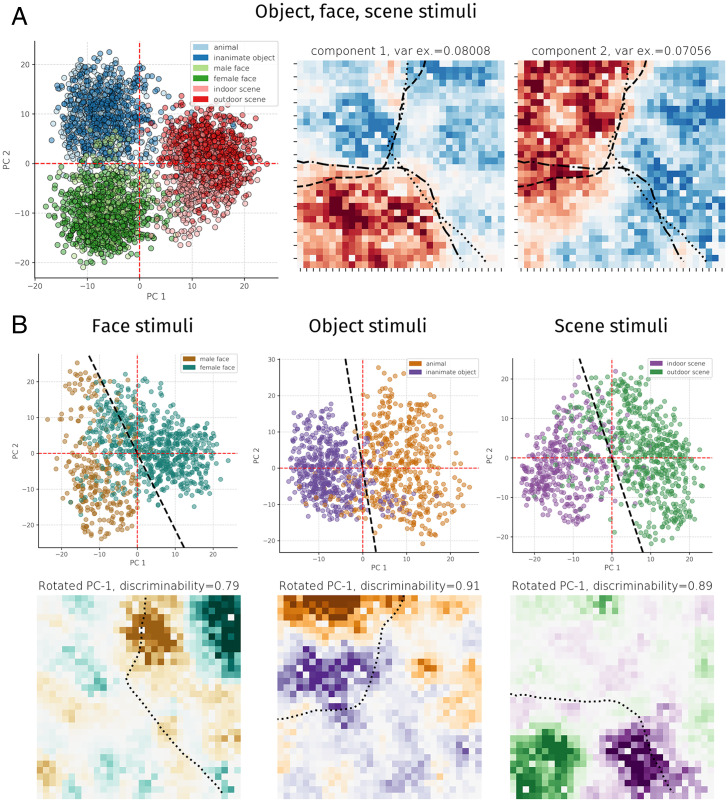
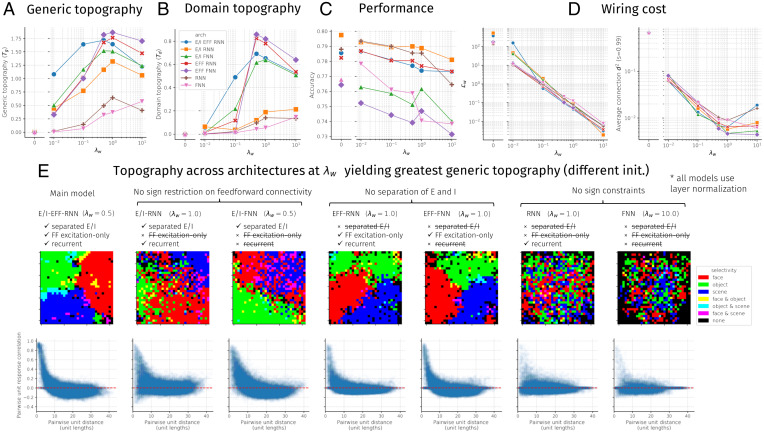
Inferotemporal (IT) cortex in humans and other primates is topographically organized, containing multiple hierarchically organized areas selective for particular domains, such as faces and scenes. This organization is commonly viewed in terms of evolved domain-specific visual mechanisms. Here, we develop an alternative, domain-general and developmental account of IT cortical organization. The account is instantiated in interactive topographic networks (ITNs), a class of computational models in which a hierarchy of model IT areas, subject to biologically plausible connectivity-based constraints, learns high-level visual representations optimized for multiple domains. We find that minimizing a wiring cost on spatially organized feedforward and lateral connections, alongside realistic constraints on the sign of neuronal connectivity within model IT, results in a hierarchical, topographic organization. This organization replicates a number of key properties of primate IT cortex, including the presence of domain-selective spatial clusters preferentially involved in the representation of faces, objects, and scenes; columnar responses across separate excitatory and inhibitory units; and generic spatial organization whereby the response correlation of pairs of units falls off with their distance. We thus argue that topographic domain selectivity is an emergent property of a visual system optimized to maximize behavioral performance under generic connectivity-based constraints.

Keywords: development; functional organization; inferotemporal cortex; neural network; topography.


Conflict of interest statement

The authors declare no competing interest.

Figures

Fig. 1.
Fig. 1.
The interactive topographic network produces hierarchical domain-level organization. (A) Diagram of the ITN. An ITN model consists of three components: an encoder that approximates early visual processing prior to inferotemporal cortex, the IT areas that approximate inferotemporal cortex, and the readout mechanism for tasks such as object, scene, and face recognition. The architecture of each component is flexible. For example, a four-layer simple convolutional network or a deep 50-layer ResNet can be used as the encoder; whereas the former facilitates end-to-end training along with a temporally precise IT model, the latter supports better learning of the features that discriminate among trained categories. In this work, topographic organization is restricted to the IT layers. Shown is the main version of the ITN containing three constraints: a spatial connectivity cost pressuring local connectivity, separation of neurons with excitatory and inhibitory influences, and the restriction that all between-area connections are sent by the excitatory neurons. The final IT layer projects to the category readout layer containing one localist unit per learned category, here shown organized into three learned domains. (Note that this organization is merely visual and does not indicate any architectural segregation in the model.) (B) Domain selectivity at each level of the IT hierarchy. Selectivity is computed separately for each domain and then binarized by including all units corresponding to P < 0.001. Each domain is assigned a color channel to plot all selectivities simultaneously. Note that a unit can have zero, one, or two selective domains, but not three, as indicated in the color key. (C) Detailed investigation of domain-level topography in aIT. Each heatmap plots a metric for each unit in aIT. Left column shows the mean domain response for each domain, Center Left column shows domain selectivity, Center Right column shows the within-domain searchlight decoding accuracy, and Right column shows the mean of weights of a given aIT unit into the readout categories of a given domain.
Fig. 2.
Fig. 2.
E and I cells act as functional columns. Shown are selectivity of cIT E units (Left) and I units (Center) for each domain (colored as in Fig. 1B) and histograms (Right) of response correlations between colocalized E and I units over all images.
Fig. 3.
Fig. 3.
Lesion results in the ITN model. Each plot shows the relative effects of a set of medium-sized lesions (20% of aIT units) on recognition performance for each domain, relative to the performance on the same domain in the undamaged model. Error bars show bootstrapped 95% confidence intervals over trials; thus, the statistical significance of a given lesion can be assessed by determining whether the confidence interval includes 0. (A) Damage from circular focal lesions centered on the peak of smoothed selectivity for each domain. (Left) Results for a variety of lesion sizes. (B) Damage from selectivity-ordered lesions for each domain.
Fig. 4.
Fig. 4.
Generic topographic organization beyond domain selectivity emerges through task optimization under biologically plausible constraints on connectivity. (A) Distance-dependent response correlation in macaque IT (reproduced from ref. , which is licensed under CC BY-NC-ND 4.0 [https://creativecommons.org/licenses/by-nc-nd/4.0/]). (B) Distance-dependent response correlation in the excitatory cells of each layer, using images from all three domains (objects, faces, scenes). (C) Distance-dependent response correlation in aIT using images from the object domain only, highlighting within-domain generic functional organization.
Fig. 5.
Fig. 5.
Principal components analysis of activations. A plots the PC1 to PC2 space and PC1 and PC2 component weights across images from all three domains. Dashed lines on component weight plots show the contour of selectivity for each domain, using selectivity maps smoothed with a local averaging kernel (5% nearest units) corresponding to significance P < 0.001. B plots the PC1 to PC2 space for responses to each domain separately and the weight visualization of a rotated axis in PC1 to PC2 space that maximized the discriminability of images according to a given subdomain attribute (gender for faces, animacy for objects, and indoor/outdoor for scenes). Dashed lines show selectivity for the domain of interest, using selectivity maps smoothed with a local averaging kernel (5% nearest units) corresponding to significance P < 0.001.
Fig. 6.
Fig. 6.
Topographic organization, performance, and wiring cost as a function of spatial regularization strength (λw) and architectural constraints. Seven architectures were tested, sweeping all unique variations of models containing or not containing separate excitation and inhibition (E/I), excitatory-only feedforward connectivity (EFF), and learned lateral/recurrent connections (RNN vs. FNN); see D for a model-by-model constraint breakdown. Note that all models contained a minimal form of recurrence induced by the layer normalization operation. (A) Generic topographic organization summary statistic (Eq. 7). (B) Domain-level topographic organization summary statistic (Eq. 6). (C) Final accuracy on validation images. (D) Two measures of wiring cost: (Left) Lw (Eq. 4) and (Right) Lw,u (Eq. 8). (E) Domain-level and generic topographic organization visualizations for each architecture using the tuned value of λw that maximized Tg. Each model was tested using a different random initialization from the one used to tune λw.

References

    1. Kanwisher N., McDermott J., Chun M. M., The fusiform face area: A module in human extrastriate cortex specialized for face perception. J. Neurosci. 17, 4302–4311 (1997). - PMC - PubMed
    1. Gauthier I., et al. ., The fusiform “face area” is part of a network that processes faces at the individual level. J. Cogn. Neurosci. 12, 495–504 (2000). - PubMed
    1. Grill-Spector K., Weiner K. S., Kay K., Gomez J., The functional neuroanatomy of human face perception. Annu. Rev. Vis. Sci. 3, 167–196 (2017). - PMC - PubMed
    1. Grill-Spector K., Kushnir T., Hendler T., Malach R., The dynamics of object-selective activation correlate with recognition performance in humans. Nat. Neurosci. 3, 837–843 (2000). - PubMed
    1. Aguirre G. K., Zarahn E., D’Esposito M., An area within human ventral cortex sensitive to “building” stimuli: Evidence and implications. Neuron 21, 373–383 (1998). - PubMed

LinkOut - more resources