. 2022 Jan 18;119(3):e2115230119.
doi: 10.1073/pnas.2115230119.

Intestinal commensal microbiota and cytokines regulate Fut2+ Paneth cells for gut defense

Affiliations

Intestinal commensal microbiota and cytokines regulate Fut2+ Paneth cells for gut defense

Mariko Kamioka et al. Proc Natl Acad Sci U S A. .

Abstract

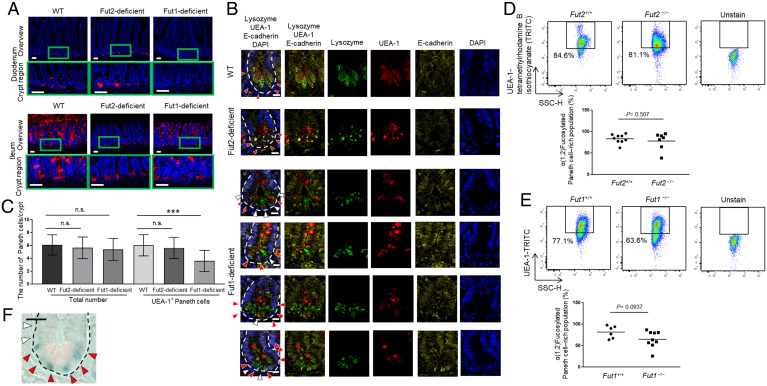
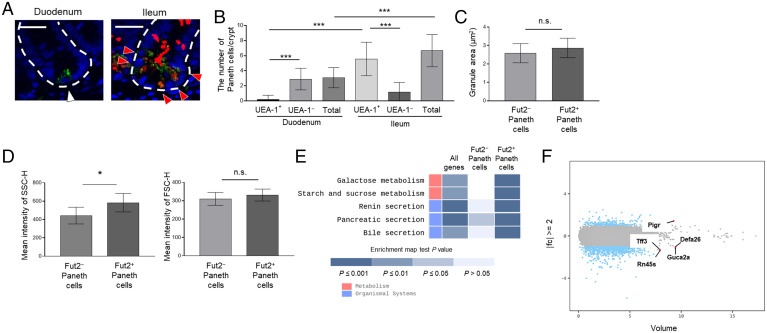
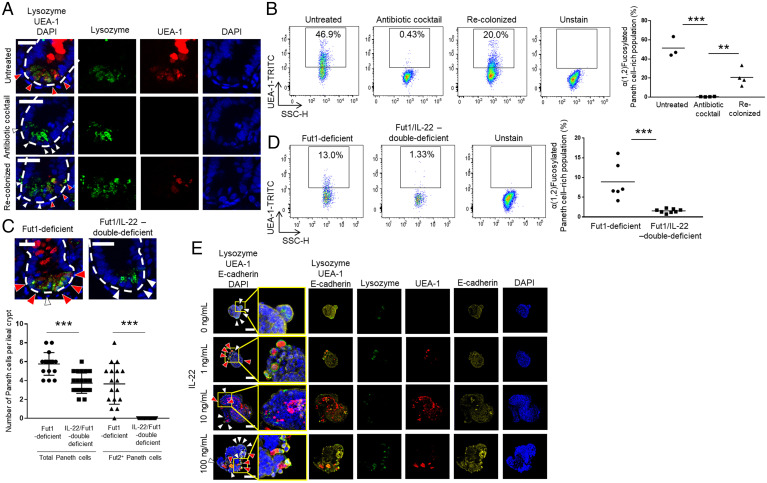
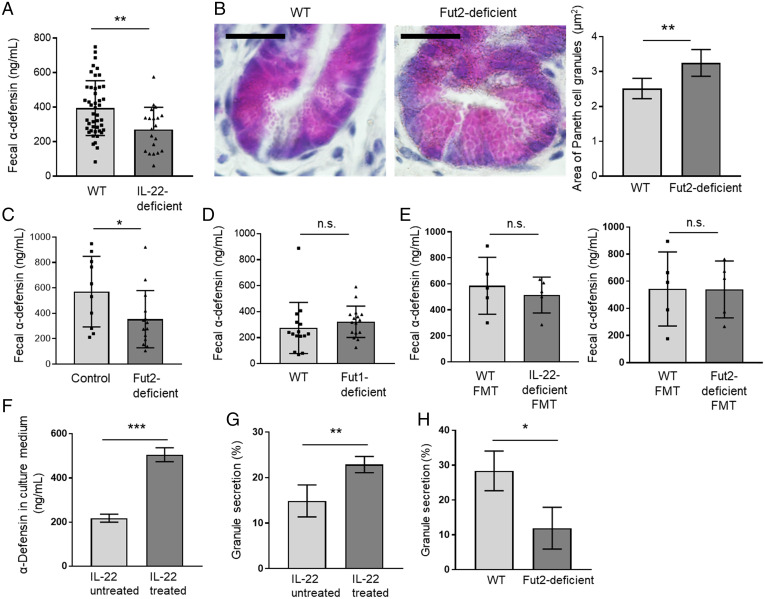
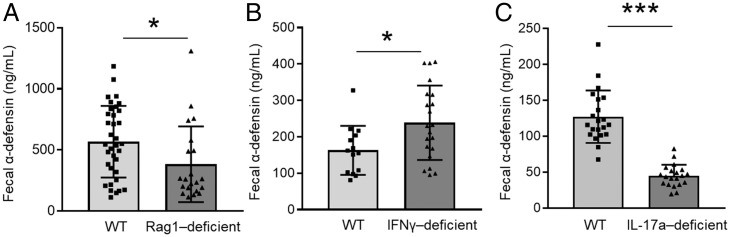
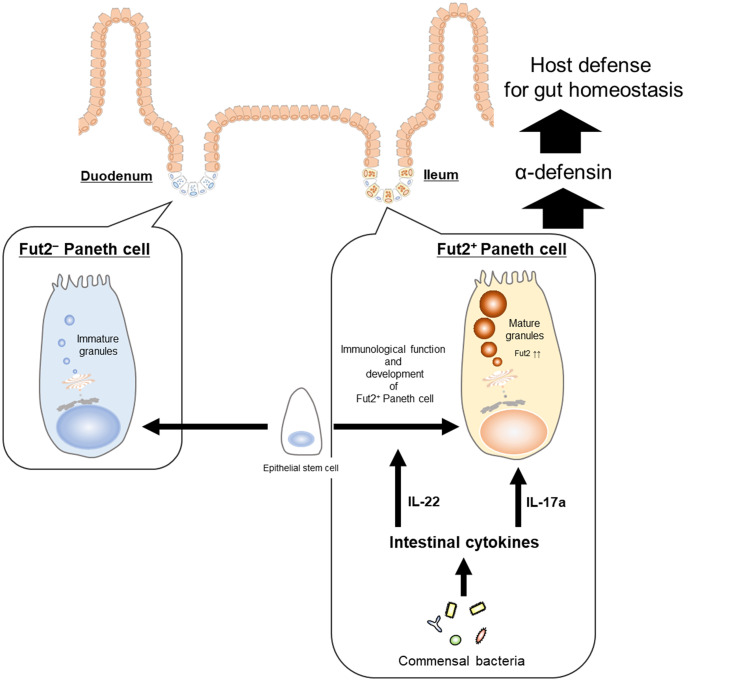
Paneth cells are intestinal epithelial cells that release antimicrobial peptides, such as α-defensin as part of host defense. Together with mesenchymal cells, Paneth cells provide niche factors for epithelial stem cell homeostasis. Here, we report two subtypes of murine Paneth cells, differentiated by their production and utilization of fucosyltransferase 2 (Fut2), which regulates α(1,2)fucosylation to create cohabitation niches for commensal bacteria and prevent invasion of the intestine by pathogenic bacteria. The majority of Fut2- Paneth cells were localized in the duodenum, whereas the majority of Fut2+ Paneth cells were in the ileum. Fut2+ Paneth cells showed higher granularity and structural complexity than did Fut2- Paneth cells, suggesting that Fut2+ Paneth cells are involved in host defense. Signaling by the commensal bacteria, together with interleukin 22 (IL-22), induced the development of Fut2+ Paneth cells. IL-22 was found to affect the α-defensin secretion system via modulation of Fut2 expression, and IL-17a was found to increase the production of α-defensin in the intestinal tract. Thus, these intestinal cytokines regulate the development and function of Fut2+ Paneth cells as part of gut defense.

Keywords: IL-17a; IL-22; Paneth cell; fucosyltransferase 2; α-defensin.


Conflict of interest statement

The authors declare no competing interest.

Figures

Fig. 1.
Fig. 1.
Paneth cells are divided into two subtypes: Fut2+ and Fut2 Paneth cells. (A) Sections of ileum and duodenum of WT, Fut2-deficient, and Fut1-deficient mice were stained with UEA-1 (red) and DAPI (counterstain; blue). Crypt regions are indicated with green boxes. (Scale bars, 50 µm.) Data are representative of three independent experiments. (B) Sections of ileum of WT, Fut2-deficient, and Fut1-deficient mice were stained with UEA-1 (red), anti-lysozyme antibody (green), DAPI (counterstain; blue), and anti–E-cadherin antibody (plasma membrane; yellow). Red arrows, lysozyme+ UEA-1+ cells; white arrows, lysozyme+ UEA-1 cells; and white dotted lines delineate crypts. (Scale bars, 10 μm.) Data are representative of three independent experiments. (C) Numbers of lysozyme+ UEA-1+ cells and lysozyme+ UEA-1 cells per crypt were counted in 49 ileal crypts pooled from nine WT mice, 40 ileal crypts pooled from eight Fut2-deficient mice, and 23 ileal crypts pooled from three Fut1-deficient mice. Data are presented as mean ± SD. n.s., not significant, ***P < 0.001, Student’s t test. (D and E) Flow cytometric analysis of ileal crypt epithelial cells from Fut2-deficient (Fut2−/−) and WT (Fut2+/+) mice (D) and Fut1-deficient (Fut1−/−) and WT (Fut1+/+) mice (E). The UEA-1+ (fucosylated) Paneth cell–rich fraction is indicated by the black boxes. Mean percentage of the fucosylated, Paneth cell–rich population is shown. P values by Student’s t test are shown. (F) Fut2 promoter activity was examined by X-gal staining. Sections of ileum from Fut2LacZ/+ mice were stained with anti-lysozyme antibody (red), and Fut2 promoter activity (i.e., β-gal derived from the LacZ gene) was detected as a blue color. Red arrows, Paneth cells expressing Fut2 and white arrows, Paneth cells not expressing Fut2. The dotted lines delineate crypts. (Scale bar, 20 μm.) Data are representative of three independent experiments.
Fig. 2.
Fig. 2.
Characterization of Fut2+ and Fut2 Paneth cells. (A) Sections of duodenum and ileum from Fut1-deficient mice were stained with UEA-1 (red), anti-lysozyme antibody (green), and DAPI (counterstain; blue). Red arrows, lysozyme+ UEA-1+ cells; white arrow, lysozyme+ UEA-1 cell; and white dotted lines delineate crypts. (Scale bars, 20 μm.) Data are representative of three independent experiments. (B) The numbers of lysozyme+ UEA-1+ cells and lysozyme+ UEA-1 cells per crypt were counted in 48 duodenal and 39 ileal crypts pooled from four Fut1-deficient mice. Data are presented as mean ± SD ***P < 0.001, Student’s t test. (C) The granule area in ileal Fut2+ and Fut2 Paneth cells was measured in 10 crypts per mouse with the ImageJ software. Data are presented as mean ± SD (n = 8 Fut2LacZ/+ mice per group). n.s., not significant, Student’s t test. (D) SSC-H and FSC-H profiles of ileal Fut2+ and Fut2 Paneth cells detected by using the fluorescent probe Zinpyr-1 and UEA-1 (see SI Appendix, Fig. S1 for the gating strategy). Data are presented as mean ± SD (n = 6 Fut1LacZ/LacZ mice per group). *P < 0.05, n.s., not significant, Student’s t test. (E) Enrichment pathway heatmap obtained from a KEGG analysis. The heatmap shows, from left to right, genes with at least twofold different (|fc| ≥ 2) expression between Fut2+ and Fut2 Paneth cells; genes that are highly expressed in Fut2, but not Fut2+, Paneth cells; and genes that are highly expressed in Fut2+, but not Fut2, Paneth cells. P values were obtained using the modified Fisher’s exact test. Blue colored boxes mean P values. Empty boxes mean that there is not matched gene. (F) Volume plot analysis of the genes examined in the transcriptomics analysis. Blue dots indicate the genes with at least twofold different (|fc| ≥ 2) expression between Fut2+ and Fut2 Paneth cells. Red dots indicate the five genes with the highest expression volumes among those with |fc| ≥ 2.
Fig. 3.
Fig. 3.
Commensal bacteria and IL-22 induce differentiation of Fut2+ Paneth cells. (A and C) Sections of untreated, antibiotic mixture–treated, and bacterial recolonized ileum isolated from Fut1-deficient mice (A) or ileum from Fut1-deficient mice and Fut1/IL-22-double–deficient mice (C) were stained with UEA-1 (red), anti-lysozyme antibody (green), and DAPI (counterstain; blue). Red arrows indicate lysozyme+ UEA-1+ cells (Fut2+ Paneth cells); white arrows indicate lysozyme+ UEA-1 cells (Fut2 Paneth cells); and white dotted lines delineate crypts. (Scale bars, 20 μm.) Three to five crypts per mouse were observed. One to two mice per group were used. Data are representative of three independent experiments. The numbers of Fut2+ Paneth cells and Fut2 Paneth cells per crypt were counted. The data were pooled from four Fut1-deficient mice and five Fut1/IL-22-double–deficient mice. ***P < 0.001, Student’s t test. (B and D) Flow cytometric analysis of crypt epithelial cells isolated from ileum of untreated, antibiotic mixture–treated, bacterial recolonized, Fut1-deficient mice (B) and whole small intestine from Fut1-deficient mice and Fut1/IL-22-double–deficient mice (D). The UEA-1+ (fucosylated) Paneth cell–rich fraction is indicated with black boxes. Mean percentage of the fucosylated, Paneth cell–rich population is shown. **P < 0.01, ***P < 0.001, Student’s t test. (E) Organoids derived from duodenum of Fut1-deficient mice were treated with the indicated concentrations of recombinant murine IL-22 for 2 d. Samples were stained with UEA-1 (red), anti-lysozyme antibody (green), DAPI (counterstain; blue), and anti–E-cadherin antibody (plasma membrane; yellow). Red arrows, lysozyme+ UEA-1+ cells and white arrows, lysozyme+ UEA-1 cells. (Scale bars, 50 μm.) Organoids were derived from one mouse per experiment. Three to four organoids per experiment were observed. Data are representative of three independent experiments.
Fig. 4.
Fig. 4.
IL-22 regulates the amount of α-defensin in the intestinal lumen. (A, C, D, and E) α-defensin concentration in the feces of WT (n = 45) and IL-22–deficient mice (n = 20) (A), control mice (Fut2+/+ and Fut2+/− mice) (n = 10) and Fut2-deficient mice (n = 14) (C), WT mice (n = 15) and Fut1-deficient mice (n = 16) (D), and FMT mice that received WT feces (n = 5) or IL-22–deficient feces (n = 5) and WT feces (n = 5) or Fut2-deficient feces (n = 5) (E), as measured by ELISA. Data are presented as mean ± SD **P < 0.01, *P < 0.05, n.s., not significant, Student’s t test. (B) Sections of ileum from WT mice (n = 5) and Fut2-deficient mice (n = 5) were subjected to hematoxylin and eosin staining to detect Paneth cell granules. (Scale bars, 20 µm.) A total of 10 crypts per mouse were examined, and Paneth cell granule area was measured with the ImageJ software. Representative images are shown. Data are presented as mean ± SD **P < 0.01, Student’s t test. (F) α-defensin concentration in the intestinal organoid culture medium was measured by ELISA. Intestinal organoids derived from WT mice were treated with 1 ng/mL recombinant IL-22 for 2 d, and granule secretion was induced by 5 ng/mL recombinant IFN-γ. Four samples per group were analyzed. Data are presented as mean ± SD; ***P < 0.001, Student’s t test. (G) Intestinal organoids derived from WT mice were treated with 1 ng/mL recombinant IL-22 for 2 d. Paneth cell granule secretion was visualized and quantified as previously described (31). Percent granule secretion was calculated using Paneth cell granule area measured before and 10 min after treatment of the organoids with 0.1 µM carbamylcholine, a cholinergic agonist that stimulates secretion of α-defensin by Paneth cells. A total of 10 Paneth cells in five organoids from each subject were analyzed. Data were pooled from four independent experiments and are presented as mean ± SD; **P < 0.01, Student’s t test. (H) Ileal organoids derived from WT or Fut2-deficient mice were cultured in Matrigel. Percent granule secretion was calculated using Paneth cell granule area measured before and 10 min after treatment of the organoids with 0.1 µM carbamylcholine. Six Paneth cells in three organoids from each subject were analyzed. Data were pooled from three independent experiments and are presented as mean ± SD; *P < 0.05, Student’s t test.
Fig. 5.
Fig. 5.
IL-17a regulates fecal α-defensin produced by Paneth cells. α-defensin concentration in the feces of WT (n = 34) or Rag1-deficient (n = 22) mice (A), WT (n = 14) or IFN-γ–deficient (n = 21) mice (B), and WT (n = 21) or IL-17a–deficient (n = 20) mice (C) was measured with an ELISA. Data are presented as mean ± SD *P < 0.05, ***P < 0.001, Student’s t test.
Fig. 6.
Fig. 6.
Intestinal commensal microbiota and cytokines regulate Fut2+ Paneth cell development and function. Paneth cells are separated into two subsets based on their production and utilization of Fut2. Fut2+ Paneth cells are preferentially located in ileum and are engaged in host defense by secreting α-defensin from granules. IL-22 plays important roles in the immunological function and development of Fut2+ Paneth cells, in response to stimuli from commensal bacteria. IL-17a induces the increase of α-defensin in the intestinal tract. Thus, intestinal cytokines (i.e., IL-22 and IL-17a) regulate the development and function of Fut2+ Paneth cells.

References

    1. Barker N., Adult intestinal stem cells: Critical drivers of epithelial homeostasis and regeneration. Nat. Rev. Mol. Cell Biol. 15, 19–33 (2014). - PubMed
    1. Goto Y., et al. , Innate lymphoid cells regulate intestinal epithelial cell glycosylation. Science 345, 1254009 (2014). - PMC - PubMed
    1. Pickard J. M., et al. , Rapid fucosylation of intestinal epithelium sustains host-commensal symbiosis in sickness. Nature 514, 638–641 (2014). - PMC - PubMed
    1. Pham T. A. N., et al. ; Sanger Mouse Genetics Project, Epithelial IL-22RA1-mediated fucosylation promotes intestinal colonization resistance to an opportunistic pathogen. Cell Host Microbe 16, 504–516 (2014). - PMC - PubMed
    1. Terahara K., et al. , Distinct fucosylation of M cells and epithelial cells by Fut1 and Fut2, respectively, in response to intestinal environmental stress. Biochem. Biophys. Res. Commun. 404, 822–828 (2011). - PubMed

Publication types