. 2022 Jan 14;7(1):9.
doi: 10.1038/s41392-021-00824-9.

Integrated single-cell RNA sequencing analysis reveals distinct cellular and transcriptional modules associated with survival in lung cancer

Affiliations

Integrated single-cell RNA sequencing analysis reveals distinct cellular and transcriptional modules associated with survival in lung cancer

Li Zhang et al. Signal Transduct Target Ther. .

Abstract

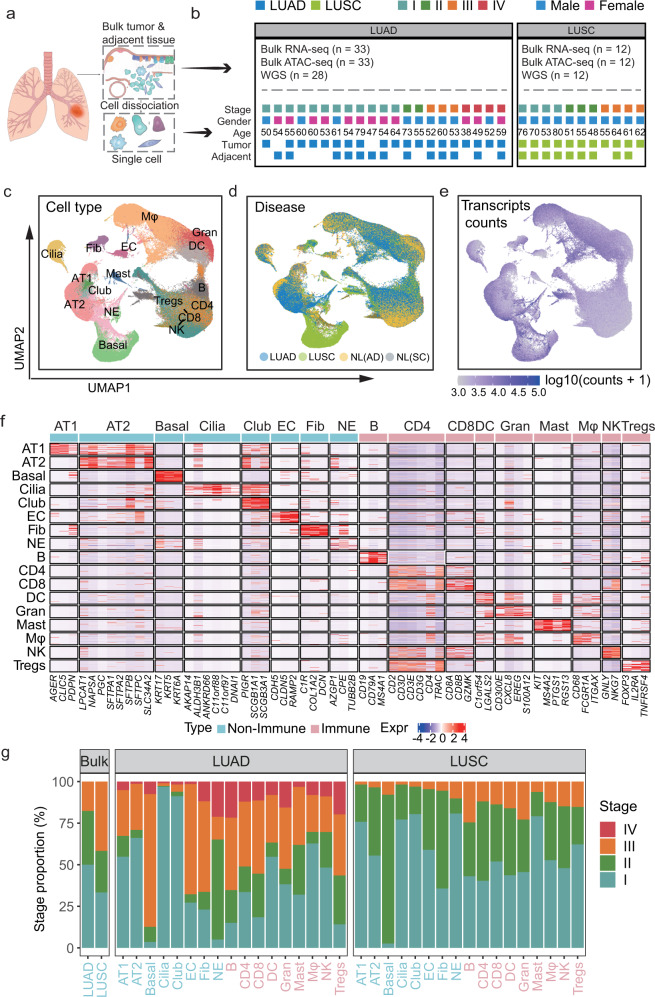
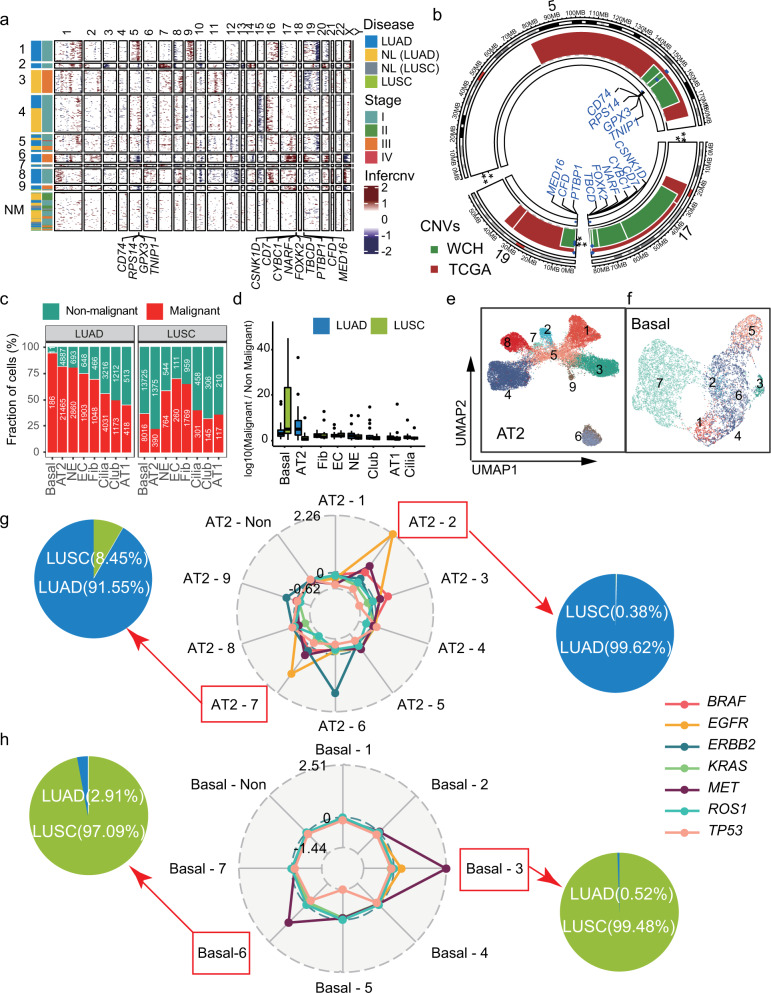
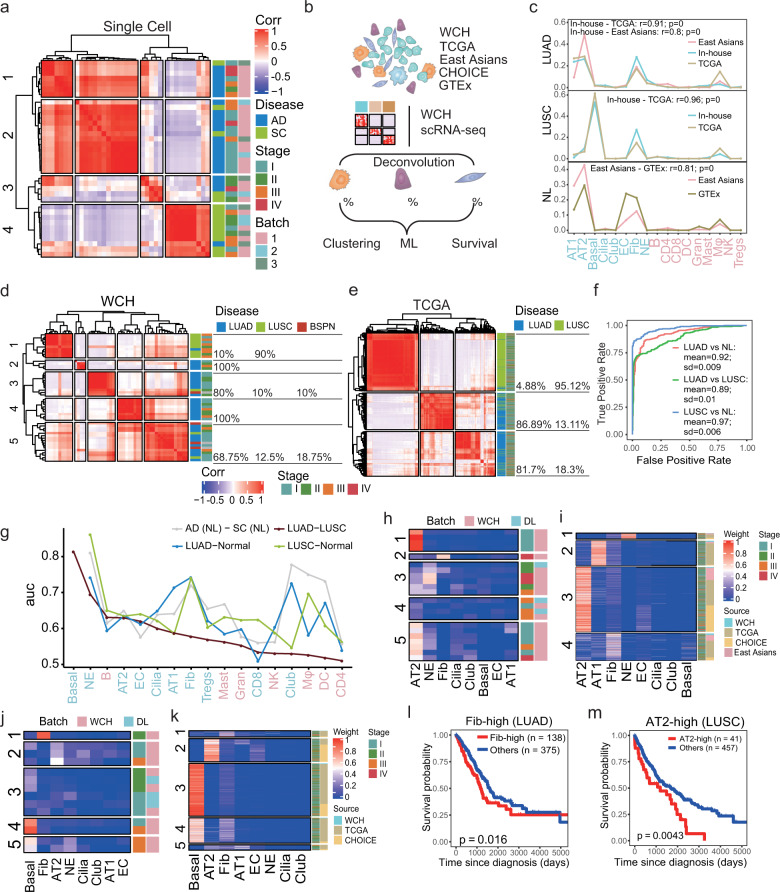
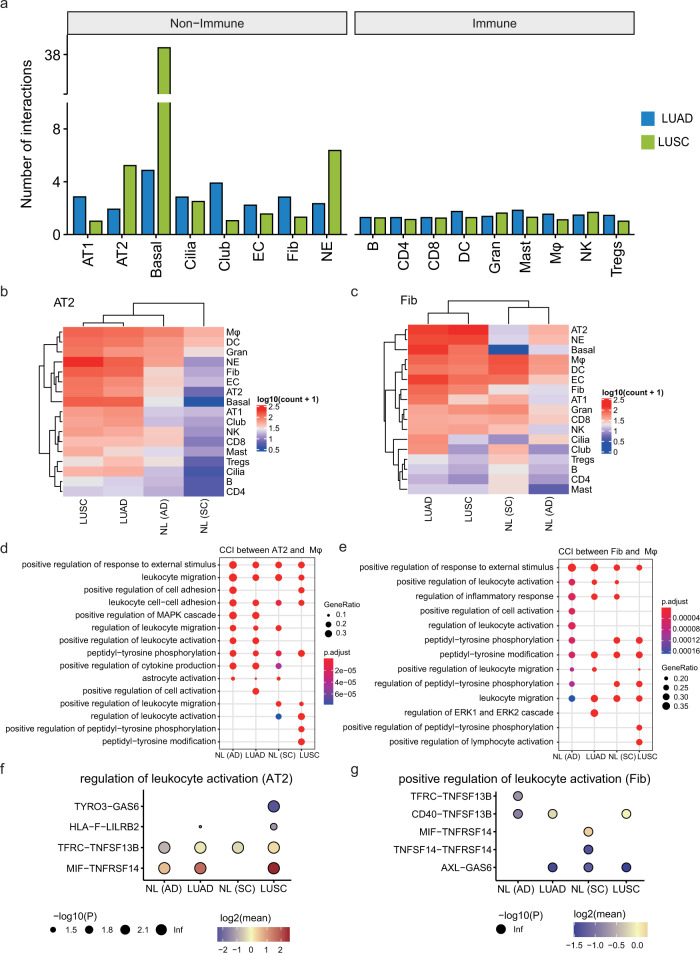
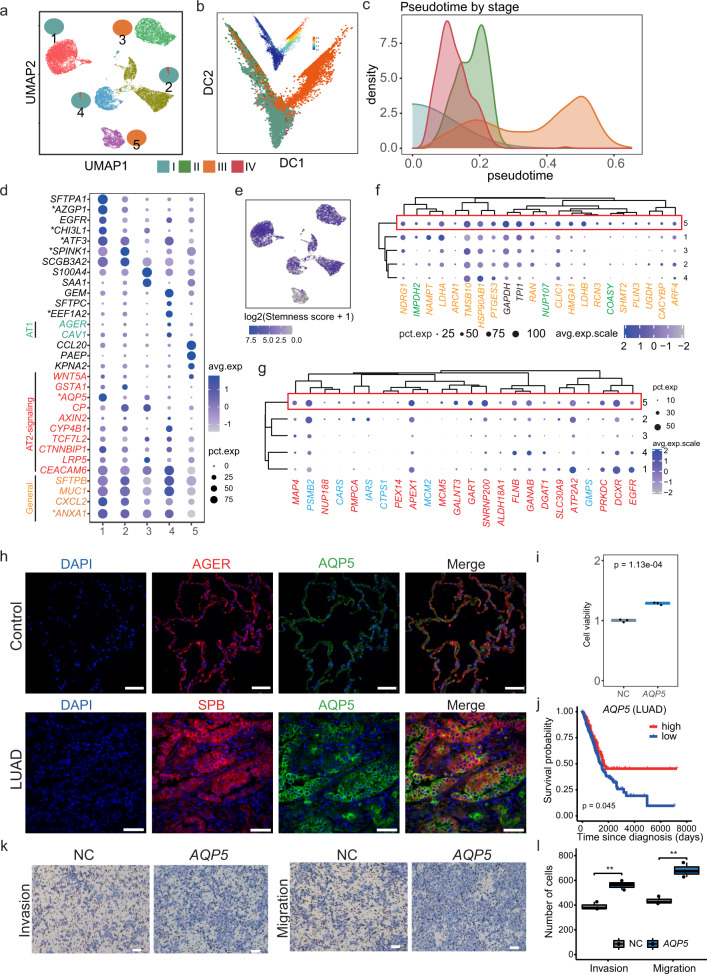
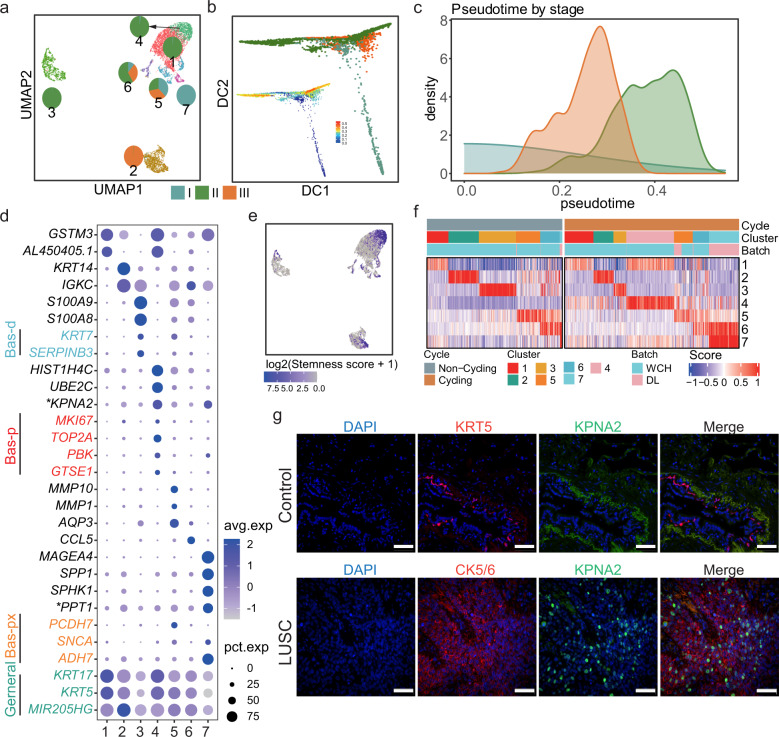
Lung adenocarcinoma (LUAD) and squamous carcinoma (LUSC) are two major subtypes of non-small cell lung cancer with distinct pathologic features and treatment paradigms. The heterogeneity can be attributed to genetic, transcriptional, and epigenetic parameters. Here, we established a multi-omics atlas, integrating 52 single-cell RNA sequencing and 2342 public bulk RNA sequencing. We investigated their differences in genetic amplification, cellular compositions, and expression modules. We revealed that LUAD and LUSC contained amplifications occurring selectively in subclusters of AT2 and basal cells, and had distinct cellular composition modules associated with poor survival of lung cancer. Malignant and stage-specific gene analyses further uncovered critical transcription factors and genes in tumor progression. Moreover, we identified subclusters with proliferating and differentiating properties in AT2 and basal cells. Overexpression assays of ten genes, including sub-cluster markers AQP5 and KPNA2, further indicated their functional roles, providing potential targets for early diagnosis and treatment in lung cancer.


Conflict of interest statement

The authors declare no competing interests.

Figures

Fig. 1
Fig. 1
High-resolution cell-type mapping of LUAD and LUSC samples in both tumor and adjacent non-malignant tissues. a Workflow of the experimental design and analysis. b Summary of samples and patient clinical characteristics: the number of bulk RNA-seq, ATAC-seq, and WGS of WCH data (upper); the tumor stage, gender, age, and surgery site of patients with single-cell sequencing (Bottom). ce UMAP of the 293,432 cells profiled here, with each cell color-coded for (left to right): cell types (c), the sample type of origin (tumor or adjacent tissues) (d), and the transcript expressed level (e). f Heatmap for visualization of the single-cell expression pattern of cell-type-specific gene markers. Immune cells were labeled with pink, non-immune cells were labeled with blue. g Percentage of samples and cells from four clinical stages for 17 types of cells and bulk RNA-seq
Fig. 2
Fig. 2
Identification of malignant cells and subclones based on the inferred CNVs. a Identification of genetic subclones based on inferred amplification or deletions of specific chromosome regions from scRNA-seq. The non-malignant (NM) cells showed no obvious CNVs. Thirteen genes with significant amplification were labeled. b Circus plot of CNVs on chromosomes 5, 17, 19 in WCH and TCGA. Thirteen genes identified from scRNA-seq were validated by whole-genome sequencing (WGS) data from both WCH (green) and TCGA (red) cohorts. c Percentage of malignant (red) and non-malignant (green) cells in eight non-immune cell types. d Comparison of the ratio between the number of malignant and non-malignant cells in LUAD (blue) and LUSC (green). e, f UMAPs of malignant AT2 (e) and basal cells (f) based on inferred CNVs. g, h The radar plot showed the average inferred-CNV score of driver genes in each subtype of AT2 (g) and basal (h). Pie charts presented the percentage of cells from LUSC or LUAD
Fig. 3
Fig. 3
Distinct cellular composition modules of LUAD and LUSC. a Pearson correlation between cell compositions of malignant cells in scRNA-seq. b Flowchart overview of the deconvolution workflow in which our scRNA-seq was used to provide cell-type-specific genes. c Line plots show the cell composition of 17 cells deconvoluted from different sources of bulk RNA-seq. The correlations were calculated using Pearson correlation. d, e The Pearson correlation between cell weights of samples from WCH (d) and TCGA (e). LUAD and LUSC tended to be clustered together. The proportions of different disease types are labeled on the right. f ROC was performed for cell weights of different lung cancer subtypes and normal lung tissue from independent cohorts. Multiple cross-validations were performed to generate reliable values for different groups. The mean area under the curve (AUC) of LUAD vs normal tissue was 0.92 (SD = 0.009), LUSC vs normal tissue was 0.97 (SD = 0.006); LUAD vs LUSC was 0.89 (SD = 0.01). g Prioritizing the most affected cell types in LUAD and LUSC progression by ranking the AUC scores derived from the Augur algorithm. h Heatmap of the proportion of non-immune cells in patients from LUAD. i Heatmap of the deconvoluted weights of non-immune cells based on bulk RNA-seq data from LUAD patients. Patients could be separated into four groups, including NE-high (1), AT1-high (2), AT2-high (3), and Fib-high (4). j Heatmap of the proportion of non-immune cells in patients from LUSC. k Heatmap of the deconvoluted weights of non-immune cells based on bulk RNA-seq data from LUSC patients. Five groups, including Fib-high (1), AT2-high (2), Basal-high (3), Basal-Fib hybrid (4), and Hybrid (5). l Kaplan–Meier survival curves for patients with LUAD (n = 513), stratified for the Fib-high group and the rest. P value was calculated using the log-rank test. m Kaplan–Meier survival curves for patients with LUSC (n = 498), stratified for the AT2-high group and the rest. P value was calculated using the log-rank test
Fig. 4
Fig. 4
The interaction between non-immune and immune cells in LUAD and LUSC. a The bar plot showed the number of interactions of each cell type in LUAD (green) and LUSC (blue). b Heatmap showed the number of interactions between AT2 and other cells in LUAD, LUSC, and its corresponding adjacent samples. c Heatmap showed the number of interactions between fibroblast and other cells in LUAD, LUSC, and its corresponding adjacent samples. d The GO annotation of ligand–receptor pairs between AT2 and Mφ. The dot size represented the number of genes. The color scale represented the adjusted P value. e The GO annotation of ligand–receptor pairs between fibroblast and Mφ. The dot size represented the number of genes. The color scale represented the adjusted P value. f Overview of selected ligand–receptor interactions between AT2 and Mφ enriched in regulation of leukocyte activation pathway; P values are indicated by circle size; scale is shown below the plot. The means of the average expression level of interacting were indicated by color. g Overview of selected ligand–receptor interactions between fibroblast and Mφ enriched in regulation of leukocyte activation pathway; P values were indicated by circle size; scale was shown below the plot. The means of the average expression level of interacting were indicated by the color
Fig. 5
Fig. 5
Distinct gene expression patterns of non-immune cells in LUAD and LUSC. a Distribution of DEGs in each cell type and bulk RNA-seq across the two lung cancer subtypes. Bar plots showed the number of genes. Each row represented one cell type in a specific lung cancer subtype, and each column represented one gene. Red, upregulated (average logFC >0.25 for scRNA-seq and logFC >1 for bulk RNA-seq, adjusted P value < 0.05); blue, downregulated (average logFC < -0.25 for scRNA-seq and logFC < -1 for bulk RNA-seq, adjusted P value <0.05); gray, unchanged (|average logFC | < 0.25 for scRNA-seq and |logFC | <1 for bulk RNA-seq). b Bar plots showed the percentage of upregulated genes in malignant cells that were LUAD-specific (blue), LUSC-specific (green) and shared (red), respectively. c The regulatory networks of upregulated DEGs of AT2 from LUAD. Only the top regulators identified by LeMoNe were drawn. d The line plot showed the number of reads covered of ATAC-seq region around 3000 bp up- and down-stream of S100A13 TSS each. The violin plot of normalized gene expression in malignant and non-malignant AT2 cells from LUAD was placed in the left top. e, f Heatmaps of the expression of tumor-stage-specific modules of AT2 from LUAD (e) and basal cells from LUSC (f). g The cell viability of AZGP1, S100A13, and PPT1 overexpression H1299 cells. Cell viability detection was completed by CCK8 detection. The P value was calculated using a t test. hj The boxplot showed the number of invasion and migration cells of S100A13 (h), AZGP1 (i), and PPT1 (j) overexpression H1299 cells. The P value was calculated by Student’s t test
Fig. 6
Fig. 6
Subclusters and pseudotime analysis of the malignant AT2 cells in LUAD. a UMAP showed subclusters of 21,465 malignant AT2 cells in LUAD, with pie charts illustrated the fraction of each stage in each sub-cluster. b Pseudotime analysis using diffusion map of malignant AT2, colored with different stages. The diffusion map colored with pseudotime was plotted on the top. c Density of the four stages in the inferred pseudotime score. Stages I, II, and III showed a relatively distinct pattern, while stage IV that with fewer patients was placed between stages I and II. d Dot plot showed the average expression level (the intensity of blue) and percentage of expressed cells (the dot size). Expression of sub-cluster makers and indicated AT2, and AT2 cell markers and percent of cells in population with detected expression (dot size). General markers of AT2 (yellow), markers of AT1 (green), and markers of AT2-signaling selective (red) were colored. e UMAP plot showed the log2 transformed stemness score calculated using the mean level of expression of AT2-signaling markers. The sub-cluster 1, 2, and 3, where AT2-signaling-like markers were highly expressed, showed a higher stemness score. f The expression status of potential drug targets and potential prognostic biomarkers of LUAD. The drug targets were labeled in green, prognostic biomarkers colored in yellow, and the common markers from both sets were colored in black. g The expression patterns of targetable mutations (red) and potential drug targets of EGFR mutant (blue) of LUAD. h The expression of AQP5 in LUAD. Immunofluorescence staining indicated the location of AQP5 level in lung cancer cells (green), SPB (Surfactant protein B) was the marker of lung adenocarcinoma cells (red); AGER (advanced glycosylation end-product specific receptor) was the marker of AT1 cells in normal lung, the cell nucleus was co-stained with DAPI (blue); Scale bar, 50 μm. i The cell viability of H1299 cells after overexpression of AQP5. Cell viability detection was completed by CCK8 detection. The P value was calculated using t test. j Kaplan–Meier survival curves for patients with LUAD (n = 513), stratified for patients highly expressed AQP5 and rest patients. P value was calculated using the log-rank test. k The invasion and migration of AQP5 overexpression H1299 cells. Transwell assays were conducted for cell migration (without matrigel) and invasion abilities (with matrigel). Scale bar, 100 μm. l The boxplot shows the number of invasion and migration cells of AQP5 overexpression H1299 cells. The P value was calculated by Student’s t test
Fig. 7
Fig. 7
Subclusters and pseudotime analysis of the malignant basal cells in LUSC. a UMAP of 8016 malignant basal cells from LUSC, colored with different clusters, and the fraction of different stages of each cluster were labeled with a pie chart. b Diffusion map of malignant basal cells from LUSC, colored with different stages. The diffusion map colored with pseudotime was plotted at the left top corner. c Density of pseudotime colored with different stages. d Dot plot of the mean level of expression (dot intensity, blue scale) of cluster makers and indicated basal cell markers and percent of cells in population with detected expression (dot size). Generic markers colored in green, proliferation basal (Bas-p) markers colored in red, proximal basal (Bas-px) markers colored in yellow and differentiating basal (Bas-d) markers colored in blue. e UMAP plot showed the log2 transformed stemness score calculated using the mean level of expression of Bas-p markers. f Heatmap showed the cluster scores of all non-cycling cells (left) and cycling cells (right). Within each group, the cells were defined by maximal score, for cells mapping to one cluster. g The expression of KPNA2 in LUSC. Immunofluorescence staining indicated the location of KPNA2 level in lung cancer cells (green), CK5/6 (Cytokeratin 5/6) was used as the marker of lung squamous carcinoma cells (red), KRT5 (Keratin 5) was used as the marker of basal cells in normal lung, the cell nucleus was co-stained with DAPI (blue); Scale bar, 50 μm

References

    1. Bray F, et al. Global cancer statistics 2018: GLOBOCAN estimates of incidence and mortality worldwide for 36 cancers in 185 countries. CA Cancer J. Clin. 2018;68:394–424. doi: 10.3322/caac.21492. - DOI - PubMed
    1. Herbst RS, Morgensztern D, Boshoff C. The biology and management of non-small cell lung cancer. Nature. 2018;553:446–454. - PubMed
    1. Shi JF, et al. Clinical characteristics and medical service utilization of lung cancer in China, 2005-2014: overall design and results from a multicenter retrospective epidemiologic survey. Lung Cancer. 2019;128:91–100. - PubMed
    1. Guo X, et al. Global characterization of T cells in non-small-cell lung cancer by single-cell sequencing. Nat. Med. 2018;24:978–985. - PubMed
    1. Lambrechts D, et al. Phenotype molding of stromal cells in the lung tumor microenvironment. Nat. Med. 2018;24:1277–1289. - PubMed

Publication types

MeSH terms

Substances