. 2022 Jan 13;13(1):304.
doi: 10.1038/s41467-021-27899-w.

Modeling uniquely human gene regulatory function via targeted humanization of the mouse genome

Affiliations

Modeling uniquely human gene regulatory function via targeted humanization of the mouse genome

Emily V Dutrow et al. Nat Commun. .

Abstract

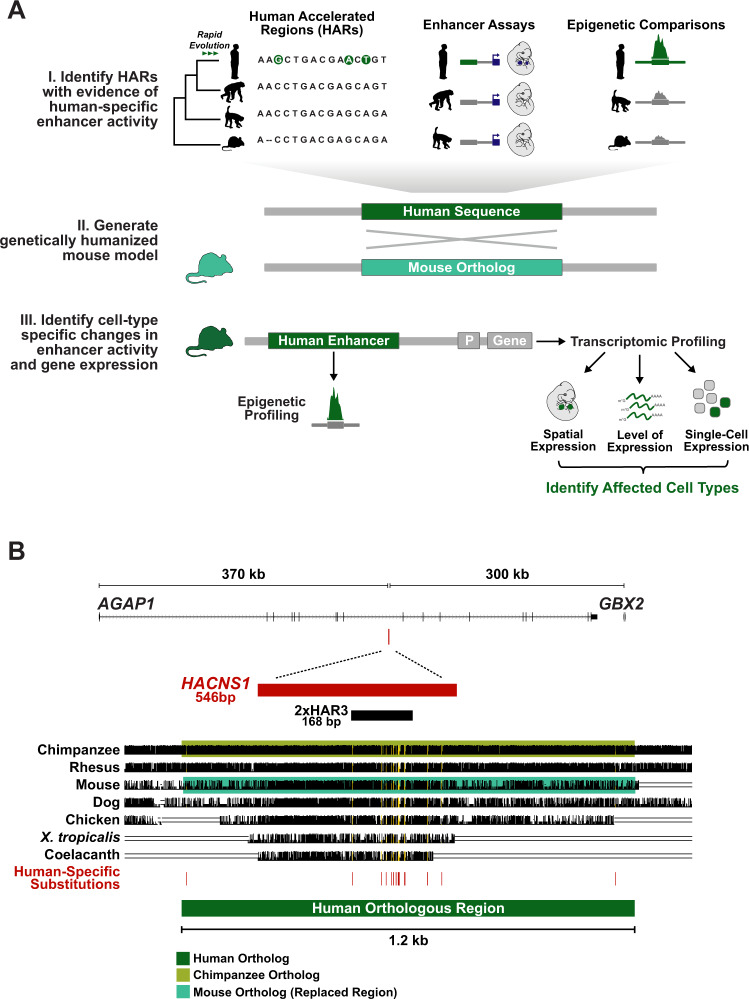
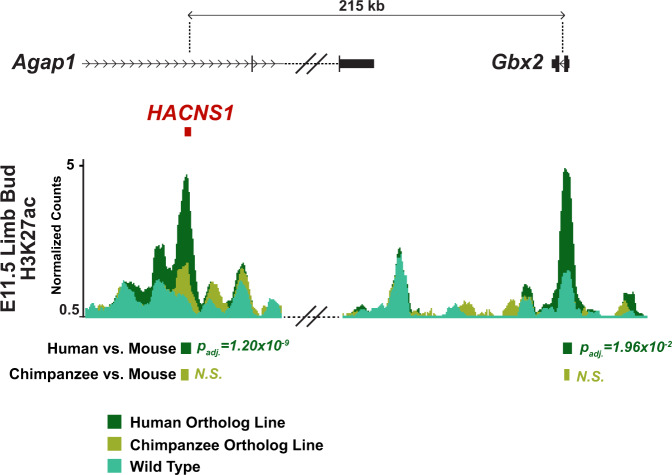
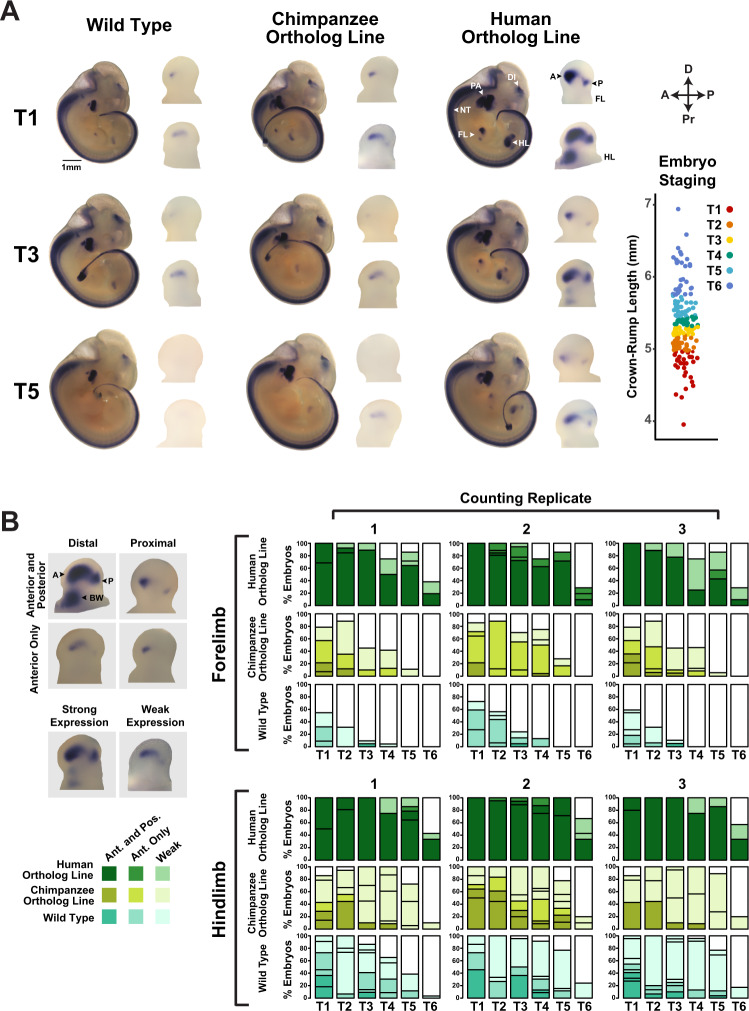
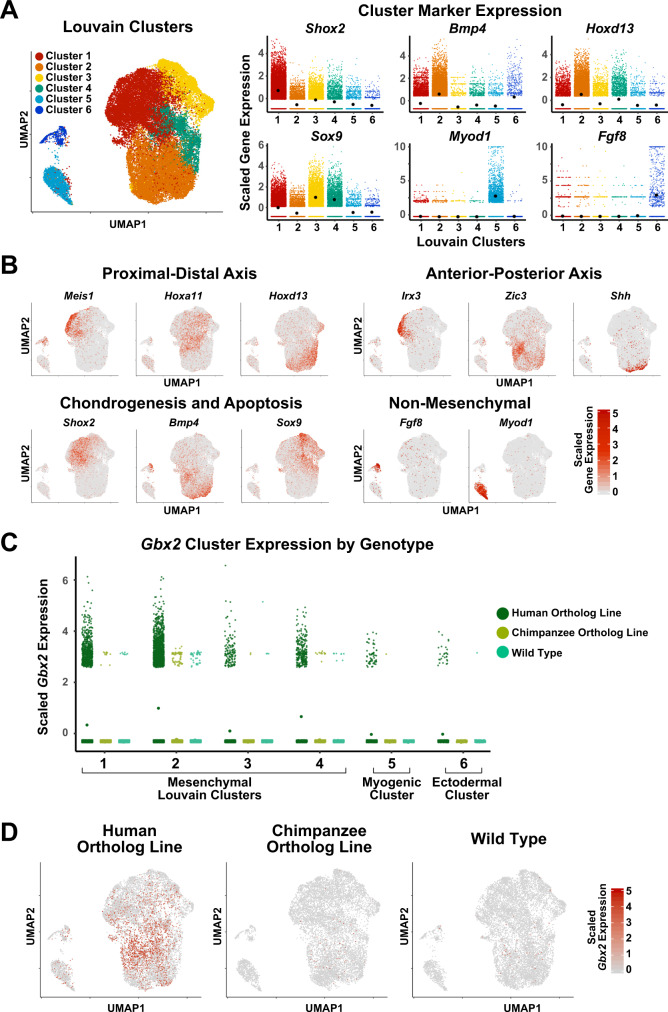
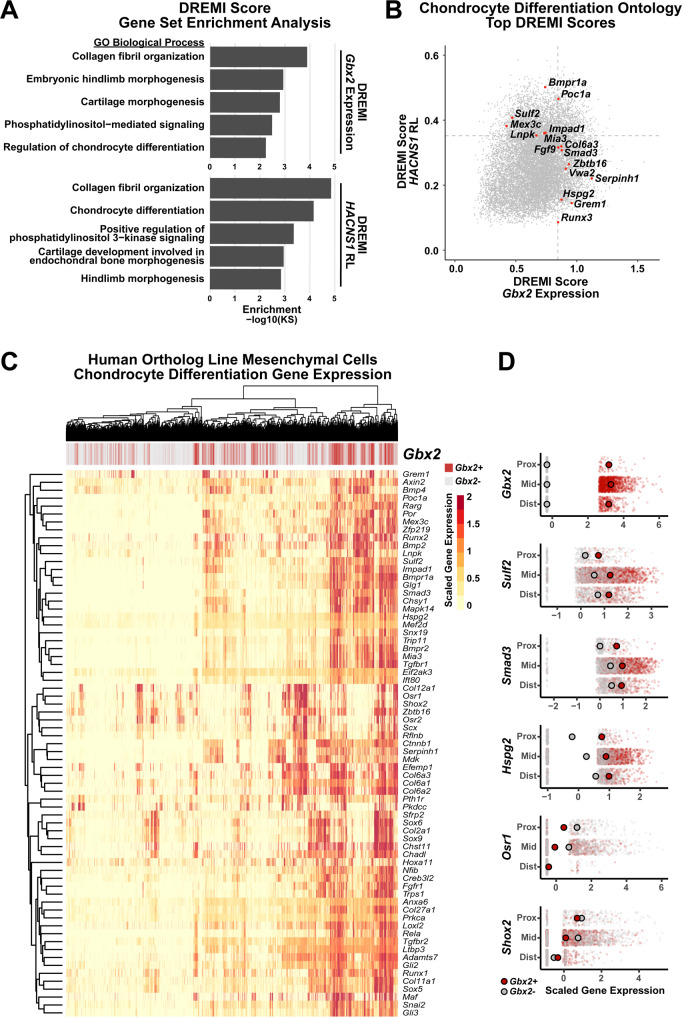
The evolution of uniquely human traits likely entailed changes in developmental gene regulation. Human Accelerated Regions (HARs), which include transcriptional enhancers harboring a significant excess of human-specific sequence changes, are leading candidates for driving gene regulatory modifications in human development. However, insight into whether HARs alter the level, distribution, and timing of endogenous gene expression remains limited. We examined the role of the HAR HACNS1 (HAR2) in human evolution by interrogating its molecular functions in a genetically humanized mouse model. We find that HACNS1 maintains its human-specific enhancer activity in the mouse embryo and modifies expression of Gbx2, which encodes a transcription factor, during limb development. Using single-cell RNA-sequencing, we demonstrate that Gbx2 is upregulated in the limb chondrogenic mesenchyme of HACNS1 homozygous embryos, supporting that HACNS1 alters gene expression in cell types involved in skeletal patterning. Our findings illustrate that humanized mouse models provide mechanistic insight into how HARs modified gene expression in human evolution.


Conflict of interest statement

The authors declare no competing interests.

Figures

Fig. 1
Fig. 1. Generating a knock-in mouse model for the Human Accelerated Region HACNS1.
A Schematic illustrating the generalized workflow we developed to characterize the gene regulatory functions of HARs with prior evidence of human-specific enhancer activity, which we applied to HACNS1 in this study. B The location of HACNS1 in the human genome (GRCh37/hg19) relative to the nearby genes AGAP1 and GBX2. Below, alignment of the human sequence used to generate the HACNS1 knock-in mouse with orthologous sequences from other vertebrate genomes, obtained from the UCSC hg19 100-way Multiz alignment (see Supplementary Data 1 for coordinates). The chimpanzee orthologous sequence used to generate the chimpanzee control line is highlighted in olive, and the mouse sequence replaced in each line is highlighted in teal. The location of each human-specific substitution is indicated by a red line, and the corresponding positions in the alignment are highlighted in yellow. The locations of HACNS1 and 2xHAR3 are shown above the alignment,.
Fig. 2
Fig. 2. Epigenetic signatures of increased activity at HACNS1 and the Gbx2 promoter in the HACNS1 homozygous mouse limb bud.
Epigenetic profiling in the HACNS1 homozygous E11.5 limb bud compared to the chimpanzee ortholog line and wild type. The normalized H3K27ac signals are shown for the HACNS1 line (in dark green), the chimpanzee ortholog line (in olive), and wild type (in teal) (see “Methods”). The location of the edited HACNS1 locus in the human ortholog line relative to nearby genes is shown above the track. The double slanted lines indicate intervening H3K27ac signal data between the edited and wild type loci and Gbx2 that were removed for clarity; see Supplementary Fig. 2 for complete views for each line as well as input signals. H3K27ac peak calls showing significant increases in signal between HACNS1 homozygous and wild type, and the corresponding peak regions compared between the chimpanzee control line and wild type, are shown below the signal track. Litter-matched embryos were used for each comparison (see “Methods”). N.S. not significant. All peak calls for each line are shown in Supplementary Fig. 2. Adjusted P values were obtained using DESeq2 (implemented in HOMER) with a Wald test followed by Benjamini-Hochberg correction,.
Fig. 3
Fig. 3. Spatial and temporal changes in Gbx2 expression driven by HACNS1 in HACNS1 knock-in mouse embryos.
A Spatial and temporal expression of Gbx2 in HACNS1 homozygous, chimpanzee ortholog line, and wild type E11-E12 embryos visualized by whole-mount in situ hybridization (ISH). Representative images are shown for each genotype at three fine-scale time points; see text and associated Source Data for details on staging. Magnified views of Gbx2 expression in limb buds are shown to the right of each embryo. Annotations of anatomical structures and developmental axes are indicated at the top right: FL forelimb, HL hindlimb, DI diencephalon, NT neural tube, PA pharyngeal arch, A anterior, P posterior. The arrows at the top far right indicate the anterior-posterior (A-P) and proximal-distal (Pr-D) axes for the magnified limb buds. Bottom right: Crown-rump lengths for all embryos assayed for Gbx2 mRNA expression by ISH. Each point indicates a single embryo. Colors denote each fine-scale time point (T1-T6). B Left: representative images of anterior, posterior, proximal, distal (top), and strong versus weak Gbx2 staining patterns (bottom). Anterior (A), posterior (P), and body wall (BW) domains are denoted on top left limb bud. Right: Gbx2 ISH staining pattern data across 6 developmental timepoints from each of three independent, blinded scorers (marked at top as counting replicates 1–3; see text and Fig. 3A for timepoint scheme and associated Source Data for annotations). The darkest shade for HACNS1 homozygous (dark green), chimpanzee ortholog line (olive), and wild type (teal) represents percentage of forelimbs or hindlimbs showing strong anterior and posterior limb bud staining. Medium-dark shade, as shown in the legend on the left, denotes strong anterior staining only, while the lightest shade denotes weak staining in any domain. Independent biological specimens were analyzed for n = 139 (wild type), n = 103 (chimpanzee ortholog line), and n = 106 (human ortholog line) forelimbs and n = 137 (wild type), n = 103 (chimpanzee ortholog line), and n = 102 (human ortholog line) hindlimbs. For body wall and pharyngeal arch scoring data see Supplementary Fig. 3A, B and associated Source Data.
Fig. 4
Fig. 4. Single-cell transcriptome analysis of E11.5 hindlimb bud in HACNS1 knock-in, chimpanzee ortholog line, and wild type embryos.
A Left: UMAP embedding of HACNS1 homozygous, chimpanzee ortholog line, and wild type cells. The colors indicate cell clusters identified by Louvain clustering. Right: Expression of known limb bud cell-type marker genes in each cluster. Black dots denote cluster mean expression. B UMAP embedding of hindlimb bud cells from HACNS1 homozygous, chimpanzee ortholog line, and wild type, showing expression of proximal-distal, anterior-posterior, chondrogenesis-apoptosis, and non-mesenchymal markers. See text and Supplementary Fig. 4 for details. C Expression of Gbx2 in each Louvain cluster, separated by genotype. Dots denote cluster mean expression. D UMAP embeddings illustrating cells expressing Gbx2 (indicated in red) in HACNS1 homozygous, chimpanzee ortholog line, and wild type cells. All gene expression data shown in plots and UMAP embeddings (AD) were imputed using ALRA and centered and scaled using z-scores (see “Methods”).
Fig. 5
Fig. 5. Gbx2-positive mesenchymal cell expression of chondrocyte differentiation markers in HACNS1 homozygous limb bud.
A Ontology enrichments of genes with expression associated with Gbx2 expression (top) and the relative likelihood of the HACNS1 knock-in condition (HACNS1 RL, bottom) in HACNS1 homozygous mesenchymal cells. The log-transformed Gene Set Enrichment Analysis Kolmogorov–Smirnov P value for each category is plotted on the x-axis. Ontologies shown are those overlapping in the Gbx2 expression and HACNS1 RL ontology enrichment lists. See also Supplementary Data 5 and 6. B HACNS1 RL and Gbx2 kNN-DREMI scores are plotted for all genes. Genes ranked in the top 20% of kNN-DREMI scores in the Chondrocyte Differentiation ontology (GO:0002062) for the union of the HACNS1 RL and Gbx2 kNN-DREMI analysis gene lists are colored in red and labeled. Dotted lines indicate the top 20% of values for each dataset. C Heatmap showing expression of genes belonging to the ontology “Chondrocyte Differentiation” (GO:0002062) in all HACNS1 homozygous mesenchymal cells (Louvain clusters 1–4). Hierarchical clustering was used to determine the order of cells (in columns) and genes (in rows). The bar at the top of the heatmap shows Gbx2-positive and Gbx2-negative cells in red and gray, respectively. D Expression of selected genes in Gbx2-positive (red) versus Gbx2-negative (gray) mesenchymal cells belonging to Louvain clusters 1 and 2, partitioned by proximal-distal axis markers as follows: Proximal cells (Prox) are Meis1+, Hoxd13−, Hoxa11−; distal cells (Dist) are Hoxd13+, Hoxa11− and Meis1−; and intermediate cells (Mid) are all remaining Hoxa11 + cells. Cells were randomly down-sampled to enable comparison of equal numbers of Gbx2-positive and Gbx2-negative cells. Larger red and gray dots respectively denote mean expression of each indicated gene in each group in Gbx2-positive and Gbx2-negative cells. All gene expression values shown in C and D were imputed using ALRA and centered and scaled using z-scores (see “Methods”).

References

    1. Reilly SK, Noonan JP. Evolution of gene regulation in humans. Annu. Rev. Genomics Hum. Genet. 2016;17:45–67. - PubMed
    1. Carroll SB. Genetics and the making of Homo sapiens. Nature. 2003;422:849–857. - PubMed
    1. Prabhakar S, Noonan JP, Pääbo S, Rubin EM. Accelerated evolution of conserved noncoding sequences in humans. Science. 2006;314:786. - PubMed
    1. Pollard KS, et al. An RNA gene expressed during cortical development evolved rapidly in humans. Nature. 2006;443:167–172. - PubMed
    1. Pollard KS, Hubisz MJ, Rosenbloom KR, Siepel A. Detection of nonneutral substitution rates on mammalian phylogenies. Genome Res. 2010;20:110–121. - PMC - PubMed

Publication types

MeSH terms