. 2022 Jan 13;12(1):662.
doi: 10.1038/s41598-021-04222-7.

In vitro modulation of Schwann cell behavior by VEGF and PDGF in an inflammatory environment

Affiliations

In vitro modulation of Schwann cell behavior by VEGF and PDGF in an inflammatory environment

Souptik Basu et al. Sci Rep. .

Erratum in

Abstract

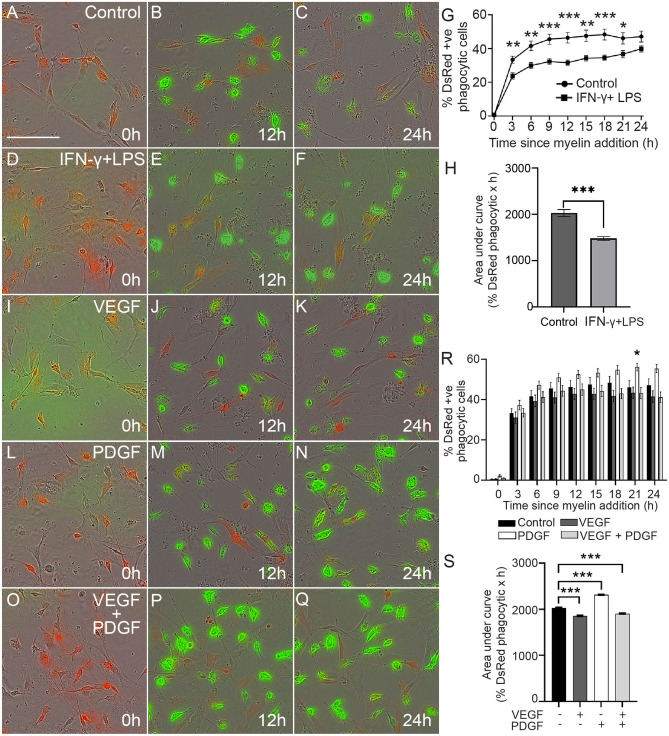
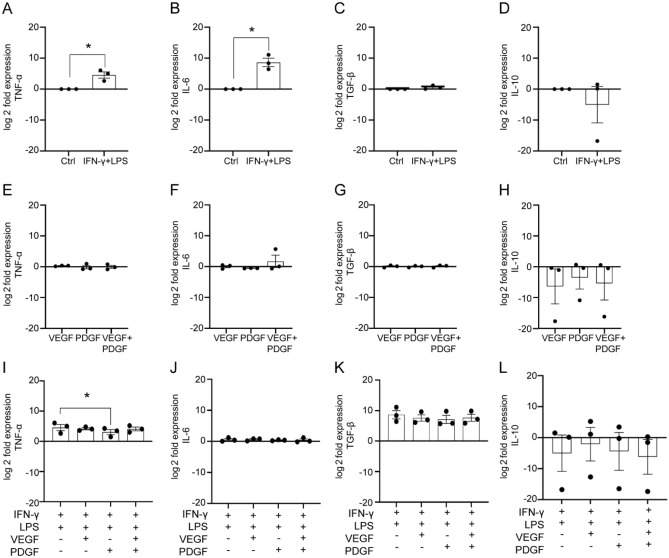
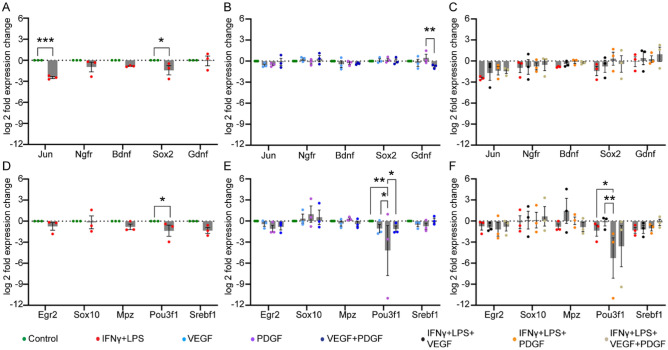
Peripheral glial cell transplantation with Schwann cells (SCs) is a promising approach for treating spinal cord injury (SCI). However, improvements are needed and one avenue to enhance regenerative functional outcomes is to combine growth factors with cell transplantation. Vascular endothelial growth factor (VEGF) and platelet-derived growth factor (PDGF) are neuroprotective, and a combination of these factors has improved outcomes in rat SCI models. Thus, transplantation of SCs combined with VEGF and PDGF may further improve regenerative outcomes. First, however, we must understand how the two factors modulate SCs. In this in vitro study, we show that an inflammatory environment decreased the rate of SC-mediated phagocytosis of myelin debris but the addition of VEGF and PDGF (alone and combined) improved phagocytosis. Cytokine expression by SCs in the inflammatory environment revealed that addition of PDGF led to significantly lower level of pro-inflammatory cytokine, TNF-α, but IL-6 and anti-inflammatory cytokines (TGF-β and IL-10), remained unaltered. Further, PDGF was able to decrease the expression of myelination associated gene Oct6 in the presence of inflammatory environment. Overall, these results suggest that the use of VEGF and/or PDGF combined with SC transplantation may be beneficial in SCI therapy.


Conflict of interest statement

The authors declare no competing interests.

Figures

Figure 1
Figure 1
Effect of VEGF, PDGF on cell counts and viability of SCs. (A–P) Confocal images show examples of DsRed-expressing (orange), p75NTR (green) and EdU positive (red) SCs treated for 24 h with (A–D) medium alone (control), (E–H) VEGF, (I–L) PDGF and (M–P) Combined VEGF and PDGF. Blue: nuclei (Hoechst stain). Scale bar: 100 µm. (Q–S) EdU and p75NTR positive cell counts per fields of view (FOV) in relation to control (medium alone, set to 1) for cells treated with different concentrations of (Q) VEGF, (R) PDGF and (S) VEGF + PDGF. (T–V) Viability (assessed by resazurin assay) of SCs treated with (T) VEGF, (U) PDGF and (V) VEGF + PDGF. (W, X) Effects of VEGF and PDGF on SC proliferation in a pro-inflammatory environment (1 ng/mL IFN-γ + 100 ng/mL LPS); (W) EdU and p75NTR positive cell counts; (X) Metabolic activity (resazurin assay). Dashed lines represent normalisation of EdU count to control (set at 1). * p ≤ 0.05, ** p ≤ 0.01, *** p ≤ 0.001 measured using one way ANOVA with post hoc Dunn’s test. Error bar represents mean ± SEM for three biological replicates.
Figure 2
Figure 2
Effects of inflammatory mediators and growth factors on myelin phagocytosis by SCs. (A–F) Representative time-lapse images at 0, 12 and 24 h post myelin exposure; images show DsRed-expressing SCs (red) with internalized myelin debris (green). (A–C) control, (D–F) inflammatory environment (IFN-γ + LPS). (G) Graph showing the percentage of DsRed SCs containing myelin debris at different times (3 h intervals) over 24 h, for the control condition and the inflammatory condition (IFN-γ + LPS). (H) Graph showing total phagocytosis efficacy (AUC for percentage of DsRed SCs containing myelin debris across 24 h) for control cells and cells in the inflammatory condition (IFN-γ + LPS). (I–Q) Time-lapse images of cells in control medium (no inflammatory mediators) with (I–K) VEGF (50 ng/mL), (L–N) PDGF (50 ng/mL) or (O–Q) VEGF + PDGF (both 50 ng/mL). (R) Graph shows percentages of DsRed SCs containing internalized myelin debris over 24 h for the control, VEGF, PDGF and VEGF + PDGF conditions. (S) Graph shows total phagocytosis efficacy (AUC over 24 h) for the control, VEGF, PDGF and VEGF + PDGF conditions. * p ≤ 0.05, ** p ≤ 0.01, *** p ≤ 0.001 measured using two-way ANOVA with post hoc Fisher’s LSD test for (G) and (R); unpaired two-tailed t-test for (H) and one-way ANOVA followed by Dunnett’s multiple comparisons test for (S). Error bar represents mean ± SEM for three technical replicates of three biological replicates. Scale bar in time-lapse images (shown in A): 100 μm.
Figure 3
Figure 3
Phagocytosis of myelin debris by SCs in inflammatory conditions co-stimulated with growth factors. (A–I) Time lapse images of DsRed SCs (red) phagocytosing myelin debris (green) at 0, 12 and 24 h. Shown are representative time-lapse images for SCs in the pro-inflammatory condition with (A–C) VEGF, (D–F) PDGF and (G–I) VEGF + PDGF. Scale bar: 100 μm. (J) Graph shows the percentages of SCs containing internalized myelin debris over 24 h in the presence of inflammatory mediators only (IFN-γ + LPS), or inflammatory mediators combined with VEGF, PDGF or VEGF + PDGF. * p ≤ 0.05, ** p ≤ 0.01; two-way ANOVA with Fisher’s LSD post hoc test. (K) Total phagocytic efficacy (AUC for 24 h) for the same groups as described in (J). Colour of the bars represent the variable conditions in both (K) and (J). *** p ≤ 0.001; one-way ANOVA with Dunnett’s multiple comparisons test. Error bar represents mean ± SEM for three technical replicates of three biological replicates.
Figure 4
Figure 4
qPCR analysis of effects of VEGF and PDGF on cytokine gene expression in SCs in inflammatory and non-inflammatory conditions. (A–D) Effect on cytokine gene expression in control and inflammatory condition (IFN-γ + LPS). Bar graphs representing log twofold expression comparison of cytokine genes: TNF-α (A), IL-6 (B), TGF-β (C) and IL-10 (D). (E–H) Effect of VEGF and/or PDGF on cytokine gene expression (without inflammatory condition). Bar graphs representing log twofold expression comparison of cytokine genes: TNF-α (E), IL-6 (F), TGF-β (G) and IL-10 (H). (I–L) Effect of VEGF and PDGF on cytokine gene expression in the presence of inflammatory condition. Bar graphs representing log twofold expression comparison of cytokine genes: TNF-α (I), IL-6 (J), TGF-β (K) and IL-10 (L). * p ≤ 0.05, measured using unpaired t-test with Welche’s correction for (AD) and one way ANOVA followed by post hoc Fisher’s LSD test for (EL). Error bar represents mean ± SEM for three biological replicates.
Figure 5
Figure 5
Effects of PDGF and VEGF on the SC cytokine profile in inflammatory and non-inflammatory conditions (A–D) Effects of an inflammatory environment on SC-mediated secretion of pro-inflammatory cytokines TNF-α (A), IL-6 (B) and anti-inflammatory cytokines TGF-β (C), IL-10 (D). (E–H) Effects of growth factors alone on TNFα (E), IL-6 (F), TGFβ (G) and IL-10 (H) cytokine levels. (I–L) Effects of growth factors in inflammatory environment on TNF-α (I), IL-6 (J), TGF-β (K) and IL-10 (L) cytokine levels. Dashed lines represent the lowest detectable limit of the kit for each cytokine (TNF-α, TGF-β at 8 pg/mL, IL-6 at 4 pg/mL and IL-10 at 32 pg/mL). * p ≤ 0.05, measured using Mann–Whitney U test for (A–D) and one-way ANOVA followed by post hoc Dunn’s test for (EL). Error bar represents mean ± SEM for three technical replicates of three biological replicates. (Note: The y-axis scale of TGF-β on C, G and K are different).
Figure 6
Figure 6
Effects of VEGF and PDGF on the expression of genes associated with nerve repair and myelination in SCs, with and without inflammatory condition. (A–C) Bar graphs of log twofold expression changes of nerve repair associated genes in (A) untreated control vs inflammatory medium (IFN-γ + LPS), (B) control vs VEGF vs PDGF vs combined VEGF + PDGF, (C) VEGF, PDGF, combined VEGF + PDGF in inflammatory medium. (D–F) myelination associated genes of (D) control vs inflammatory medium (IFN-γ + LPS), (E) control vs VEGF vs PDGF vs combined VEGF + PDGF, (F) VEGF, PDGF, combined VEGF + PDGF in inflammatory medium. Asterisk represents * p ≤ 0.05, ** p < 0.01, *** p < 0.001, all were measured using two-way ANOVA followed by post hoc Fisher’s LSD test. Error bar represents mean ± SEM for three biological replicates.

References

    1. Dalamagkas K, Tsintou M, Seifalian AM. Stem cells for spinal cord injuries bearing translational potential. Neural Regen. Res. 2018;13:35. doi: 10.4103/1673-5374.224360. - DOI - PMC - PubMed
    1. Kang Y, et al. Epidemiology of worldwide spinal cord injury: a literature review. J. Neurorestoratol. 2018;6:3.
    1. Hulsebosch, C. E. Recent advances in pathophysiology and treatment of spinal cord injury. Adv. Physiol. Edu. (2002). - PubMed
    1. Hurlbert RJ, et al. Pharmacological therapy for acute spinal cord injury. Neurosurgery. 2015;76:S71–S83. doi: 10.1227/01.neu.0000462080.04196.f7. - DOI - PubMed
    1. Gant, K. L. et al. Phase 1 safety trial of autologous human schwann cell transplantation in chronic spinal cord injury. J. Neurotrauma (2021). - PMC - PubMed

Publication types

MeSH terms

Substances