. 2022 Mar;6(3):307-314.
doi: 10.1038/s41559-021-01644-4. Epub 2022 Jan 13.

Ecological network complexity scales with area

Affiliations

Ecological network complexity scales with area

Núria Galiana et al. Nat Ecol Evol. 2022 Mar.

Abstract

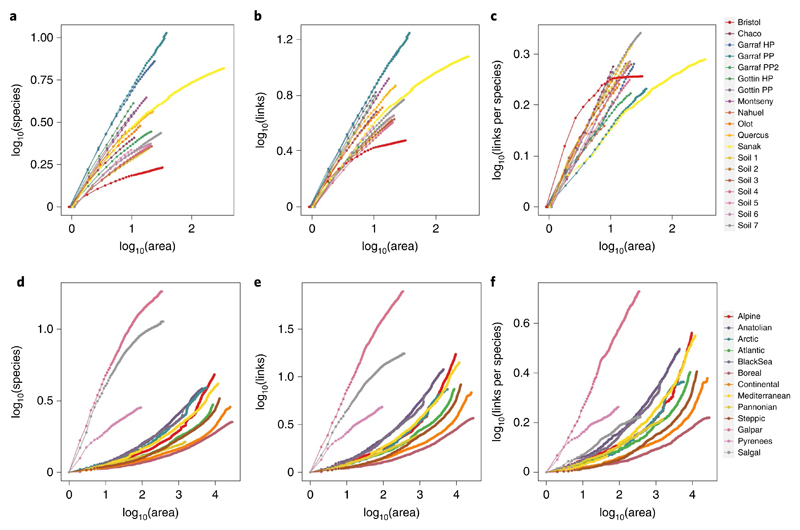
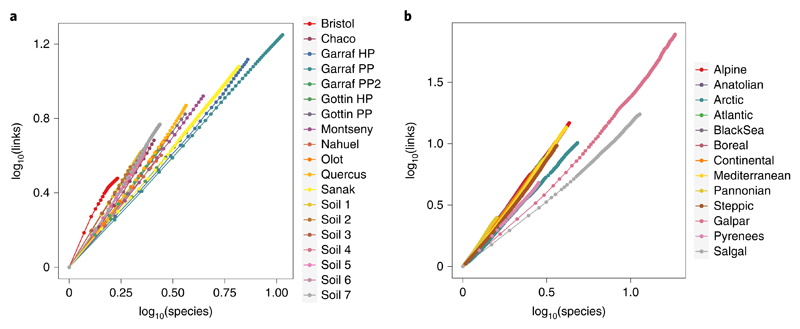
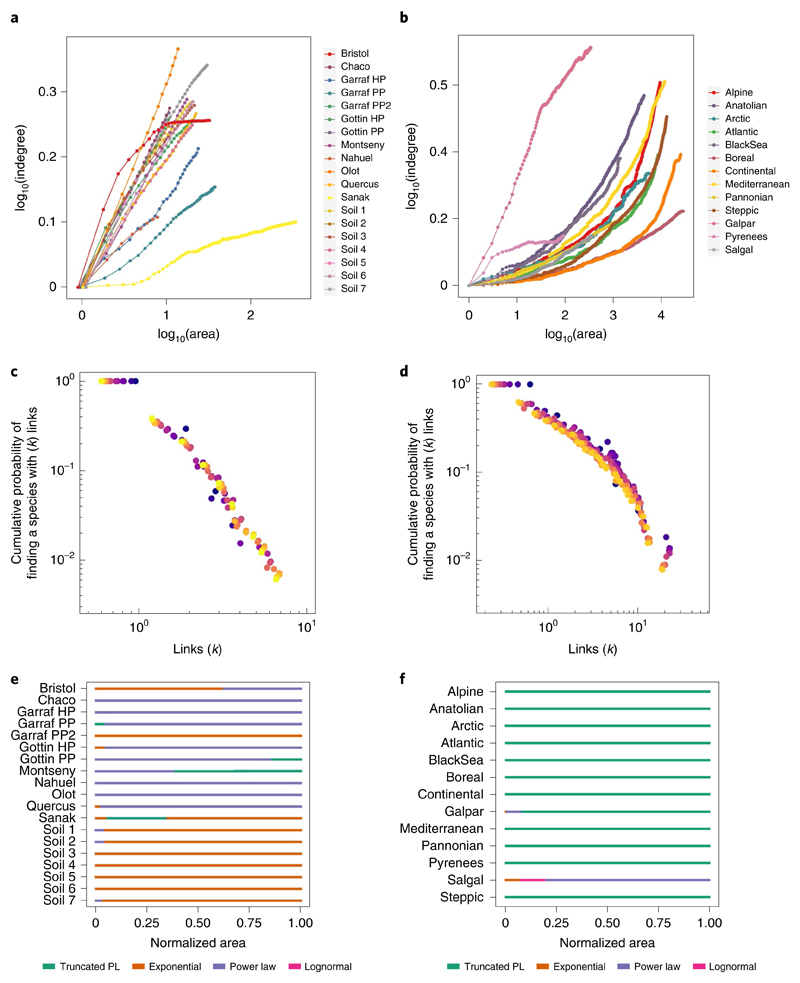
Larger geographical areas contain more species-an observation raised to a law in ecology. Less explored is whether biodiversity changes are accompanied by a modification of interaction networks. We use data from 32 spatial interaction networks from different ecosystems to analyse how network structure changes with area. We find that basic community structure descriptors (number of species, links and links per species) increase with area following a power law. Yet, the distribution of links per species varies little with area, indicating that the fundamental organization of interactions within networks is conserved. Our null model analyses suggest that the spatial scaling of network structure is determined by factors beyond species richness and the number of links. We demonstrate that biodiversity-area relationships can be extended from species counts to higher levels of network complexity. Therefore, the consequences of anthropogenic habitat destruction may extend from species loss to wider simplification of natural communities.


Conflict of interest statement

Competing interests

The authors declare no competing interests.

Figures

Fig. 1
Fig. 1. Spatial scaling of network complexity.
a–f, The relationship of species (a,d), links (b,e) and links per species (c,f) with area for regional (ac) versus biogeographical (d–f) networks. For each dataset, each point represents the mean value of the analysed network property across the total amount of replicates in the aggregation procedure for a given area. For all datasets, all network properties have been rescaled to start at 0 for visualization purposes. In the biogeographical domain, three datasets show a linear-concave increase of the number of species, network links and links per species with area, similar to those observed in the regional domain; these differences may be explained by differences in sampling methods among datasets (Methods and Supplementary Text 1).
Fig. 2
Fig. 2. Scaling of the number of links with species richness.
a,b, For networks spanning both regional (a) and biogeographical (b) spatial domains, the number of links scales with species following a power law (Supplementary Table 2). Each point represents the mean values across all replicates in the aggregation procedure. Note that for visualization purposes, all x and y values in all datasets have been rescaled to start at 0. To allow convenient comparison with the constant connectance hypothesis and the link–species scaling law, the slope of each log–log relationship is provided in Supplementary Table 2. Note that for constant connectance, the slope equals 2, as the number of links in a web increases approximately as the square of the number of trophic species: L≈S2. For the link-species scaling law, the slope equals 1, as the number of links per species in a web is constant and scale invariant at roughly two: L ≈ 2S).
Fig. 3
Fig. 3. Spatial scaling of mean indegree and network degree distribution.
a,b, The mean number of resources per consumer (mean indegree) increases with area within both regional (a) and biogeographical (b) spatial domains. Each point represents the mean value across every replicate in the aggregation procedure at a given area. Note that for visualization purposes, all x and y values in all datasets have been rescaled to start at 0. The shape of the network degree distributions is consistent across area at both regional and biogeographical domains. c,d, Two datasets are shown as illustration: Garraf-PP (c, regional) and Galpar, (d, biogeographical) (Supplementary Text 1). The cumulative probabilities of finding a species in the network that has k links to resources in the network are normalized by the mean number of links per species in the network. One replicate for a subset of areas is shown for each dataset to facilitate visualization. Each colour represents network degree distribution for a given area, from dark blue, representing the smallest area (1 spatial unit), to yellow, representing the largest area for each dataset (40 spatial units for Garraf-PP and 373 spatial units for Galpar). Notice that the starting point of each distribution changes with area, indicating that at smaller spatial scales, the most specialized species of the network have more interacting partners than at larger spatial scales. Yet the shape of the degree distribution is preserved. e,f, The top-ranked model describing the degree distribution of each ecological network across the area range for regional (e) and biogeographical (f) domains. Although the degree distribution of most ecological networks was characterized by the same function along the range of areas, the specific shape of each function changed with area (Supplementary Fig. 4). Area values were rescaled between 0 and 1.

References

    1. Arrhenius O. Species and area. J Ecol. 1921;9:95–99.
    1. MacArthur RH, Wilson EO. The Theory of Island Biogeography. Princeton Univ. Press; 1967.
    1. Rosenzweig ML. Species Diversity in Space and Time. Cambridge Univ. Press; 1995.
    1. Smith AB, Sandel B, Kraft NJB, Carey S. Characterizing scale-dependent community assembly using the functional-diversity-area relationship. Ecology. 2013;94:2392–2402. - PubMed
    1. Mazel F, et al. Multifaceted diversity-area relationships reveal global hotspots of mammalian species, trait and lineage diversity. Glob Ecol Biogeogr. 2014;23:836–847. - PMC - PubMed

Publication types