. 2022 Jan;24(1):51-61.
doi: 10.1038/s41556-021-00812-9. Epub 2022 Jan 13.

53BP1-shieldin-dependent DSB processing in BRCA1-deficient cells requires CST-Polα-primase fill-in synthesis

Affiliations

53BP1-shieldin-dependent DSB processing in BRCA1-deficient cells requires CST-Polα-primase fill-in synthesis

Zachary Mirman et al. Nat Cell Biol. 2022 Jan.

Abstract

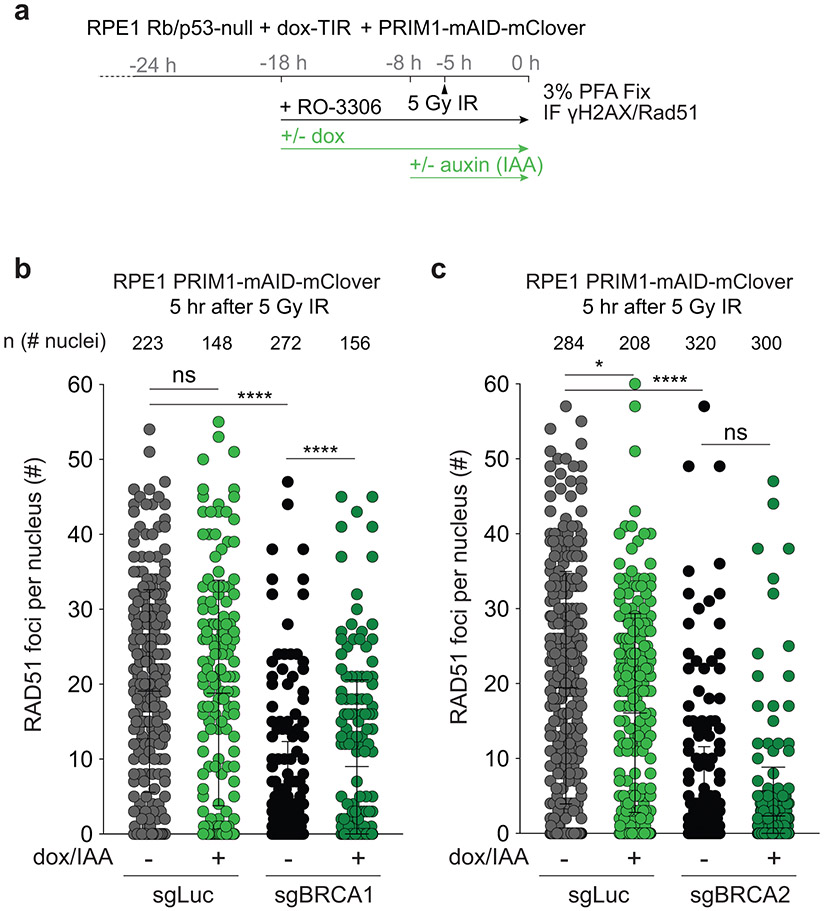
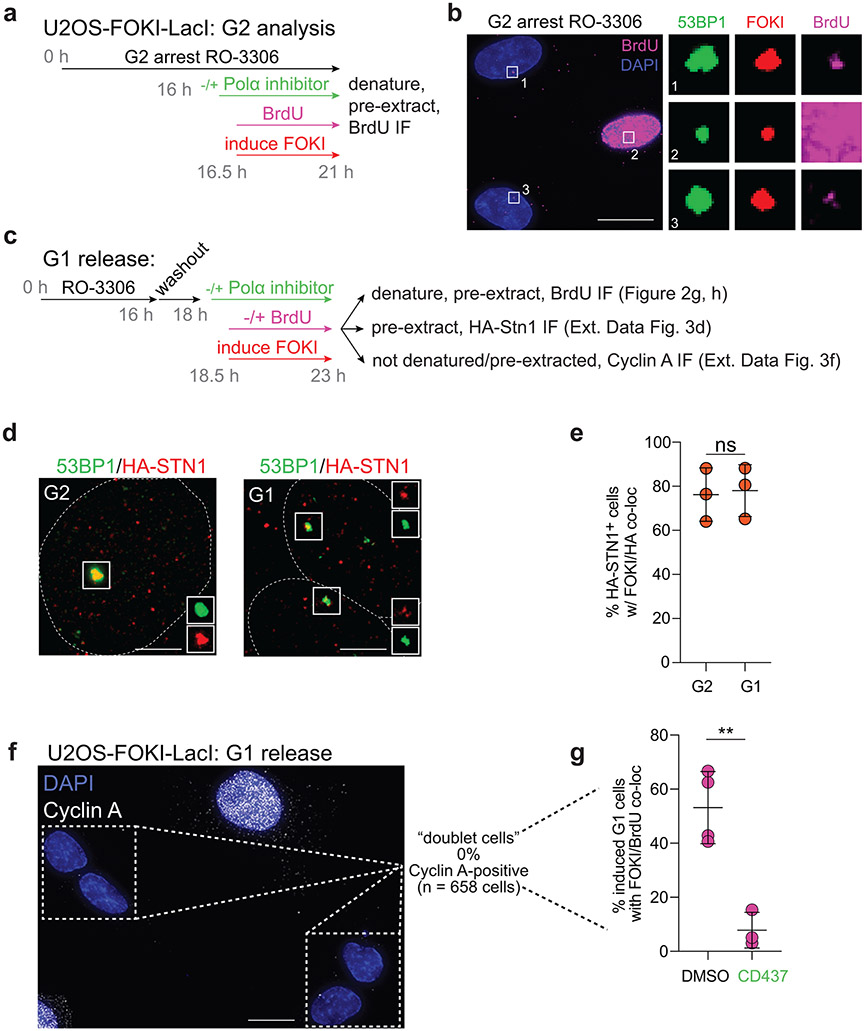
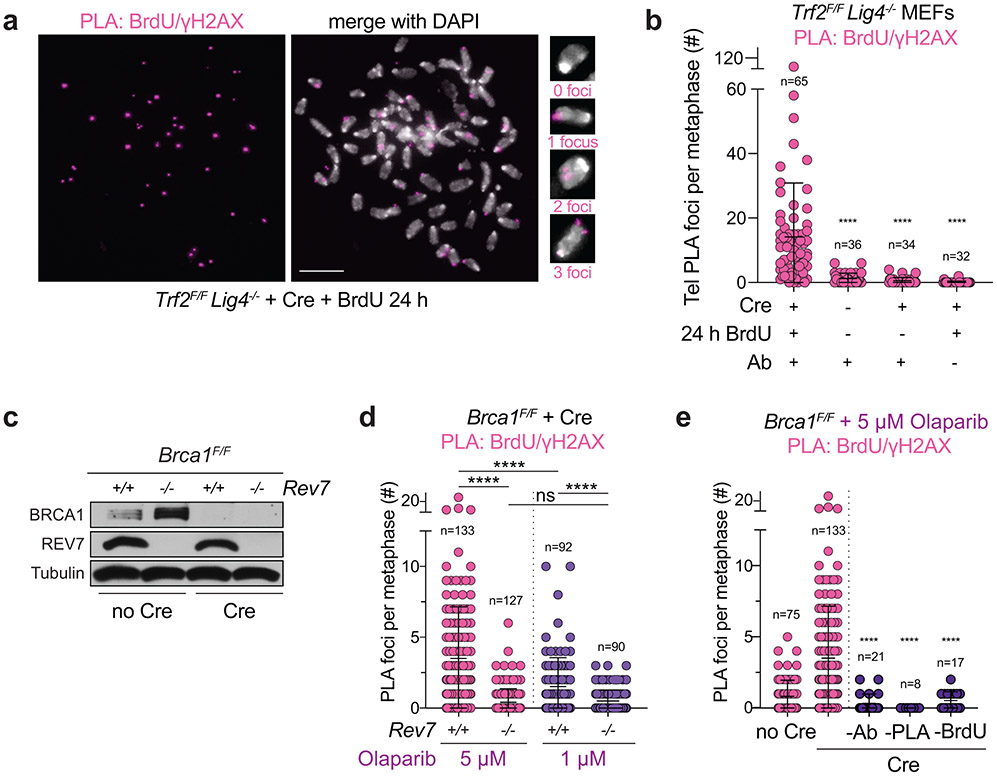
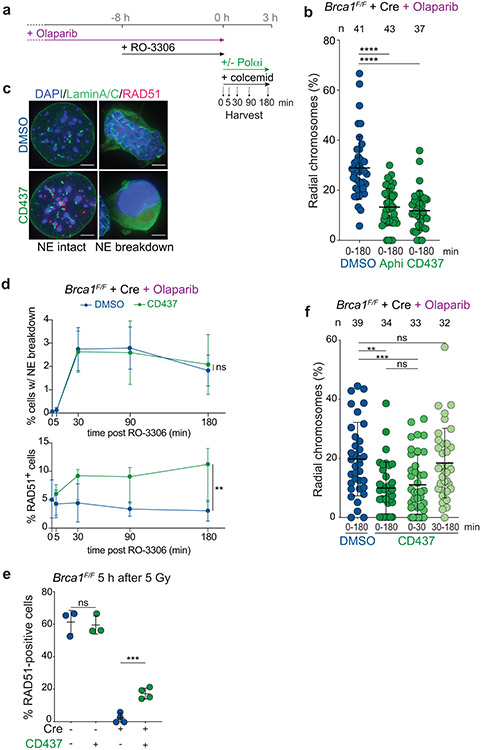
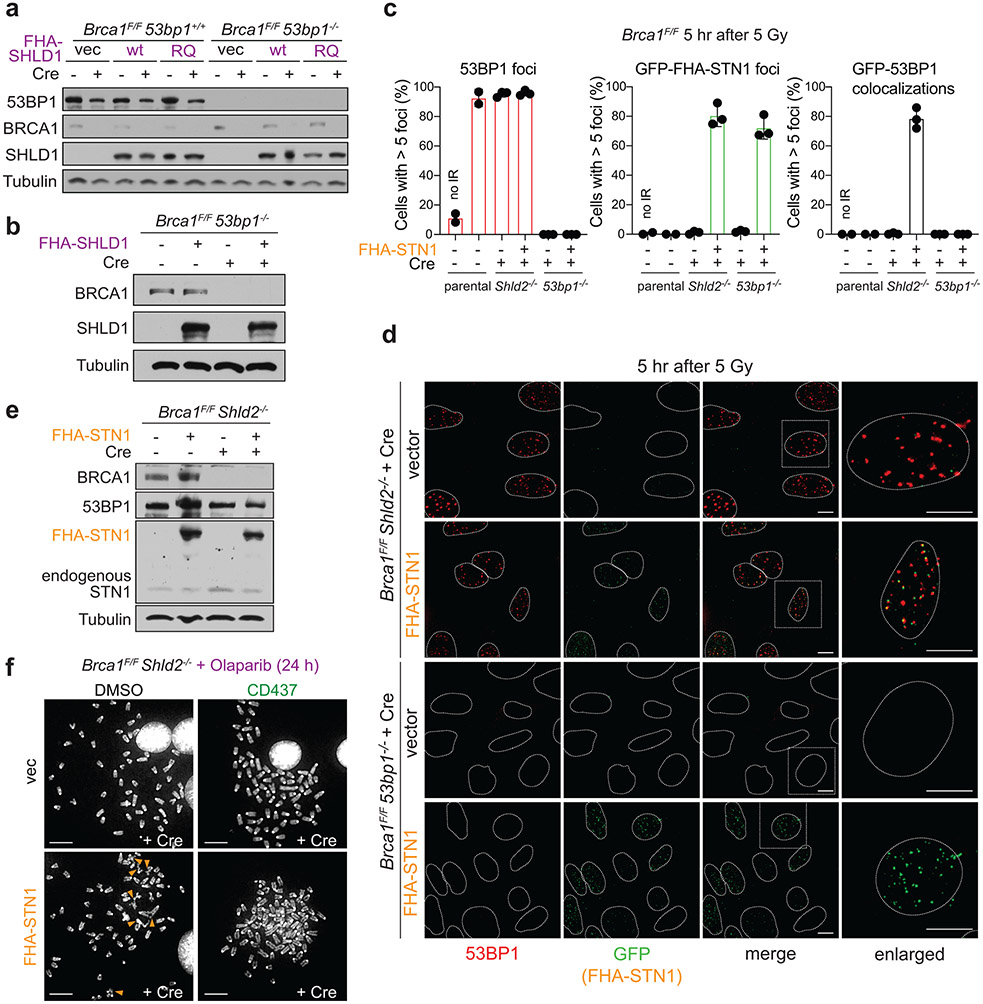
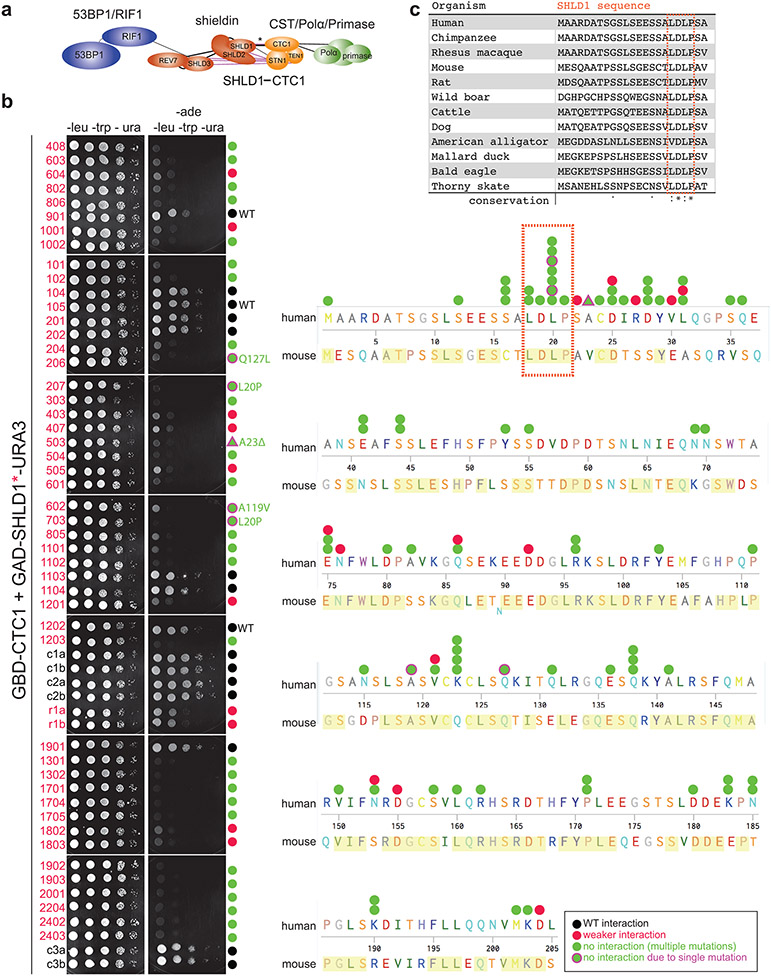
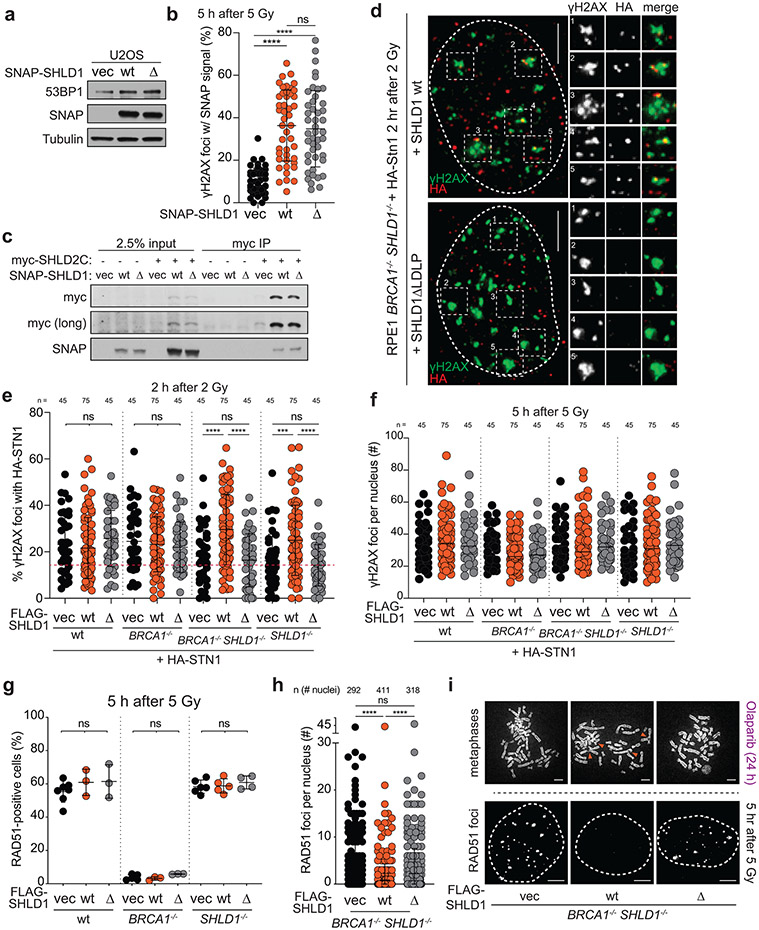
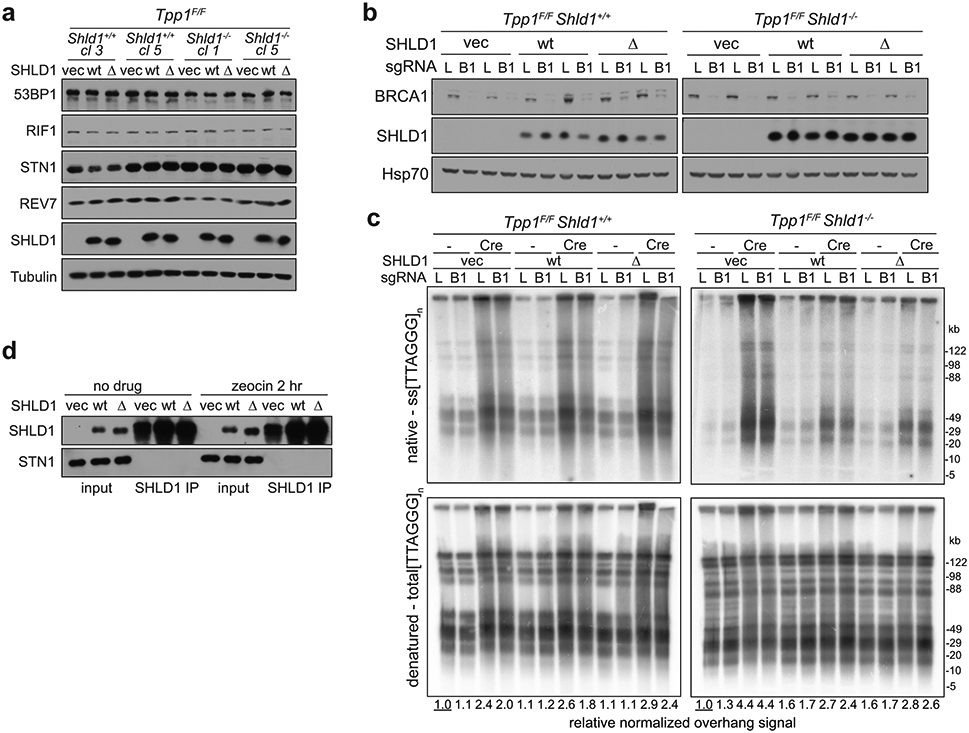
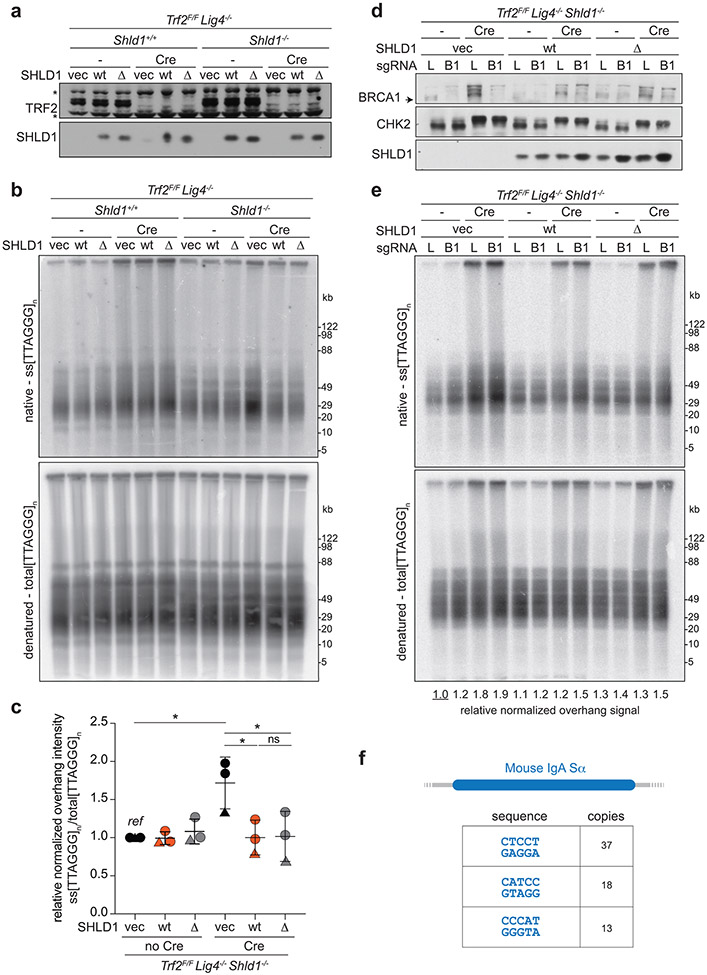
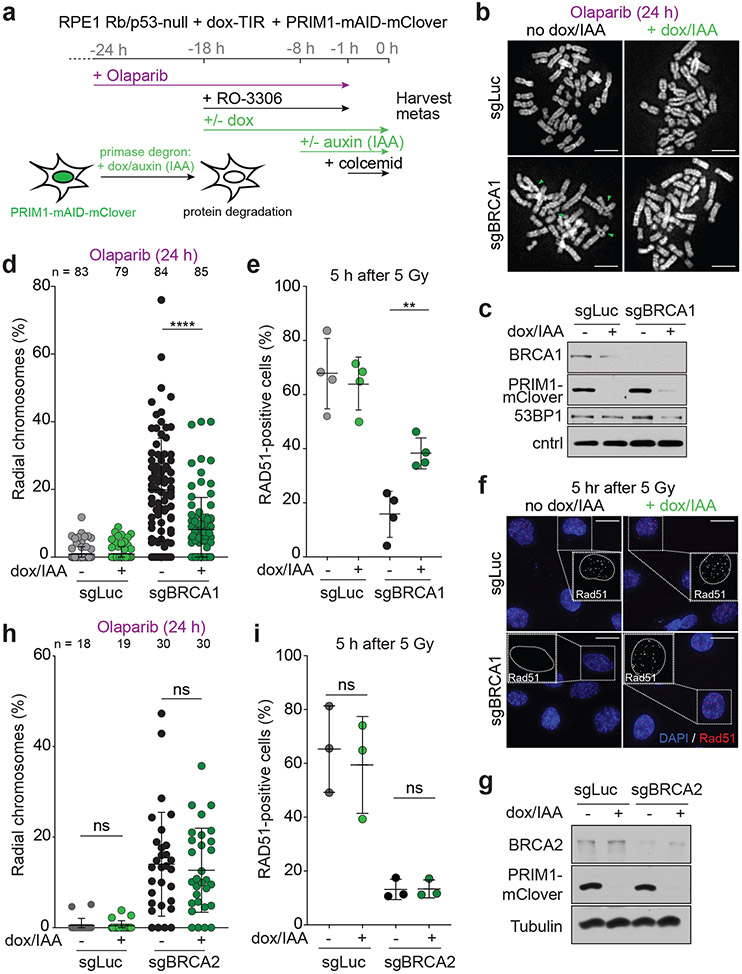
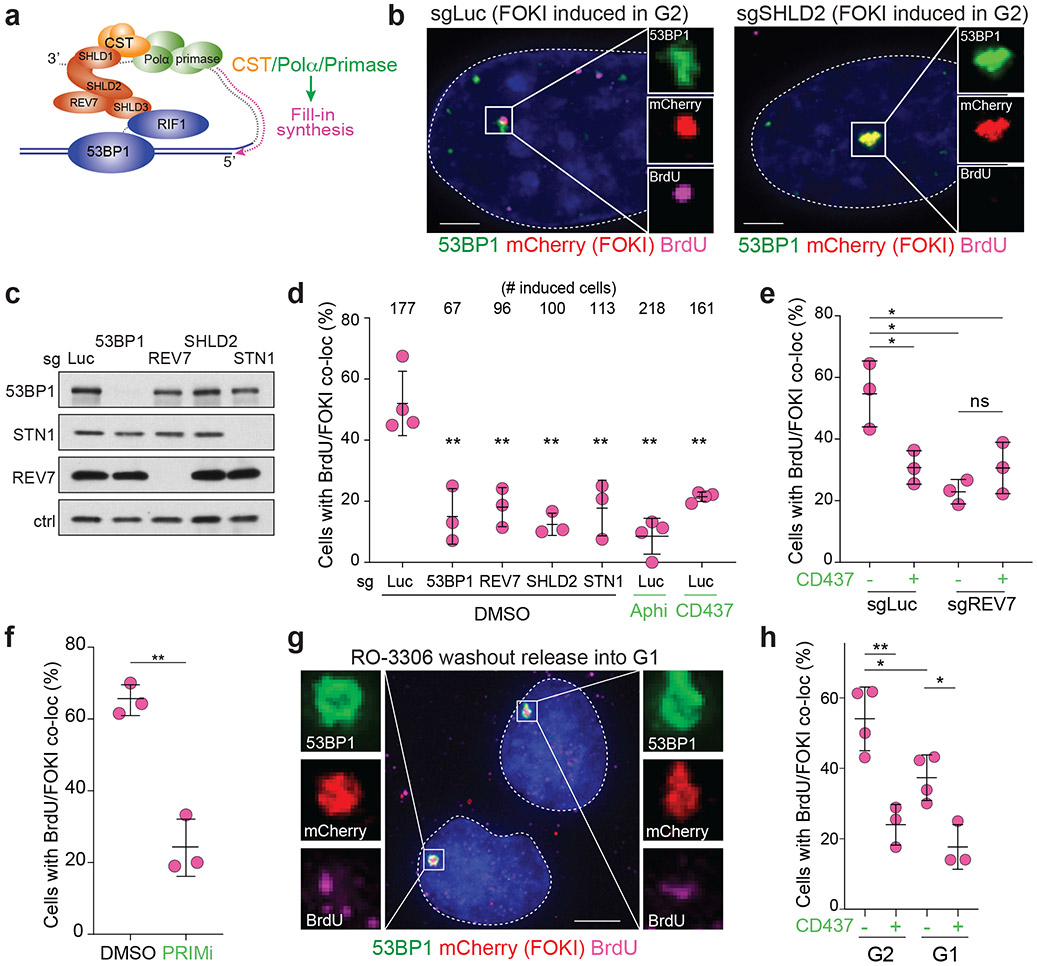
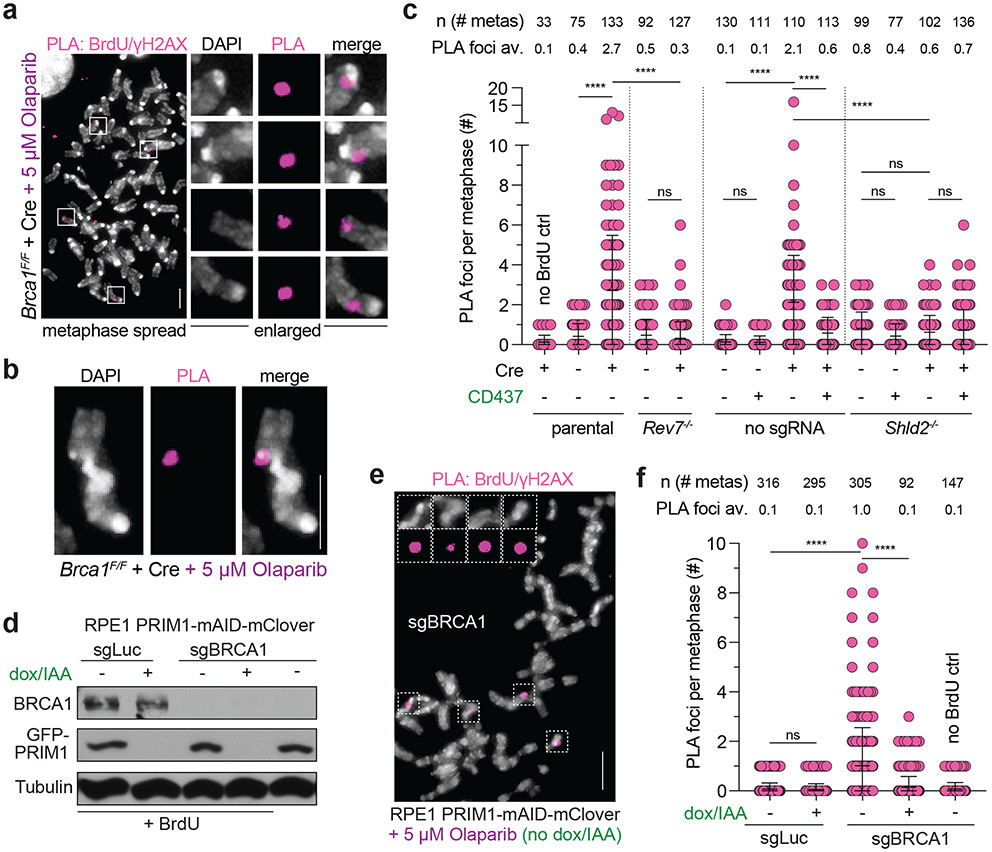
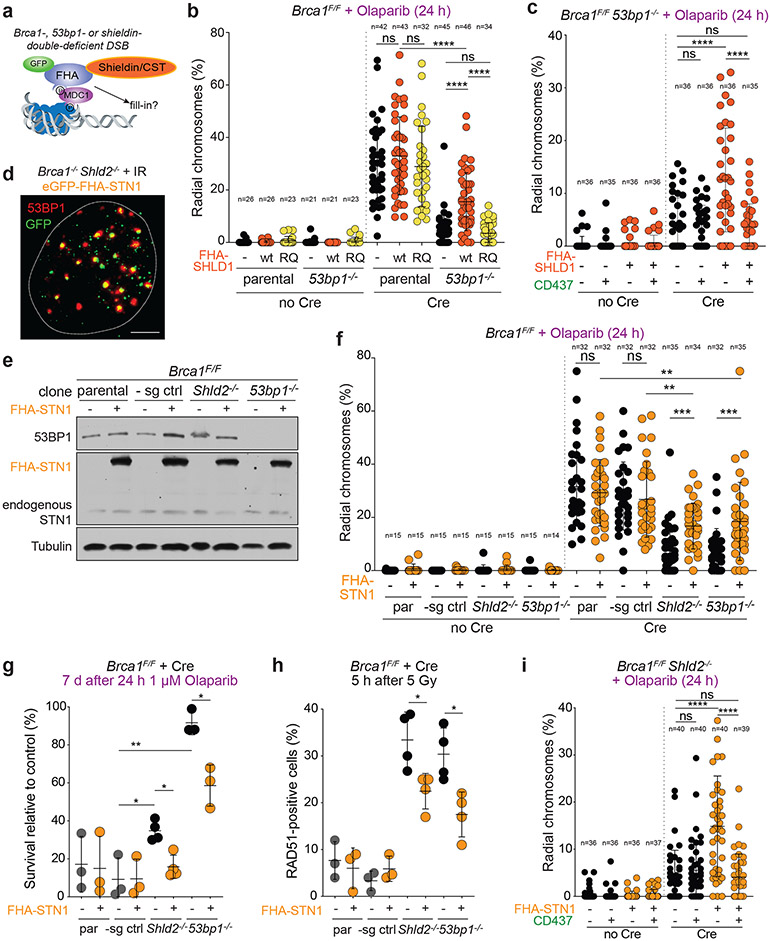
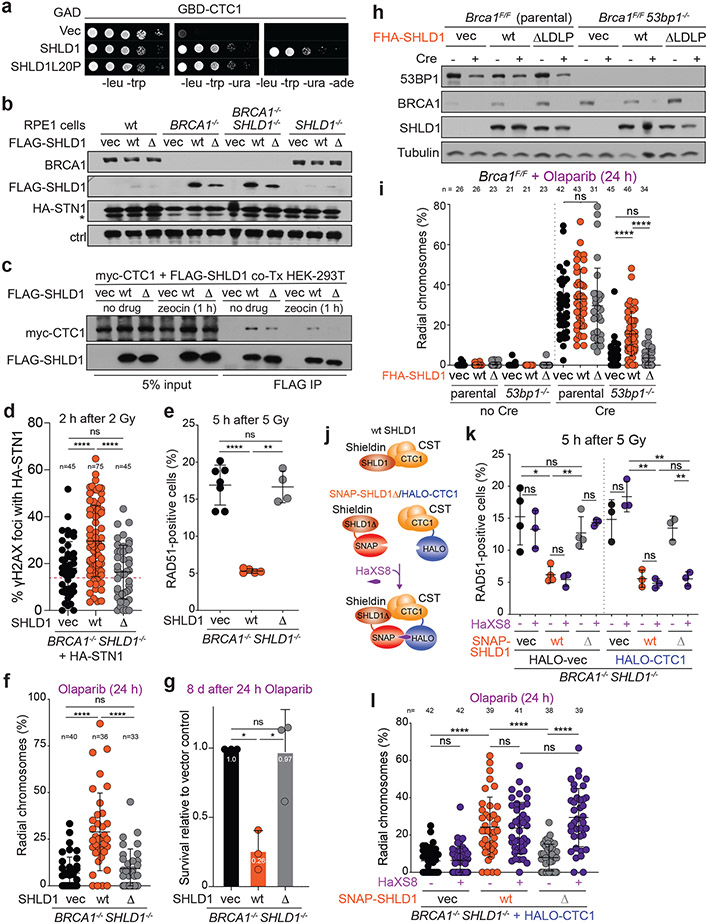
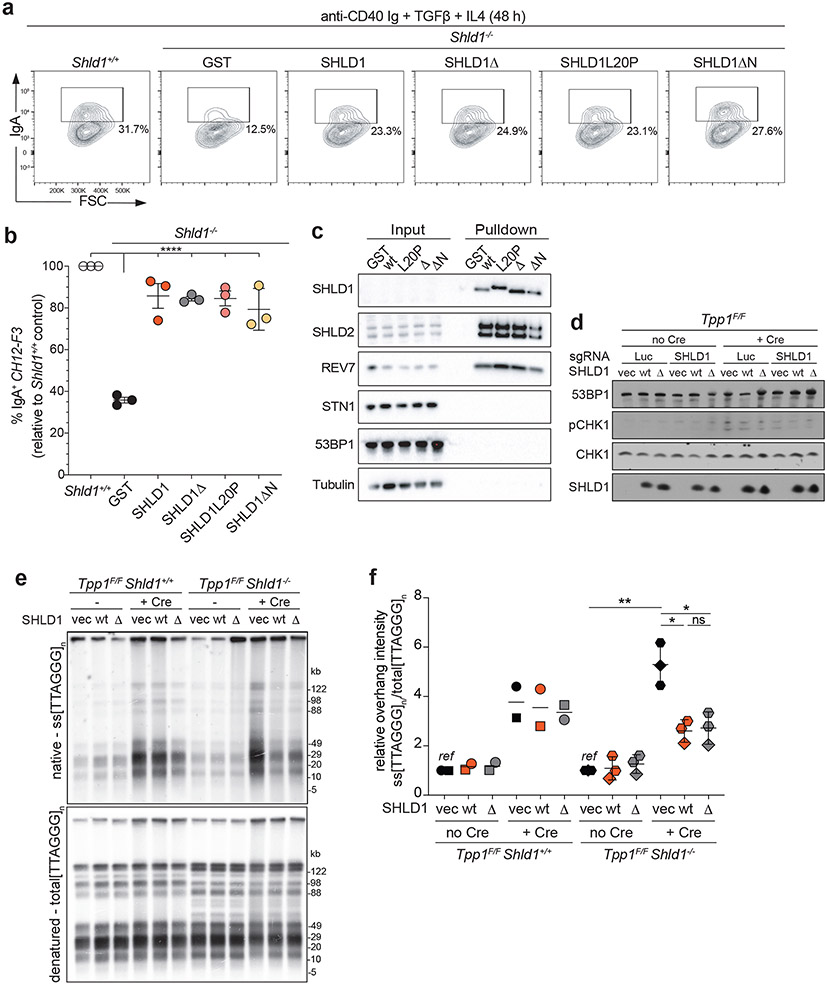
The efficacy of poly(ADP)-ribose polymerase 1 inhibition (PARPi) in BRCA1-deficient cells depends on 53BP1 and shieldin, which have been proposed to limit single-stranded DNA at double-strand breaks (DSBs) by blocking resection and/or through CST-Polα-primase-mediated fill-in. We show that primase (like 53BP1-shieldin and CST-Polα) promotes radial chromosome formation in PARPi-treated BRCA1-deficient cells and demonstrate shieldin-CST-Polα-primase-dependent incorporation of BrdU at DSBs. In the absence of 53BP1 or shieldin, radial formation in BRCA1-deficient cells was restored by the tethering of CST near DSBs, arguing that in this context, shieldin acts primarily by recruiting CST. Furthermore, a SHLD1 mutant defective in CST binding (SHLD1Δ) was non-functional in BRCA1-deficient cells and its function was restored after reconnecting SHLD1Δ to CST. Interestingly, at dysfunctional telomeres and at DNA breaks in class switch recombination where CST has been implicated, SHLD1Δ was fully functional, perhaps because these DNA ends carry CST recognition sites that afford SHLD1-independent binding of CST. These data establish that in BRCA1-deficient cells, CST-Polα-primase is the major effector of shieldin-dependent DSB processing.


Figures

Extended Data Fig. 1
Extended Data Fig. 1. Generation and validation of p53/Rb-deficient RPE1 cells with mAID knocked into both PRIM1 loci. Related to Fig. 1.
a, Experimental scheme used to tag endogenous PRIM1 with AID-mClover. b, PCR genotyping of mClover-positive clones. Location of primer sets and the expected PCR band sizes are shown in a. c, Immunoblot for mClover-PRIM1 with PRIM1 or anti-GFP antibody. Clone #10, with both copies of PRIM1 tagged with AID-mClover, was selected for the experiments. d, Schematic of HA-OsTIR1 and immunoblot confirming dox-induced HA-OsTIR1 in subclones of PRIM1-AID-mClover clone #10. e, Immunoblot for GFP showing efficient PRIM1 degradation after the indicated IAA (auxin)/dox treatments in two subclones. f, Immunoblot as in e but testing timing and concentration of IAA. g, IF showing loss of EdU incorporation in subclone #6 after auxin/dox-induced PRIM1-AID degradation indicating the expected inhibition of DNA replication. In g, the number of fields of view (n, each represented by a dot) is indicated. In b-g, the experiment has been performed once. Means are indicated with center bars and SDs with error bars.
Extended Data Fig. 2
Extended Data Fig. 2. Primase blocks RAD51 loading in BRCA1-deficient cells. Related to Fig. 1.
a, Experimental timeline of auxin-induced degradation of PRIM1 in G2-arrested RPE1 cells. 5 hr after 5 Gy IR, cells were harvested for RAD51 IF. b, c, Quantification of number of RAD51 foci per nucleus for cells with the indicated treatments. This data is summarized in Fig. 1 panels e and i. Number of nuclei (n, each represented by a dot) pooled from four independent experiments is indicated. Statistical analyses as in Fig. 1. All means are indicated with center bars and SDs with error bars.
Extended Data Fig. 3
Extended Data Fig. 3. Experimental setup for detection of fill-in synthesis in U2OS-FOKI cells. Related to Fig. 2.
a, Experimental timeline for IF to detect BrdU incorporation at DSBs in G2-arrested U2OS cells. b, Representative IF images of cells as in a visualizing DAPI, 53BP1, mCherry-FOKI, and BrdU. The middle cell displays a global BrdU incorporation pattern, indicative of S phase. Image representative of four independent experiments. Scale bar, 20 μm. c, Experimental timeline and IF protocols for U2OS-FOKI-LacI cells released into G1. d, Representative IF images of HA-STN1 detected in U2OS-FOKI-LacI cells arrested in G2 with RO-3306 or released into G1 (9 μM RO-3306 overnight followed by washout into fresh media for 2 h before induction of FOKI). Nuclear outlines are demarcated by dashed white lines. Scale bars, 5 μm. e, Quantification of HA-STN1 colocalization with FOKI/53BP1 foci in cells as in d. n = three independent experiments. f, Representative IF for Cyclin A in cells as in c. Note the two pairs of small, neighboring, “doublet” cells, which in all cases were Cyclin A-negative. Such cell pairs are likely to represent the two daughter cells from a recent mitosis. Scale bar, 20 μm. g, Quantification of FOKI/BrdU colocalizations in induced, non-S-phase, “doublet” cells as in f after CDKi washout with or without Polα inhibitor. Data from three (CD437) or four (DMSO) independent experiments. Statistical analyses as in Fig. 1. All means are indicated with center bars and SDs with error bars.
Extended Data Fig. 4
Extended Data Fig. 4. MetaPLA for detection of fill-in synthesis in BRCA1-deficient cells. Related to Fig. 3.
a, Representative images from metaPLA of BrdU/γH2AX on metaphase spreads in Trf2F/F Lig4−/− MEFs with the indicated treatment that were used to validate the technique. Scale bar, 10 μm. b, Quantification of terminal, chromatin-associated BrdU/γH2AX PLA foci for cells as in a. c, Immunoblot for BRCA1 and REV7 in the indicated cells with or without Cre treatment as in Fig. 3c. Representative of three independent experiments. d, Quantification of chromatin-associated BrdU/γH2AX PLA foci on metaphase spreads in Brca1F/F MEFs of the indicated genotype, with 5 or 1 μM Olaparib. e, BrdU/γH2AX PLA controls quantified as in d. In b, d, and e, n = the number of metaphases scored in each condition as indicated (n) pooled from three independent experiments. Statistical analyses as in Fig. 1. All means are indicated with center bars and SDs with error bars.
Extended Data Fig. 5
Extended Data Fig. 5. Fill-in synthesis occurs late in G2 in BRCA1-deficient cells.
a, Experimental timeline for Polα inhibition in PARPi-treated, BRCA1-deficient MEFs released from G2 into prolonged (180 min) metaphase arrest. b, Quantification of the percent of chromosomes involved in radial structures. Number of metaphases (n, each represented by a dot) pooled from three independent experiments is indicated. c, Representative sample images of nuclei with intact or broken-down nuclear envelopes (NE) as assessed by Lamin A/C IF. Scale bars, 5 μm. d, Top, analysis of NE breakdown timing after release from G2 in cells as in a and c assessed at the indicated time points. Bottom, analysis of RAD51 foci formation in the same population of cells. Data from three independent experiments. For NE breakdown, Lamin A/C integrity was visually assessed in at least 800 cells per condition per experiment. For RAD51 foci formation, 50-136 nuclei were analyzed per condition per experiment. e, Quantification of RAD51-positive nuclei in Brca1F/F MEFs following treatment with Cre and IR. n = three (no Cre) or four (+ Cre) independent experiments. f, Quantification of percent of chromosomes involved in radial structures after the indicated treatment. Number of metaphases (n, each represented by a dot) pooled from four independent experiments is indicated. Statistical analyses as in Fig. 1. All means are indicated with center bars and SDs with error bars.
Extended Data Fig. 6
Extended Data Fig. 6. Bypass of 53BP1/shieldin by artificial tethering of CST. Related to Fig. 4.
a, Immunoblots for BRCA1, 53BP1, and SHLD1 detecting FHA-SHLD1 in the indicated MEFs expressing FHA-R61Q-SHLD1 (RQ), corresponding to Fig. 4b. b, Immunoblots for BRCA1 and SHLD1 detecting FHA-SHLD1 in the indicated MEFs, corresponding to Fig. 4c. c, Quantification of 53BP1 and GFP-FHA-STN1 foci at DSBs in the indicated MEFs after IR (n = 3 independent experiments, except for the first two columns, where n = 2 independent experiments. d, Representative images of irradiated Brca1F/F Shld2−/− or Brca1F/F 53BP1−/− MEFs as in c. Nuclear outlines are demarcated by dashed white lines. e, Immunoblots for BRCA1, 53BP1, and STN1 detecting endogenous and FHA-STN1 in Brca1F/F Shld2−/− MEFs as in Fig. 4i. f, Representative images of DAPI-stained metaphase spreads from cells as in e, corresponding to Fig. 4i. All scale bars, 10 μm. All panels are representative of three independent experiments. All means are indicated with center bars and SDs with error bars.
Extended Data Fig. 7
Extended Data Fig. 7. Identification of a SHLD1 mutant with impaired CTC1 interaction. Related to Fig. 5.
a, Schematic of 53BP1 and its downstream effectors. Interactions (lines) based on previous reports,-. Black lines, interactions demonstrated by coimmunoprecipitation; purple lines, interactions demonstrated by yeast two-hybrid. Asterisk denotes the SHLD1-CTC1 interaction targeted for disruption in the random mutagenesis screen in b. b, Mutants identified in a yeast two-hybrid screen for loss of CTC1 binding executed with randomly mutagenized human SHLD1 ORFs. Left, candidate GAD-SHLD1-URA3 variants (red numbers) grow on permissive (-leucine, -tryptophan, -uracil) media. Expression of full-length SHLD1 variants is ensured by growth on media lacking uracil. Several controls are also shown (black numbers, e.g., c1a). Variants that fail to grow on selective (-leucine, -tryptophan, -uracil, -adenine) media are indicated with a green circle (or triangle for deletion). Five sequenced variants were attributable to a single mutation (green shape with magenta border). Mutation L20P, deletion of nearby A23, or the mutations A119V or Q127L severely diminished the SHLD1-CTC1 interaction. Right, sequence alignment of human and mouse SHLD1 with conserved residues highlighted in yellow. SHLD1 sequence variants are represented graphically by shapes above the sequence (see legend at bottom). The experiment has been performed once. c, Multiple sequence alignment of SHLD1. Conservation symbols are according to Uniprot: asterisks, fully conserved; colon, strong similarity; period, weak similarity. The orange outline highlights the conserved LDLP motif deleted in the SHLD1Δ mutant used in this study.
Extended Data Fig. 8
Extended Data Fig. 8. Characterization of SHLD1Δ. Related to Fig. 5.
a, Immunoblots showing expression of SNAP-SHLD1 or SNAP-SHLD1ΔLDLP (Δ) in U2OS cells. b, Quantification of SNAP-SHLD1 localization to IR-induced γH2AX foci in cells as in a. n = 45 nuclei pooled from three independent experiments. c, Immunoprecipitation of myc-SHLD2C (aa 421-904) and immunoblot for SNAP-SHLD1 co-expressed in 293T cells. d, Representative IF images showing γH2AX co-localizing with HA-STN1 in irrradiated BRCA1/SHLD1 DKO cells complemented with wt SHLD1 or SHLD1Δ. Nuclear outlines are demarcated by dashed white lines. Scale bars, 5 μm. Five sample foci are shown for each nucleus. e, Quantification of IR-induced γH2AX foci with HA-STN1 signal in the indicated cells. Red dotted line: the average background level across multiple conditions of random overlaps between γH2AX and HA foci (see Materials and Methods). f, Quantification of γH2AX foci in the indicated RPE1 cells with HA-STN1 as in d and e. Center bar indicates median. g, Quantification of RAD51 foci as in Fig. 5e in parental (wt), BRCA1 KO, or SHLD1 KO RPE1 cells. n = 3-7 independent experiments (as indicated by the number of data points). Ordinary one-way ANOVA was performed with Tukey’s correction for multiple comparisons in g. h, Quantification of the number of RAD51 foci per nucleus for cells as in Fig. 5e with the indicated FLAG-SHLD1 constructs. In e, f, and h, the number of nuclei (n, each represented by a dot) pooled from three independent experiments is indicated. i, Representative images of DAPI-stained metaphase spreads (top; orange arrows denote aberrant radial chromosomes) or RAD51 foci (bottom; nuclear outlines demarcated by dashed white lines) in BRCA1/SHLD1 DKO cells complemented with an empty vector control, wt SHLD1, or SHLD1Δ. Scale bars, 5 μm. a and c are representative of two independent experiments.. Statistical analyses as in Fig. 1. All means are indicated with center bars (unless otherwise noted) and SDs with error bars.
Extended Data Fig. 9
Extended Data Fig. 9. SHLD1Δ suppresses overhang length at TPP1-deficient telomeres. Related to Fig. 6.
a, Immunoblot showing expression of 53BP1 pathway components and SHLD1 construct expression in Tpp1F/F Shld1+/+ or Shld1−/− clones. b, Immunoblot showing bulk CRISPR KO of BRCA1 and SHLD1 construct expression in cells of the indicated genotype with SHLD1 construct expression. c, Quantitative analysis of telomeric ss overhang intensity in cells as in b using in-gel hybridization to detect the 3’ overhang followed by rehybridization to the denatured DNA in the same gel, allowing the ratio of ss to total TTAGGG signal to be determined. d, Immunoprecipitation of SHLD1 in Tpp1F/F MEFs with the indicated treatments and STN1 immunoblot. Experiments in a-d have been performed once.
Extended Data Fig. 10
Extended Data Fig. 10. SHLD1Δ suppresses overhang length at TRF2-deficient telomeres. Related to Fig. 6.
a, Immunoblot showing SHLD1 construct expression and TRF2 deletion by Cre in Trf2F/F Lig4−/− Shld1+/+ or Shld1−/− clones. Asterisks indicate non-specific bands. b, Quantitative analysis of telomeric ss overhang intensity in cells as in a. c, Quantification of overhangs from Trf2F/F Lig4−/− Shld1−/− cells (n = 3 independent experiments. a-c represent data from three independent experiments using two independent clones (circles and triangle). d, Immunoblot showing bulk CRISPR KO of BRCA1 (arrow), phosphorylation of CHK2 after TRF2 deletion, and SHLD1 construct expression. e, Telomeric overhang analysis on cells as in d. Statistical analysis was performed using two-tailed ratio-paired t-test. *, p<0.05; **, p<0.01; ns, not significant. Experiments in d, e have been performed once. f, Schematic of mouse IgA Switch region with several five nucleotide repeat sequences and their number of repeats in the region (4.4 kb). All means are indicated with center bars and SDs with error bars.
Fig. 1.
Fig. 1.. Primase promotes radials and blocks RAD51 loading in BRCA1-deficient cells.
a, Schematic of the timeline of auxin-induced degradation of PRIM1 in G2-arrested RPE1 cells treated with PARPi. b, Representative images of DAPI-stained metaphase spreads from RPE1 PRIM1-mAID-mClover cells with the indicated treatments. Green arrows: aberrant radial chromosomes. Scale bars: 5 μm. c, Immunoblot for BRCA1 and GFP (mClover-PRIM1) in cells as in a treated with control (sgLuc) or BRCA1 (sgBRCA1) bulk CRISPR KO. ctrl, non-specific band from GFP blot. d, Quantification of the percent of chromosomes involved in radial structures. Number of metaphases analyzed per condition (n) is indicated. e, Quantification of the percent of RAD51-positive cells (with 10 or more RAD51 foci per nucleus) 5 h after 5 Gy. n = four independent experiments. f, Representative images of IF for RAD51 in cells as in e with the indicated treatments. Scale bars: 20 μm. g, Immunoblot for BRCA2 and GFP (mClover-PRIM1) in cells as in a treated with control (sgLuc) or BRCA2 (sgBRCA2) bulk CRISPR KO. h, Quantification of the percent of chromosomes involved in radial structures (as in d). Number of metaphases analyzed per condition (n) is indicated. i, Quantification of the percent of RAD51-positive cells as in e, in the indicated cells. n = three independent experiments. Data shown in b-d, and f-i are representative of three independent experiments. All statistical analysis based on two-tailed Welch’s t-test. *, p<0.05; **, p<0.01; ***, p<0.001; ****, p<0.0001; ns, not significant. All means are indicated with center bars and SDs with error bars.
Fig. 2.
Fig. 2.. 53BP1/shieldin/CST/Polα/primase-dependent fill-in synthesis at FOKI-induced DSBs.
a, Schematic of the fill-in synthesis model. Shieldin recruits the CST complex and Polα/primase to counteract resection by copying the 3’ overhang. b, Representative IF of U2OS-FOKI-LacI cells with control (sgLuc) or SHLD2 (sgSHLD2) CRISPR knockout, in which a single DSB has been induced. Cells were arrested in G2 with RO-3306 (9 μM overnight). Scale bar, 5 μm. Representative of three independent experiments. c, Immunoblots showing bulk CRISPR-mediated disruption of the indicated 53BP1 pathway components. No validated antibody to SHLD2 is available. ctrl, non-specific band from REV7 blot. Representative of two independent experiments. d, Quantification of BrdU colocalization with FOKI-induced DSBs as in b and c, in cells treated with the indicated bulk CRISPR or Polα inhibitors, aphidicolin (Aphi) or CD437. n = three or four independent experiments as indicated. S phase cells, identified based on BrdU labeling pattern, were excluded (for sample image, see Extended Data Fig. 3b). e, Quantification of BrdU colocalization with FOKI-induced DSBs as in d to determine epistasis of REV7 knockout and Polα inhibition. f, Quantification of BrdU colocalization with FOKI-induced DSBs as in d upon inhibition of primase with vidarabine triphosphate. In e and f, n = three independent experiments. g, Representative IF of U2OS cells with FOKI-induced DSB in G2-arrested cells (9 μM RO-3306 overnight) or cells released from RO-3306 into G1 (2 h washout before induction of FOKI, see Extended Data Fig 3c). Scale bar, 5 μm. h, Quantification of BrdU colocalization with FOKI-induced DSBs as in g, with or without Polα inhibitor. n = three (CD437+) or four (CD437−) independent experiments. Statistical analyses as in Fig. 1. All means are indicated with center bars and SDs with error bars.
Fig. 3.
Fig. 3.. Detection of shieldin-dependent fill-in synthesis in BRCA1-deficient cells.
a, Representative image from metaPLA of BrdU/γH2AX on metaphase spreads in Brca1F/F MEFs treated as indicated. b, Example of a dicentric chromosome from a metaphase spread showing a PLA signal at a break. c, Quantification of BrdU/γH2AX metaPLA foci at chromatin breaks as in a from cells with the indicated genotypes and treatments. Number of metaphases analyzed per condition (n) and the average number of PLA foci at breaks per metaphase are indicated. d, Immunoblots for BRCA1 and GFP (mClover-PRIM1) in the indicated cells lines. a-d are representative of three independent experiments. e, Representative image from metaPLA of BrdU/γH2AX on metaphase spreads in RPE1 PRIM1-mAID-mClover cells treated with sgBRCA1, BrdU, and Olaparib. f, Quantification of BrdU/γH2AX metaPLA foci at chromatin breaks in cells as in d with the indicated genotypes and treatments. Data and representative image from three independent experiments. Number of metaphases analyzed per condition (n) and the average number of PLA foci at breaks per metaphase are indicated. Statistical analyses as in Fig. 1, except in c, where ordinary one-way ANOVA with Tukey’s multiple comparisons test was used. p values are as in Fig. 1. All means are indicated with center bars and SDs with error bars. All scale bars, 5 μm.
Fig. 4.
Fig. 4.. Bypass of 53BP1/shieldin by artificial tethering of CST.
a, Schematic of 53BP1/shieldin-independent recruitment of FHA-fusions to phosphorylated MDC1 at DSBs. b, Quantification of the percent of chromosomes involved in radial structures in the indicated cell lines with wt FHA-SHLD1 or FHA-SHLD1 with an FHA domain mutation (R61Q) which prohibits recruitment to DSBs. c, Quantification as in b in Brca1F/F 53bp1−/− cells with or without FHA-SHLD1 and Polα inhibitor. d, Representative image of irradiated Brca1−/− Shld2−/− cells harboring eGFP-FHA-STN1, which colocalizes with 53BP1 IR-induced foci. The nucleus is demarcated by the dashed white line. Representative of three independent experiments. Scale bar, 5 μm. e, Immunoblots for BRCA1, 53BP1, and (FHA-)STN1 in the indicated MEFs. Representative of two independent experiments. f, Quantification as in b in the indicated cell lines with or without FHA-STN1. g, Quantification of colony formation by MEFs of the indicated genotype with or without FHA-STN1 and treated with 1 μM Olaparib for 24 h. Survival after PARPi was compared to undrugged cells. Each dot represents one of three or four independent experiments. h, Quantification of the percent of RAD51-positive cells in irradiated MEFs of the indicated genotype with or without FHA-STN1. Each dot represents one of three or four independent experiments. i, Quantification of radial chromosome formation as in c in Brca1F/F Shld2−/− cells with or without FHA-STN1 and Polα inhibitor. In b ,c, f, and i, the number of metaphases (n, each represented by a dot) pooled from three independent experiments is indicated in the figure. Statistical analyses as in Fig. 1. All means are indicated with center bars and SDs with error bars.
Fig. 5.
Fig. 5.. Shieldin function in BRCA1-deficient cells depends on the SHLD1-CTC1 interaction.
a, Yeast-two hybrid assay demonstrating lack of interaction between human SHLD1L20P and CTC1 proteins. Colony growth on permissive (-leucine, -tryptophan, -uracil), but not selective (-leucine, -tryptophan, -uracil, -adenine) media indicates lack of interaction. b, Immunoblots in the indicated cells. SHLD1Δ (Δ) has a deletion of aa 18-21. ctrl, non-specific band from STN1 blot. a and b are representative of two independent experiments. c, Immunoprecipitation of FLAG-SHLD1 and immunoblot for myc-CTC1 co-expressed in 293T cells. Representative of four independent experiments. d, Quantification of IR-induced γH2AX foci with HA-STN1 signal in BRCA1/SHLD1 DKO cells as in b. Number of nuclei (n, each represented by a dot) pooled from three independent experiments is indicated. Red dotted line: the average background level due to randomly overlapping γH2AX and HA foci (see Materials and Methods). e, Quantification of the percent of RAD51-positive cells in irradiated BRCA1/SHLD1 DKO RPE1 cells complemented with the indicated FLAG-SHLD1 construct or an empty vector (vec). Each dot represents an independent experiment (n = four-seven experiments involving >60 cells each). f, Quantification of the percent of chromosomes in radial structures in cells as in e. Number of metaphase spreads (n, each represented by a dot) pooled from three independent experiments is indicated. g, Quantification of colony formation by BRCA1/SHLD1 DKO cells as in e treated with 5 μM Olaparib for 24 h. Survival after PARPi was compared to undrugged cells and normalized to empty vector. n = three independent experiments. h, Immunoblot for BRCA1, 53BP1, and SHLD1 detecting FHA-tagged SHLD1 in the indicated cells. Representative of three independent experiments. i, Quantification of the percent of chromosomes in radial structures in the indicated MEFs expressing FHA-SHLD1Δ (Δ). Empty vector (vec) and FHA-SHLD1 (wt) conditions from Fig. 4b are provided again here. Number of metaphase spreads (n, each represented by a dot) pooled from three independent experiments is indicated. j, Schematic of HaXS8-induced dimerization of SNAP-SHLD1Δ with HALO-CTC1. k, Quantification of RAD51-positive cells in irradiated BRCA1/SHLD1 DKO cells, complemented with the indicated SNAP-SHLD1 or empty vector, and HALO-CTC1 or empty vector, then treated with HaXS8 or vehicle prior to irradiation. n = three or four independent experiments as indicated. l, Quantification of the percent of chromosomes in radial structures in BRCA1/SHLD1 DKO cells with the indicated treatments. Number of metaphase spreads (n, each represented by a dot) pooled from three independent experiments is indicated. Statistical analyses as in Fig. 1. All means are indicated with center bars and SDs with error bars.
Fig. 6.
Fig. 6.. SHLD1Δ supports class switch recombination and suppresses long telomeric overhang formation.
a, Representative flow cytometry plots of IgM to IgA CSR in indicated parental Shld1+/+, Shld1−/− and transgene-complemented CH12-F3 cell line derivatives. Representative of three independent experiments. b, Quantification of CSR in cells as in a. CSR efficiency is normalized to wild-type cells. Statistical analysis (n = 3 independent experiments) performed using ordinary one-way ANOVA with Dunnett’s correction for multiple comparisons. All comparisons are made to Shld1−/ cells complemented with wt SHLD1. c, TwinStrep-HA-SHLD1 wt, L20P, ΔLDLP, or ΔN immunocomplexes were isolated from whole cell extracts prepared from untreated CH12-F3 cultures. Western blots were probed for the indicated targets. Data represent three independent experiments. d, Immunoblot showing CHK1 activation after Tpp1 deletion and SHLD1 construct expression in the indicated cells. Representative of two independent experiments. e, Quantitative analysis of telomeric ss overhang intensity in cells as in d using in-gel hybridization to detect the 3’ overhang followed by rehybridization to the denatured DNA in the same gel, allowing the ratio of ss to total TTAGGG signal to be determined. Representative of three independent experiments. f, Quantification of overhang intensity from cells as in e in n = two (Shld1+/+) or three (Shld1−/−) independent experiments using two independent clones for each genotype (represented by circle and square, diamond and hexagon symbols). Statistical analysis was performed using two-tailed ratio-paired t-test. *, p<0.05; **, p<0.01; ****, p<0.0001; ns, not significant. All means are indicated with center bars and SDs with error bars.

References

    1. Mirman Z & de Lange T 53BP1: a DSB escort. Genes Dev 34, 7–23 (2020). - PMC - PubMed
    1. Pannunzio NR, Watanabe G & Lieber MR Nonhomologous DNA end-joining for repair of DNA double-strand breaks. J Biol Chem 293, 10512–10523 (2018). - PMC - PubMed
    1. Wright WD, Shah SS & Heyer WD Homologous recombination and the repair of DNA double-strand breaks. J Biol Chem 293, 10524–10535 (2018). - PMC - PubMed
    1. Hustedt N & Durocher D The control of DNA repair by the cell cycle. Nat Cell Biol 19, 1–9 (2016). - PubMed
    1. Bhattacharyya A, Ear US, Koller BH, Weichselbaum RR & Bishop DK The breast cancer susceptibility gene BRCA1 is required for subnuclear assembly of Rad51 and survival following treatment with the DNA cross-linking agent cisplatin. J Biol Chem 275, 23899–23903 (2000). - PubMed

Publication types

MeSH terms