. 2022 Jan;24(1):74-87.
doi: 10.1038/s41556-021-00813-8. Epub 2022 Jan 13.

The Hippo pathway kinases LATS1 and LATS2 attenuate cellular responses to heavy metals through phosphorylating MTF1

Affiliations

The Hippo pathway kinases LATS1 and LATS2 attenuate cellular responses to heavy metals through phosphorylating MTF1

Han Han et al. Nat Cell Biol. 2022 Jan.

Abstract

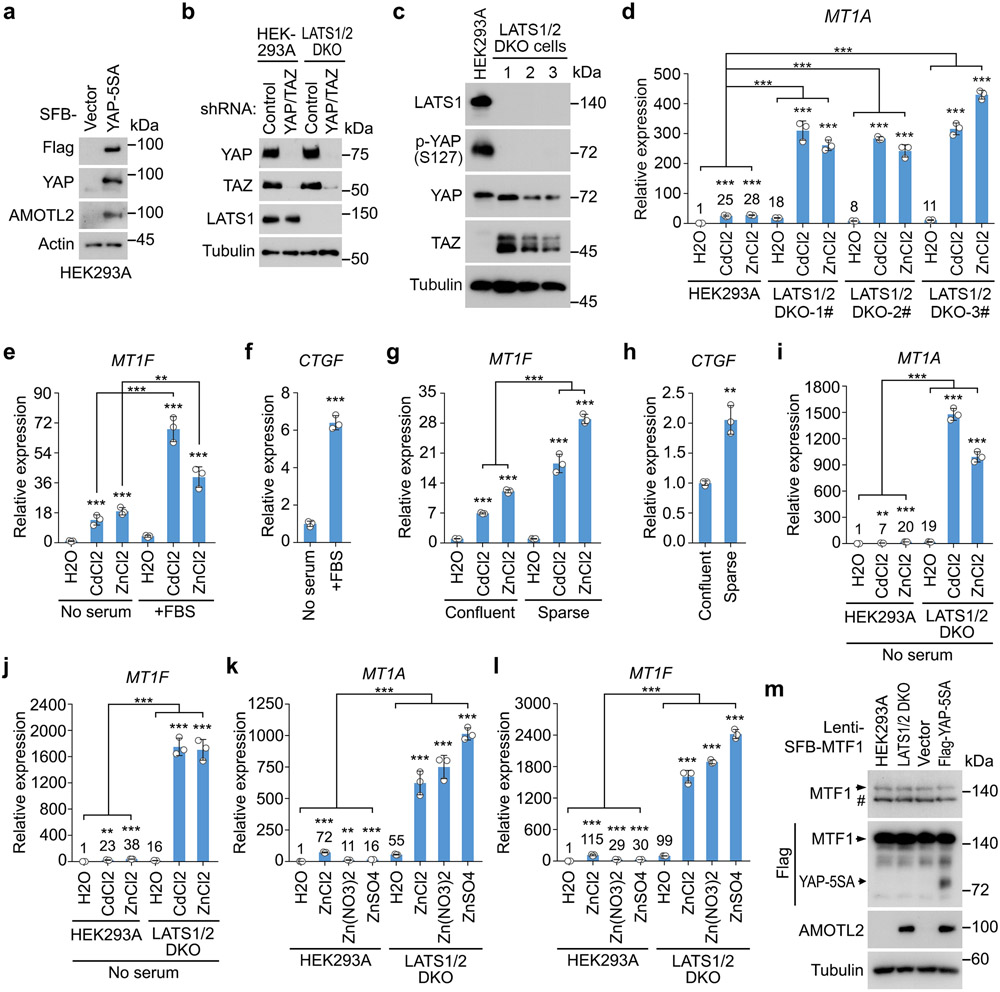
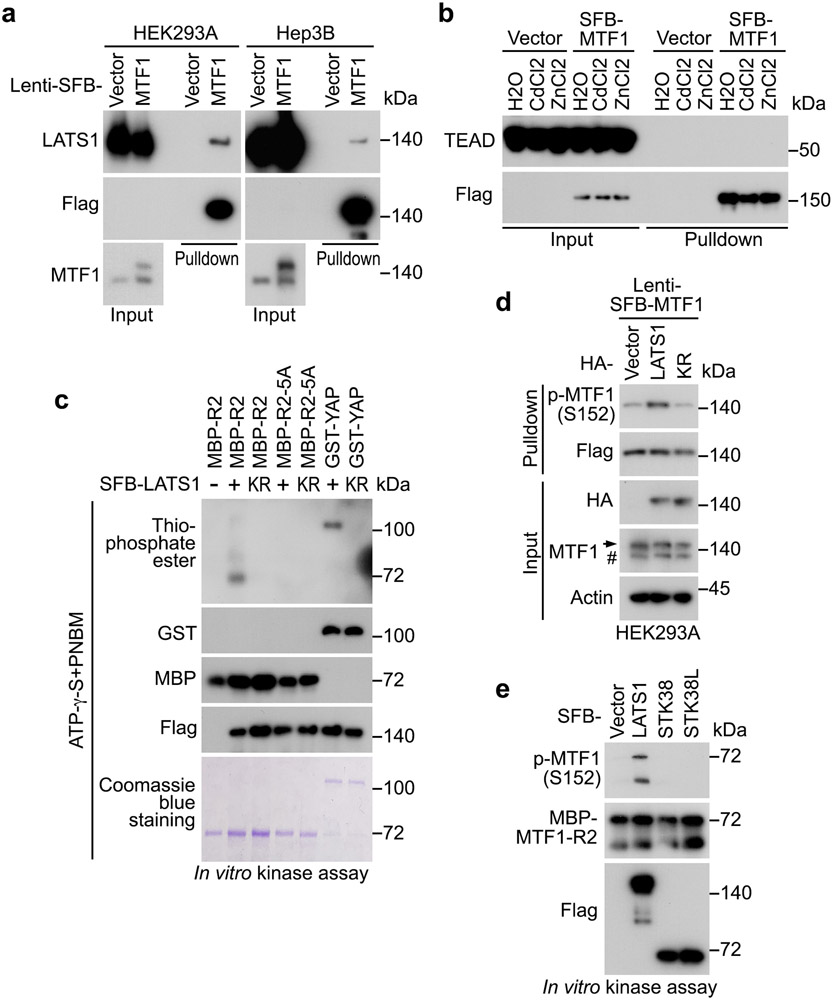
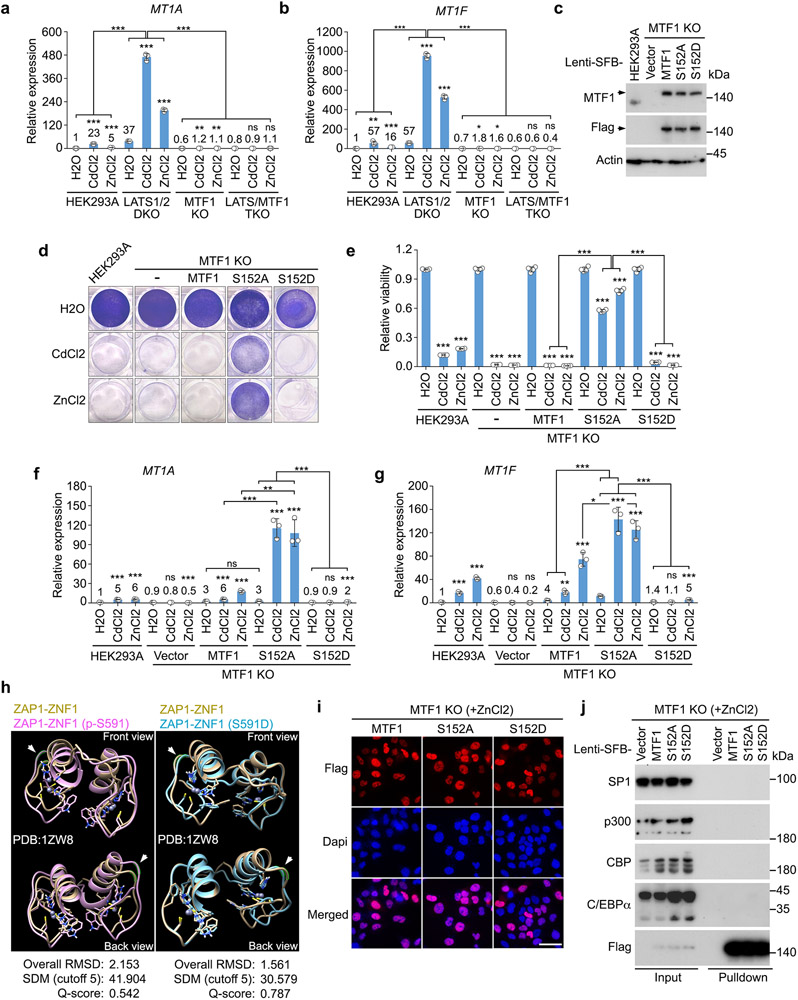
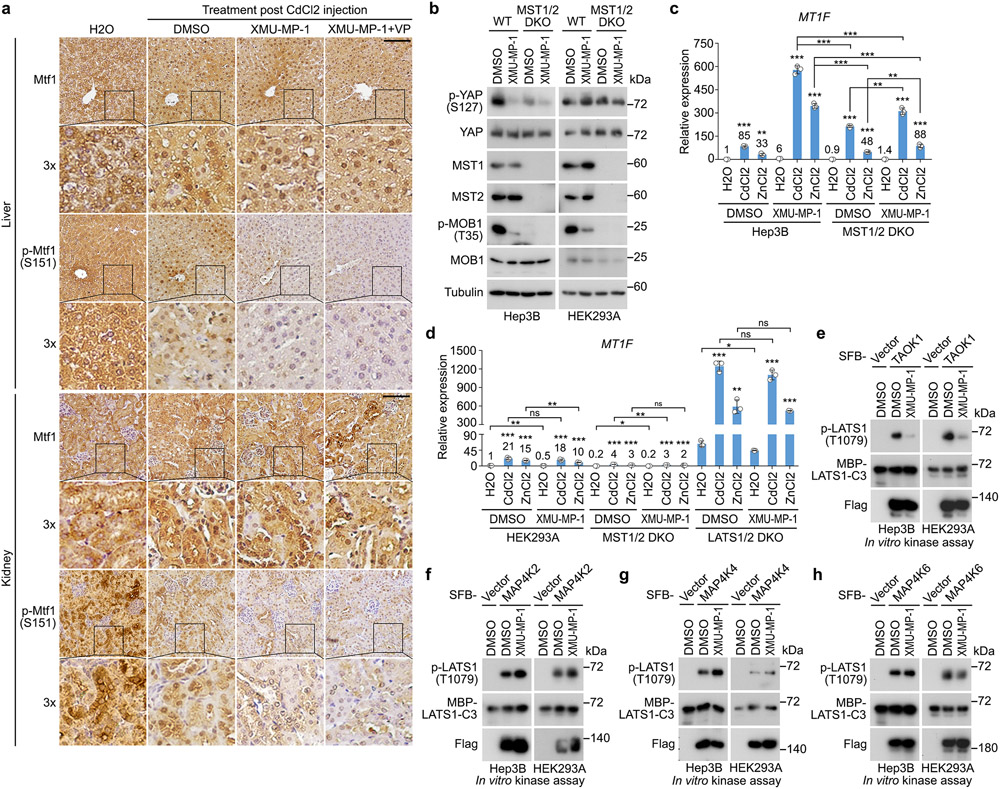
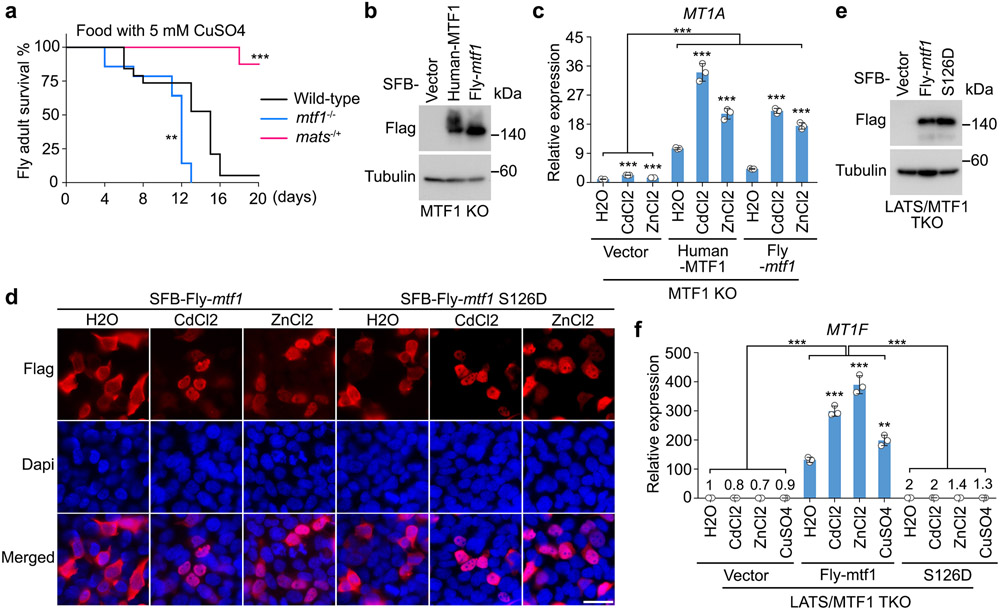
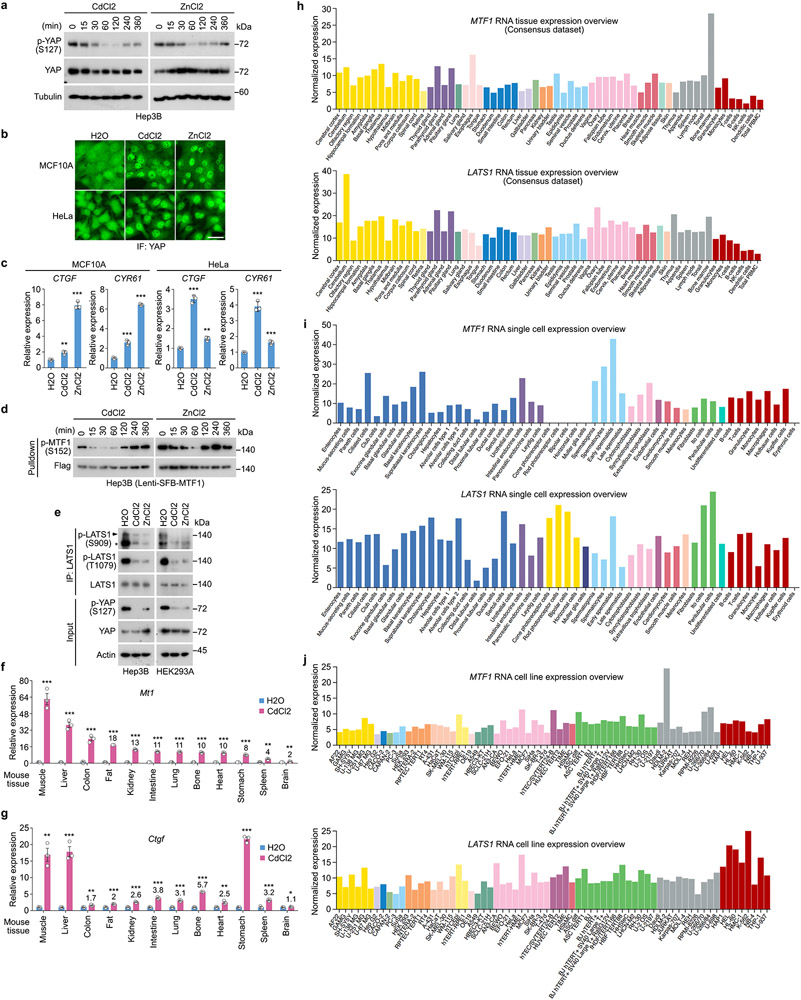
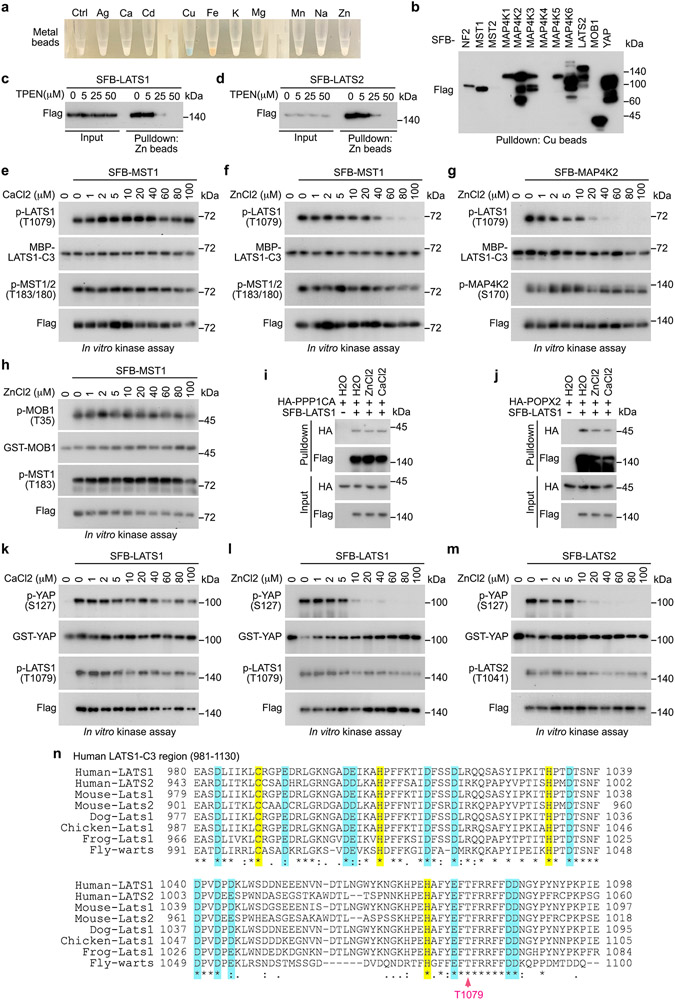
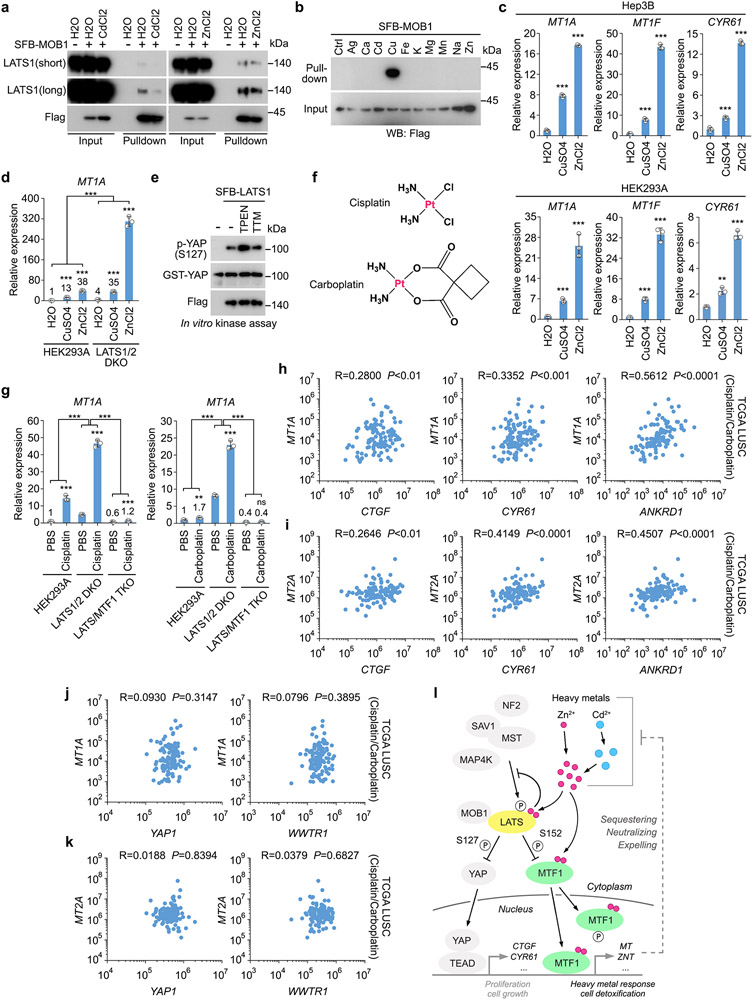
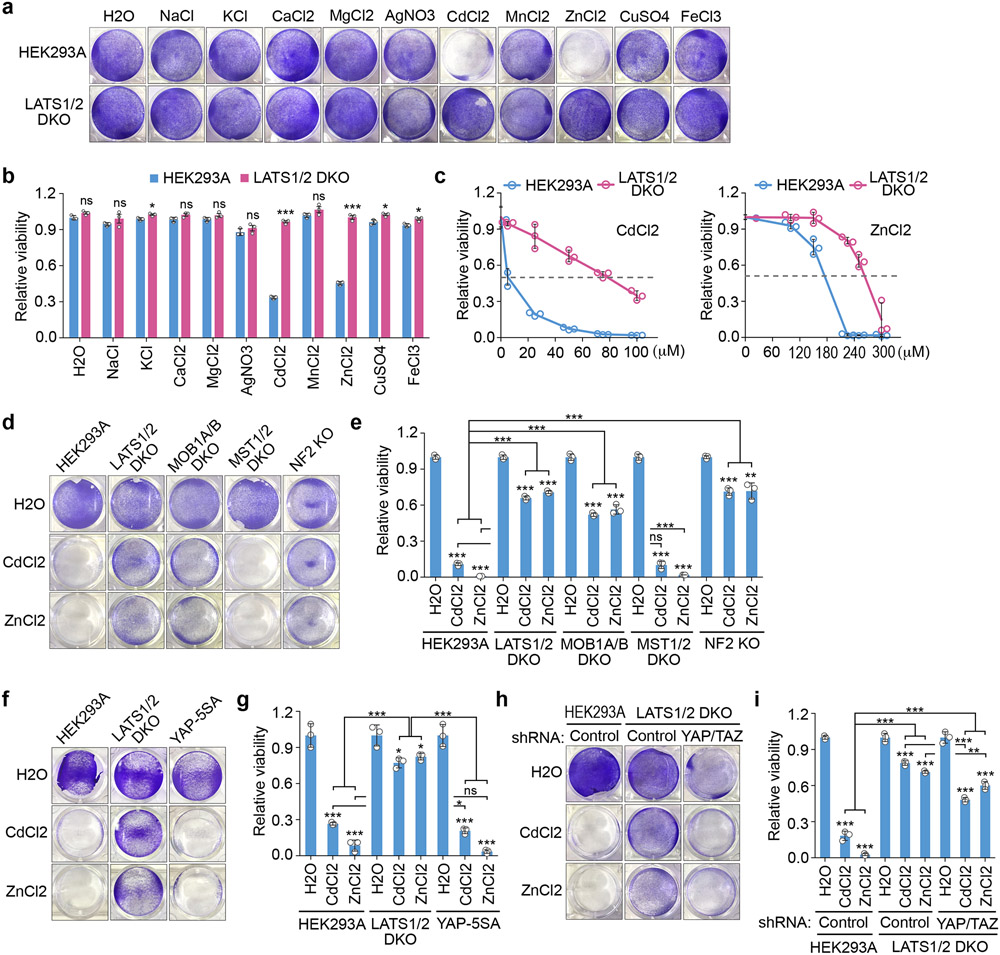
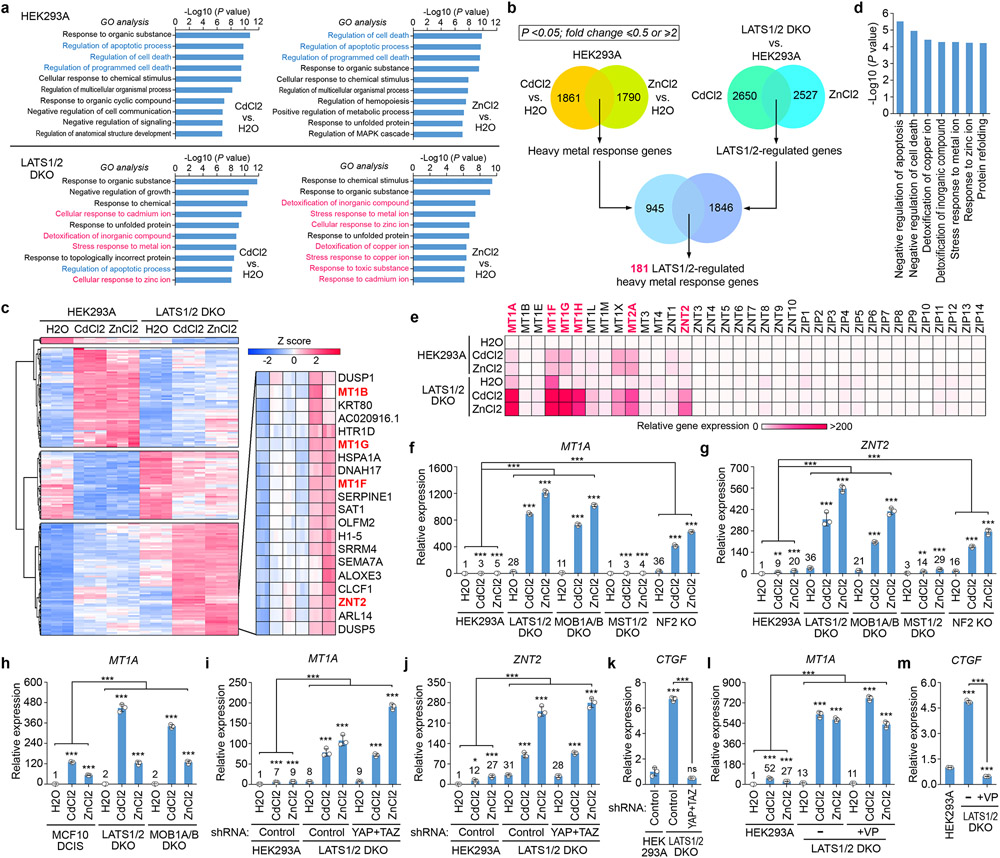
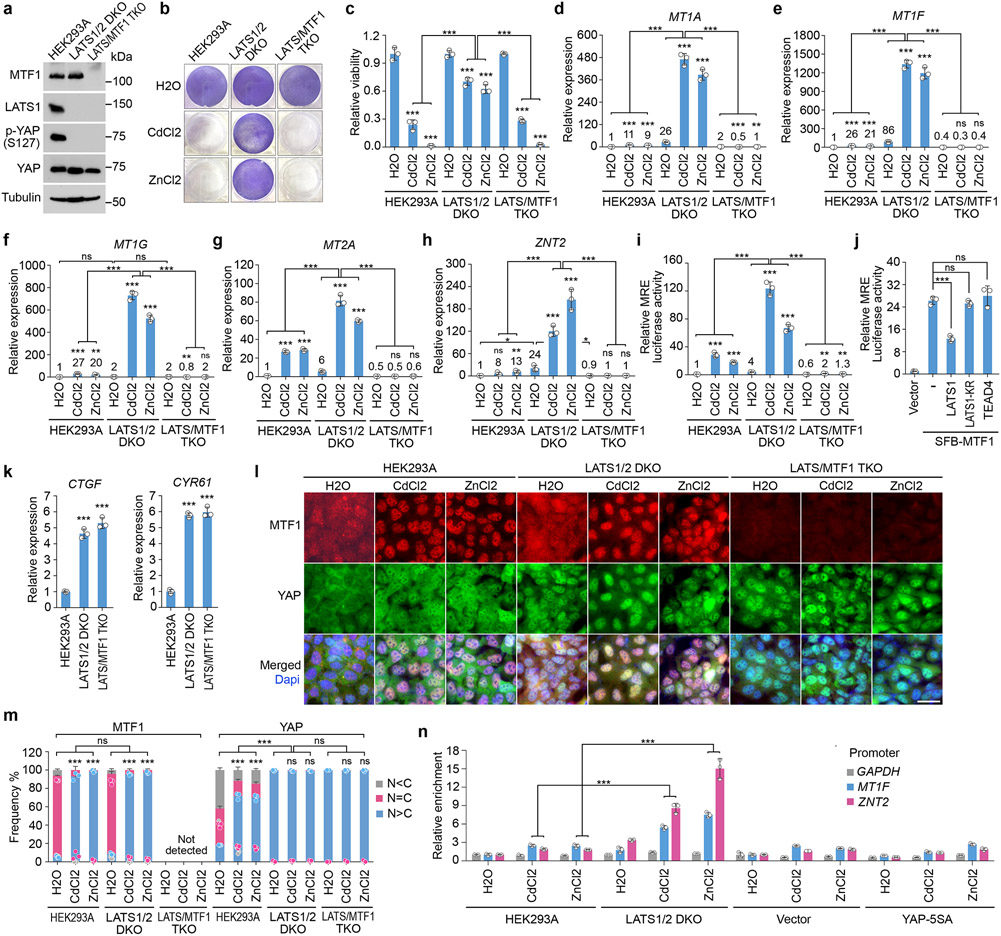
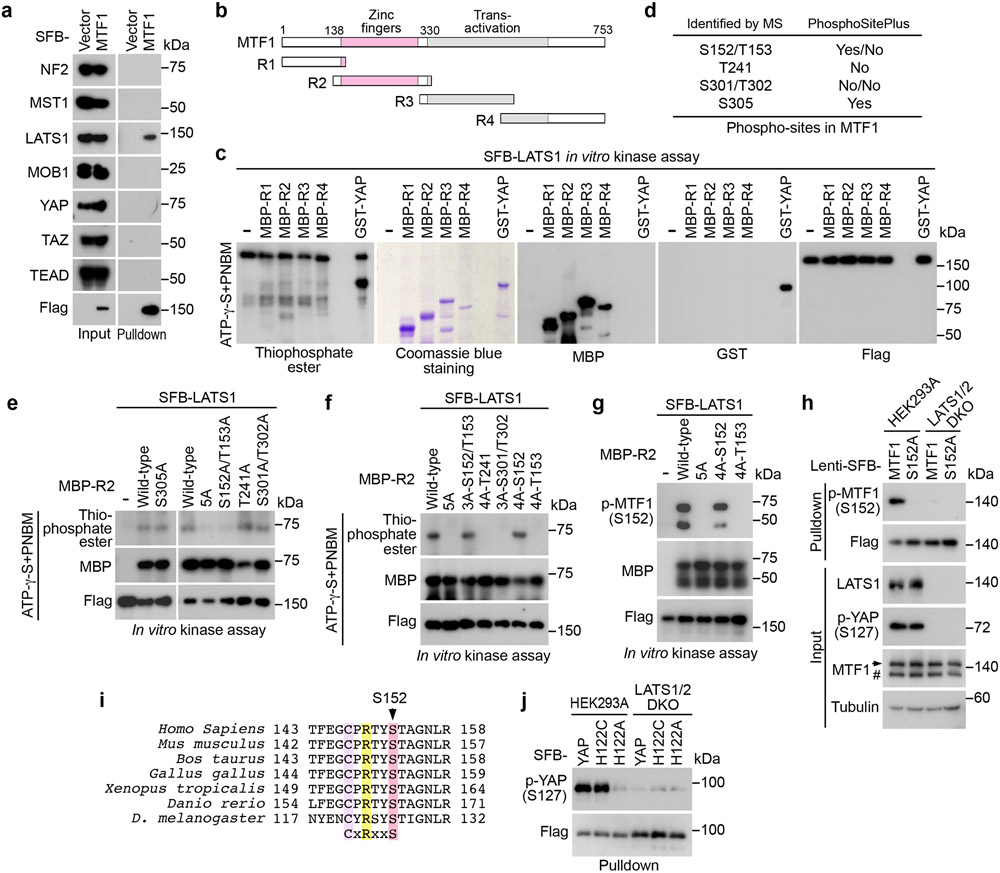
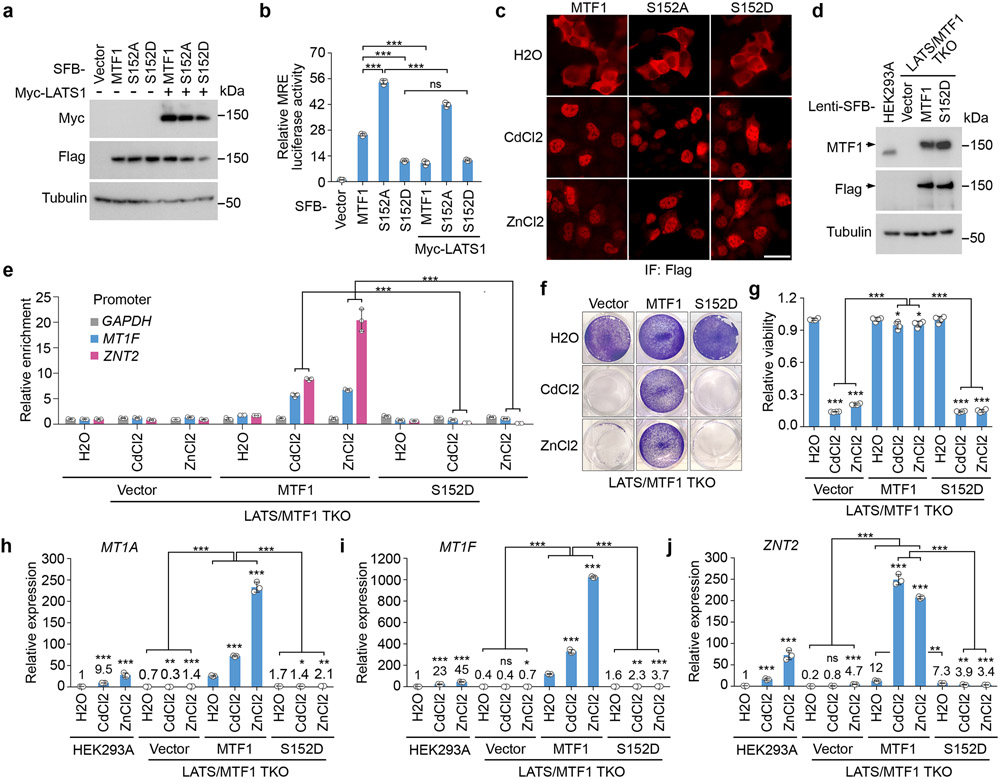
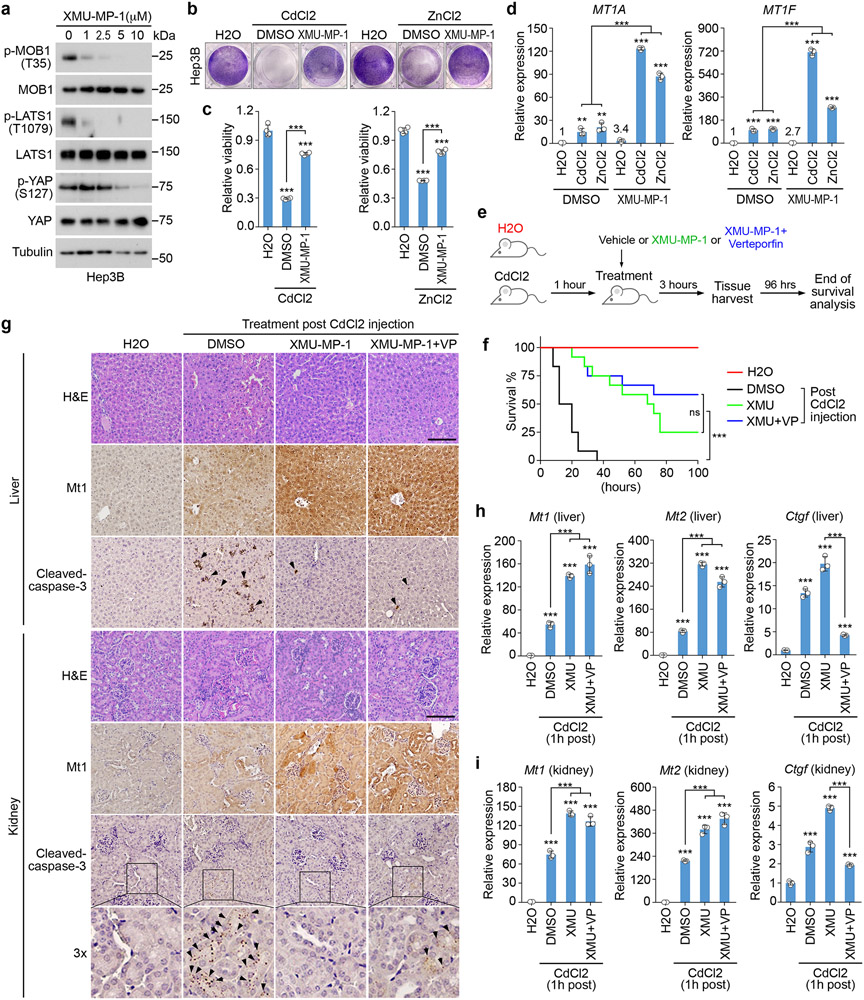
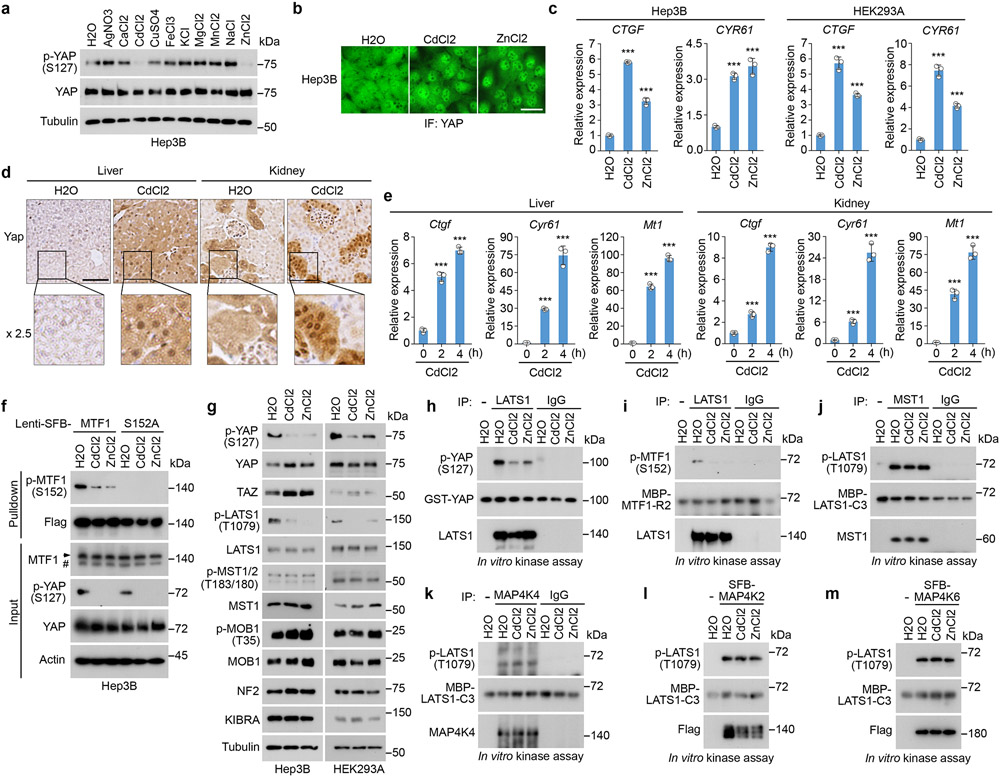
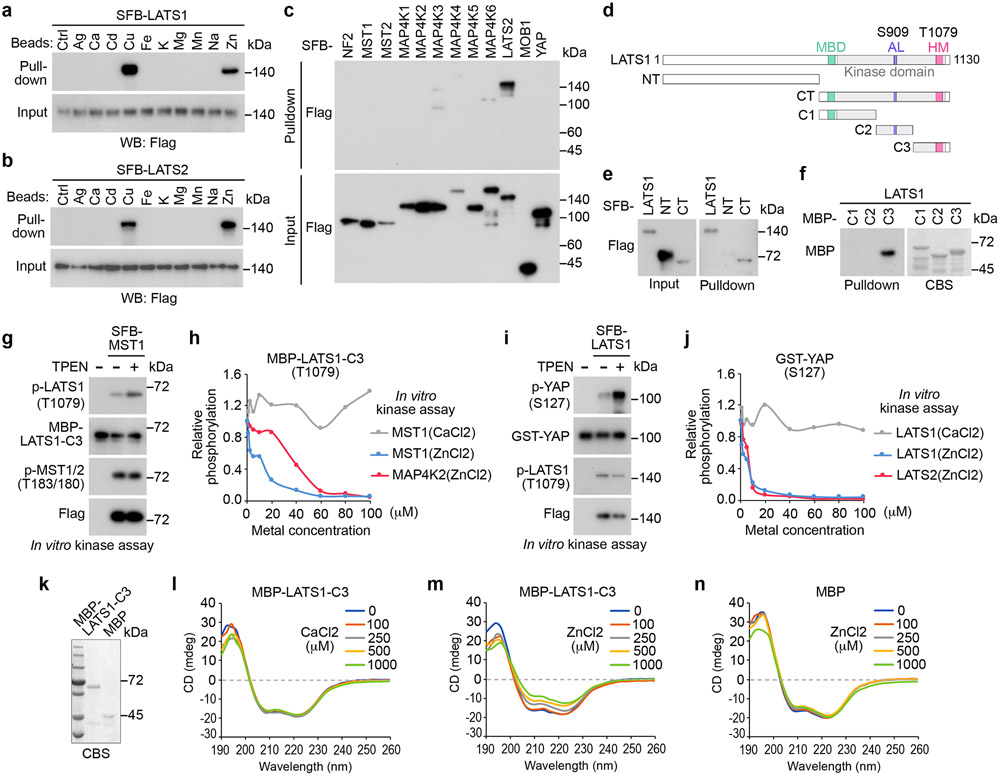
Heavy metals are both integral parts of cells and environmental toxicants, and their deregulation is associated with severe cellular dysfunction and various diseases. Here we show that the Hippo pathway plays a critical role in regulating heavy metal homeostasis. Hippo signalling deficiency promotes the transcription of heavy metal response genes and protects cells from heavy metal-induced toxicity, a process independent of its classic downstream effectors YAP and TAZ. Mechanistically, the Hippo pathway kinase LATS phosphorylates and inhibits MTF1, an essential transcription factor in the heavy metal response, resulting in the loss of heavy metal response gene transcription and cellular protection. Moreover, LATS activity is inhibited following heavy metal treatment, where accumulated zinc directly binds and inhibits LATS. Together, our study reveals an interplay between the Hippo pathway and heavy metals, providing insights into this growth-related pathway in tissue homeostasis and stress response.


Figures

Extended Data Fig. 1
Extended Data Fig. 1. Inhibition of the Hippo pathway activates heavy metal response.
(a) Validation of the YAP-5SA overexpressed HEK239A cells. Western blot was performed using the indicated antibodies. (b) Validation of the YAP/TAZ shRNAs-transduced LATS1/2 DKO HEK293A cells. Western blot was performed using the indicated antibodies. (c-d) Western blot was performed using the indicated antibodies (c). MT1A gene transcription was examined in the indicated cells treated with CdCl2 (50 μM) and ZnCl2 (250 μM) for 4 hours by q-PCR (mean ± s.d., n=3 biological replicates) (d). *** p < 0.001 (two-tailed Student’s t-test). Relative expression fold change numbers are shown. (e-f) Transcription of MT1F (e) and CTGF (f) was examined in the HEK293A cells cultured under serum starvation and serum stimulation by q-PCR (mean ± s.d., n=3 biological replicates). ** p < 0.01, *** p < 0.001 (two-tailed Student’s t-test). (g-h) Transcription of MT1F (g) and CTGF (h) was examined in the HEK293A cells cultured under high density and low density by q-PCR (mean ± s.d., n=3 biological replicates). ** p < 0.01, *** p < 0.001 (two-tailed Student’s t-test). (i-j) Serum-starved wild-type and the LATS1/2 DKO HEK293A cells were treated with CdCl2 (50 μM) and ZnCl2 (250 μM) for 4 hours. Transcription of MT1A (i) and MT1F (j) was examined by q-PCR (mean ± s.d., n=3 biological replicates). ** p < 0.01, *** p < 0.001 (two-tailed Student’s t-test). Relative expression fold change numbers are shown. (k-l) Wild-type and the LATS1/2 DKO HEK293A cells were treated with 250 μM Zn with the indicated anions for 4 hours. The transcription of MT1A (i) and MT1F (j) was examined by q-PCR (mean ± s.d., n=3 biological replicates). ** p < 0.01, *** p < 0.001 (two-tailed Student’s t-test). (m) Validation of the indicated HEK293A cells stably expressing SFB-MTF1. Western blot was performed using the indicated antibodies. Data shown represent 2 independent experiments in a-c, m.
Extended Data Fig. 2
Extended Data Fig. 2. LATS1 binds and phosphorylates MTF1.
(a) HEK293A and Hep3B cells stably expressing SFB-tagged MTF1 were subjected to pulldown assay using S protein beads. Western blot was performed using the indicated antibodies. (b) HEK293A cells were transfected with the construct encoding SFB-tagged MTF1, treated with CdCl2 (50 μM) and ZnCl2 (250 μM) for 1 hour, and subjected to pulldown assay using S protein beads. Western blot was performed using the indicated antibodies. (c) SFB-tagged LATS1 and its kinase dead (K734R) mutant were expressed in HEK293T cells, purified using S protein beads, and subjected to the ATP-γ-S-based in vitro kinase assay. Bacterially purified MBP-MTF1-R2, MBP-R2-5A mutant (S152A/T153A/T241A/S301A/T302A) and GST-YAP proteins were used as substrates. Western blot was performed using the indicated antibodies. (d) HEK293A cells stably expressing SFB-tagged MTF1 were transfected with the constructs encoding HA-tagged LATS1 and its kinase dead (K734R) mutant, and subjected to pulldown assay using S protein beads. Western blot was performed using the indicated antibodies. Arrow indicates the exogenously expressed SFB-MTF1. Pound sign indicates endogenous MTF1. (e) SFB-tagged LATS1, STK38 and STK38L were expressed in HEK293T cells, purified using S protein beads, and subjected to in vitro kinase assay. Bacterially purified MBP-tagged MTF1-R2 protein was used as substrate. Western blot was performed using the indicated antibodies. Data shown represent 2 independent experiments in a-e.
Extended Data Fig. 3
Extended Data Fig. 3. MTF1 S152 phosphorylation inhibits heavy metal response.
(a-b) The indicated HEK293A cells were treated with CdCl2 (50 μM) and ZnCl2 (250 μM) for 4 hours. The transcription of MT1A (a) and MT1F (b) was examined by q-PCR (mean ± s.d., n=3 biological replicates). * p < 0.05, ** p < 0.01, *** p < 0.001 (two-tailed Student’s t-test). ns, no significance. Relative expression fold change numbers are shown. (c) Validation of the MTF1 KO HEK293A cells reconstituted with the indicated SFB-tagged MTF1 and its mutants. Western blot was performed using the indicated antibodies. Arrow indicates the exogenously expressed SFB-tagged MTF1 and its mutants. (d-e) The MTF1KO HEK293A cells were reconstituted with the indicated SFB-tagged MTF1 and its mutants, treated with CdCl2 (50 μM) and ZnCl2 (250 μM) for 12 hours, visualized by crystal violet staining (d), and quantified for relative viability (mean ± s.d., n=4 biological replicates) (e). *** p < 0.001 (two-tailed Student’s t-test). (f-g) The transcription of MT1A (f) and MT1F (g) was examined in wild-type and the MTF1 KO HEK293A cells reconstituted with the indicated SFB-tagged MTF1 and its mutants by q-PCR (mean ± s.d., n=3 biological replicates). Cells were treated with CdCl2 (50 μM) and ZnCl2 (250 μM) for 4 hours. * p < 0.05, ** p < 0.01, *** p < 0.001 (two-tailed Student’s t-test). ns, no significance. (h) The structure comparison of the ZAP1-ZNF1 in khaki with the phosphorylated ZAP1-ZNF1 (p-S591) in pink (left) and with ZAP1-ZNF1 S591D mutant in blue (right). The overall RMSD values of wild-type ZAP1-ZNF1 with its phosphorylated form (p-S591) and S591D mutant are shown. Arrows indicate the S591 site. (i) The MTF1 KO HEK293A cells were reconstituted with the indicated SFB-MTF1 and its mutants, and treated with ZnCl2 (250 μM) for 1 hour. Immunofluorescent staining was performed. Scale bar, 40 μm. Data shown represent 3 independent experiments. (j) The MTF1 KO HEK293A cells were reconstituted with the indicated SFB-MTF1 and its mutants, treated with ZnCl2 (250 μM) for 1 hour, and subjected to pulldown assay using S protein beads. Western blot was performed using the indicated antibodies. Data shown represent 2 independent experiments in c, j.
Extended Data Fig. 4
Extended Data Fig. 4. Characterization of XMU-MP-1 in regulating the Hippo pathway and heavy metal response.
(a) Immunohistochemical analyses of Mtf1 and its S151 phosphorylation were performed in the liver and kidney tissues of the mice treated with DMSO, XMU-MP-1 alone or combined with VP post CdCl2 intoxication. The indicated regions in the box are shown 3 times enlarged. Scale bar, 150 μM. Data shown represent 3 independent experiments. (b) Wild-type and the MST1/2 DKO Hep3B and HEK293A cells were treated with DMSO and XMU-MP-1 (10 μM) for 4 hours, and subjected to Western blot analysis using the indicated antibodies. (c-d) The indicated Hep3B cells (c) and HEK293A cells (d) were pre-incubated with XMU-MP-1 (10 μM) for 2 hours, and treated with CdCl2 (50 μM) and ZnCl2 (250 μM) for 4 hours. The transcription of MT1F was examined by q-PCR (mean ± s.d., n=3 biological replicates). * p < 0.05, ** p < 0.01, *** p < 0.001 (two-tailed Student’s t-test). ns, no significance. (e-h) Hep3B and HEK293A cells stably expressing SFB-tagged TAOK1 (e), MAP4K2 (f), MAP4K4 (g) and MAP4K6 (h) were serum starved for 24 hours, and treated with XMU-MP-1 (10 μM) for 4 hours. The indicated SFB-tagged kinases were purified using S protein beads and subjected to in vitro kinase assay using the bacterially purified MBP-tagged LATS1-C3 protein as substrate. Western blot was performed using the indicated antibodies Data shown represent 2 independent experiments in b, e-h.
Extended Data Fig. 5
Extended Data Fig. 5. The Hippo pathway-mediated regulation of MTF1 and heavy metal response is conserved in Drosophila.
(a) Heterozygous mats Drosophila mutant and homozygous mtf1 Drosophila mutant were used for adult viability assay. Adult viability was assayed by feeding adult Drosophila (~7-day old) with normal food supplemented with 5 mM CuSO4 and determining the number of survivors daily. **, p < 0.01; ***, p < 0.001 (Log-rank test). n = 19 for wild-type Drosophila, n = 14 for mtf−/− Drosophila, n = 24 for mats−/− Drosophila. (b) The MTF1 KO HEK293A cells were transfected with the constructs encoding the SFB-tagged human MTF1 and fly-mtf1. Western blot was performed using the indicated antibodies. (c) The MTF1 KO HEK293A cells were transfected with the constructs encoding the SFB-tagged human MTF1 and fly-mtf1, and treated with CdCl2 (50 μM) and ZnCl2 (250 μM) for 4 hours. MT1A gene transcription was examined by q-PCR (mean ± s.d., n=3 biological replicates). *** p < 0.001 (two-tailed Student’s t-test). (d) HEK293A cells were transfected with the constructs encoding the SFB-tagged fly-mtf1 and its S126D mutant, treated with CdCl2 (50 μM) and ZnCl2 (250 μM) for 1 hour, and subjected to immunofluorescent staining. Scale bar, 40 μm. (e) The LATS/MTF1 TKO HEK293A cells were transduced with the constructs encoding the SFB-tagged fly-mtf1 and its S126D mutant. Western blot was performed using the indicated antibodies. (f) The LATS/MTF1 TKO HEK293A cells stably expressing the SFB-tagged fly-mtf1 and its S126D mutant were treated with CdCl2 (50 μM), ZnCl2 (250 μM) and CuSO4 (250 μM) for 4 hours. MT1F gene transcription was examined by q-PCR (mean ± s.d., n=3 biological replicates). ** p < 0.01, *** p < 0.001 (two-tailed Student’s t-test). Data shown represent 2 independent experiments in b, d, e.
Extended Data Fig. 6
Extended Data Fig. 6. Heavy metals inhibit the Hippo pathway in different cells and tissues.
(a) Hep3B cells were serum starved for 24 hours, and treated with CdCl2 (50 μM) and ZnCl2 (250 μM) for the indicated time points. Western blot was performed using the indicated antibodies. (b) MCF10A and HeLa cells were serum starved for 24 hours, treated with CdCl2 (50 μM) and ZnCl2 (250 μM) for 1 hour, and subjected to immunofluorescent staining. Scale bar, 40 μm. (c) MCF10A and HeLa cells were serum starved for 24 hours, and treated with CdCl2 (50 μM) and ZnCl2 (250 μM) for 4 hours. The transcription of YAP downstream genes CTGF and CYR61 was examined by q-PCR (mean ± s.d., n = 3 biological replicates). ** p < 0.01, *** p < 0.001 (two-tailed Student’s t-test). (d) Hep3B cells stably expressing SFB-tagged MTF1 were serum starved for 24 hours, treated with CdCl2 (50 μM) and ZnCl2 (250 μM) for the indicated time points, and subjected to pulldown assay using S protein beads. Western blot was performed using the indicated antibodies. (e) Hep3B and HEK293A cells were serum starved for 24 hours, treated with CdCl2 (50 μM) and ZnCl2 (250 μM) for 1 hour, and subjected to immunoprecipitation using LATS1 antibody. Western blot was performed using the indicated antibodies. Arrow indicates the correct p-LATS1 S909 signal. Asterisk indicates the non-specific signal. (f) The transcription of heavy metal response gene Mt1 was examined by q-PCR (mean ± s.d., n = 3 biological replicates). ** p < 0.01, *** p < 0.001 (two-tailed Student’s t-test). Relative expression fold change numbers are shown. (g) The transcription of Yap downstream gene Ctgf was examined by q-PCR (mean ± s.d., n = 3 biological replicates). * p < 0.05, ** p < 0.01, *** p < 0.001 (two-tailed Student’s t-test). Relative expression fold change numbers are shown. (h-j) The Human Protein Atlas (https://www.proteinatlas.org/) was used to examine the expression of MTF1 and LATS1 in different human tissues (h), human cells (i) and commonly used human cell lines (j). Data shown represent 2 independent experiments in a, b, d, e.
Extended Data Fig. 7
Extended Data Fig. 7. Zn binds and inhibits LATS.
(a) Illustration of the metal beads. (b) HEK293T cells were transfected with the constructs encoding the indicated Hippo pathway components and subjected to pulldown assay using Cu beads. The input blot is shared with the one in Fig. 8c. (c-d) HEK293T cells were transfected with the constructs encoding SFB-tagged LATS1 (c) and LATS2 (d), and subjected to pulldown assay using Zn beads in the presence of TPEN at the indicated concentrations. (e-f) SFB-tagged MST1 was expressed in HEK293T cells, purified using S protein beads, and subjected to in vitro kinase assay in the presence of CaCl2 (e) and ZnCl2 (f) at the indicated concentrations. MBP-tagged LATS1-C3 protein was used as substrate. (g) SFB-tagged MAP4K2 was expressed in HEK293T cells, purified using S protein beads, and subjected to in vitro kinase assay in the presence of ZnCl2 at the indicated concentrations. MBP-tagged LATS1-C3 protein was used as substrate. (h) SFB-tagged MST1 was expressed in HEK293T cells, purified using S protein beads, and subjected to in vitro kinase assay in the presence of ZnCl2 at the indicated concentrations. GST-tagged MOB1 protein was used as substrate. (i-j) HEK293A cells were transfected with the constructs encoding the SFB-tagged LATS1 with HA-tagged PPP1CA (i) and POPX2 (j), treated with ZnCl2 (250 μM) and CaCl2 (250 μM) for 1 hour, and subjected to pulldown assay using S protein beads. (k-l) SFB-tagged LATS1 was expressed in HEK293T cells, purified using S protein beads, and subjected to in vitro kinase assay in the presence of CaCl2 (k) or ZnCl2 (l) at the indicated concentrations. GST-tagged YAP protein was used as substrate. (m) SFB-tagged LATS2 was expressed in HEK293T cells, purified using S protein beads, and subjected to in vitro kinase assay in the presence of ZnCl2 at the indicated concentrations. GST-tagged YAP protein was used as substrate. (n) The potential Zn-binding Cys, His, Glu and Asp residues in the LATS1-C3 region are shown. The conserved Cys and His residues are highlighted in yellow. The conserved Glu and Asp residues are highlighted in blue. LATS1 T1079 site is indicated by arrow. Data shown represent 2 independent experiments in b-m.
Extended Data Fig. 8
Extended Data Fig. 8. The Hippo pathway mediates cellular response to different heavy metals.
(a) HEK293A cells were transfected with the construct encoding SFB-tagged MOB1, treated with CdCl2 (50 μM) and ZnCl2 (250 μM) for 1 hour, and subjected to pulldown assay using S protein beads. Western blot was performed using the indicated antibodies. short, short exposure; long, long exposure. (b) HEK293T cells were transfected with the construct encoding SFB-tagged MOB1 and subjected to pulldown assay using the indicated metal beads. (c) Hep3B and HEK293A cells were serum starved for 24 hours and treated with CuSO4 (250 μM) and ZnCl2 (250 μM) for 4 hours. The transcription of MT1A, MT1F and CYR61 was examined by q-PCR (mean ± s.d., n = 3 biological replicates). ** p < 0.01, *** p < 0.001 (two-tailed Student’s t-test). (d) The indicated cells were treated with CuSO4 (250 μM) and ZnCl2 (250μM) for 4 hours. The transcription of MT1A was examined by q-PCR (mean ± s.d., n=3 biological replicates). *** p < 0.001 (two-tailed Student’s t-test). (e) SFB-tagged LATS1 was expressed in HEK293T cells, purified using S protein beads, washed thoroughly with high-salt buffer containing 250 mM NaCl, incubated with Zn chelator TPEN (25 μM) or Cu chelator TTM (25 μM), and subjected to in vitro kinase assay. GST-YAP protein used as substrate. (f) Illustration of cisplatin and carboplatin compound structures, where platinum is labeled in red. (g) The indicated cells were treated with cisplatin (10 μM) and carboplatin (100 μM) for 6 hours. The transcription of MT1A was examined by q-PCR (mean ± s.d., n=3 biological replicates). ** p < 0.05, *** p < 0.001 (two-tailed Student’s t-test). ns, no significance. Relative expression fold change numbers are shown. (h-k) The lung squamous cell carcinoma (LUSC) RNAseq datasets with clinic data were downloaded from the Cancer Genome Atlas (TCGA) data portal. The indicated gene expression from a total of 119 patients treated with cisplatin or carboplatin were subjected to Spearman correction analysis. Correlation coefficient R value and p value were calculated by GraphPad prism software. (l) A proposed model for the Hippo pathway-mediated heavy metal response through MTF1. Data shown represent 2 independent experiments in a, b, e.
Fig. 1:
Fig. 1:. Hippo signaling deficiency protects cells against heavy metal-induced toxicity.
(a-b) Wild-type and the LATS1/2 double knockout (DKO) HEK293A cells were treated with the indicated metals at concentration of 250 μM except CdCl2 (50 μM) and AgNO3 (50 μM) for 12 hours, visualized by crystal violet staining (a) and quantified for relative viability (mean ± s.d., n=3 biological replicates) (b). * p < 0.05, *** p < 0.001 (two-tailed Student’s t-test). ns, no significance. (c) Wild-type and the LATS1/2 DKO HEK293A cells were treated with the indicated concentration of CdCl2 and ZnCl2 for 12 hours, visualized by crystal violet staining, and quantified for relative viability (mean ± s.d., n=3 biological replicates). (d-e) The indicated Hippo pathway component knockout cells were treated with CdCl2 (50 μM) and ZnCl2 (250 μM) for 12 hours, visualized by crystal violet staining (d), and quantified for relative viability (mean ± s.d., n=3 biological replicates) (e). ** p < 0.01, *** p < 0.001 (two-tailed Student’s t-test). ns, no significance. (f-g) The indicated cells were treated with CdCl2 (50 μM) and ZnCl2 (250 μM) for 12 hours, visualized by crystal violet staining (f), and quantified for relative viability (mean ± s.d., n=3 biological replicates) (g). * p < 0.05, *** p < 0.001 (two-tailed Student’s t-test). ns, no significance. (h-i) The indicated cells were treated with CdCl2 (50 μM) and ZnCl2 (250 μM) for 12 hours, visualized by crystal violet staining (h), and quantified for relative viability (mean ± s.d., n=3 biological replicates) (i). ** p < 0.01, *** p < 0.001 (two-tailed Student’s t-test). ns, no significance.
Fig. 2:
Fig. 2:. Hippo signaling deficiency induces heavy metal response gene expression.
(a) Genes with their expression at least two folds significantly changed upon Cd/Zn treatment were subjected to GO analysis. P values were generated by Gene Ontology Resources (http://geneontology.org/). No statistical test was used. RNAseq was performed in 3 biological replicates and data shown represent an average from these replicates. (b) Comparative RNAseq analysis reveals a total of 181 genes that are regulated by both Cd/Zn and LATS1/2. Gene number for each dataset was shown. (c) Hierarchical clustering analysis of the 181 genes that are regulated by both Cd/Zn and LATS1/2. Among them, metallothioneins (MTs) genes and ZNT2 were highlighted in red. (d) GO analysis of the MTs and ZNT2-containing gene set in (c). (e) q-PCR screen of the metallothionein (MT), ZNT (SLC30A) and ZIP (SLC39A) family genes in wild-type and the LATS1/2 DKO HEK293A cells under the treatment with H2O, CdCl2 (50 μM) and ZnCl2 (250 μM) for 4 hours. Relative gene expression was shown as the heatmap. (f-h) The transcription of heavy metal response genes MT1A (f) and ZNT2 (g) was examined in the indicated HEK293A cells by q-PCR (mean ± s.d., n=3 biological replicates). MT1A gene expression was examined in the indicated MCF10 DCIS cells by q-PCR (mean ± s.d., n=3 biological replicates) (h). Cells were treated with H2O, CdCl2 (50 μM) and ZnCl2 (250 μM) for 4 hours. ** p < 0.01, *** p < 0.001 (two-tailed Student’s t-test). (i-k) The transcription of MT1A (i), ZNT2 (j) and CTGF (k) was examined in the indicated cells by q-PCR (mean ± s.d., n=3 biological replicates). Cells were treated with H2O, CdCl2 (50 μM) and ZnCl2 (250 μM) for 4 hours. * p < 0.05, *** p < 0.001 (two-tailed Student’s t-test). ns, no significance. (l-m) The transcription of MT1A (l) and CTGF (m) was examined in the VP-treated LATS1/2 DKO HEK293A cells by q-PCR (mean ± s.d., n=3 biological replicates). The indicated cells were treated with VP (10 mM) for 12 hours and subjected to the treatment with H2O, CdCl2 (50 μM) and ZnCl2 (250 μM) for 4 hours. *** p < 0.001 (two-tailed Student’s t-test).
Fig. 3:
Fig. 3:. The Hippo pathway controls heavy metal response by inhibiting MTF1’s transcriptional activity.
(a) Western blot was performed using the indicated antibodies. Data shown represent 2 independent experiments. (b-h) The indicated cells were treated with CdCl2 (50 μM) and ZnCl2 (250 μM) for 12 hours, visualized by crystal violet staining (b), and quantified for relative viability (mean ± s.d., n=3 biological replicates) (c). The transcription of MT1A (d), MT1F (e), MT1G (f), MT2A (g) and ZNT2 (h) was examined by q-PCR (mean ± s.d., n=3 biological replicates). * p < 0.05, ** p < 0.01, *** p < 0.001 (two-tailed Student’s t-test). ns, no significance. (i) MRE luciferase reporter assay was performed using the indicated cells, where firefly Renilla was used as internal control (mean ± s.d., n=3 biological replicates). The indicated cells were treated with H2O, CdCl2 (50 μM) and ZnCl2 (250 μM) for 4 hours. ** p < 0.01, *** p < 0.001 (two-tailed Student’s t-test). (j) MRE luciferase reporter assay was performed by co-transfecting MTF1 construct with that encoding LATS1, LATS1-KR mutant or TEAD4 in HEK293T cells, where firefly Renilla was used as internal control (mean ± s.d., n=3 biological replicates). *** p < 0.001 (two-tailed Student’s t-test). ns, no significance. (k) The transcription of CTGF and CYR61 was examined in the indicated cells by q-PCR (mean ± s.d., n=3 biological replicates). *** p < 0.001 (two-tailed Student’s t-test). (l-m) The indicated cells were treated with H2O, CdCl2 (50 μM) and ZnCl2 (250 μM) for 1 hour, and subjected to immunofluorescent staining using the indicated antibody (l). Around 60 cells in total were randomly selected and quantified for the MTF1 and YAP subcellular localization (mean ± s.d., n=3 biological replicates) (m). Scale bar, 40 μm. The average fluorescence intensity for YAP and MTF1 between nucleus (N) and cytoplasm (C) in each cell was compared. *** p < 0.001 (two-way AVONA test). ns, no significance. (n) The indicated cells stably expressing SFB-MTF1 were treated with H2O, CdCl2 (50 μM) and ZnCl2 (250 μM) for 2 hours, and subjected to ChIP assay using S protein beads. The precipitated DNA was quantified by q-PCR (mean ± s.d., n=3 biological replicates). *** p < 0.001 (two-tailed Student’s t-test).
Fig. 4:
Fig. 4:. LATS1 binds and phosphorylates MTF1 at S152.
(a) HEK293T cells transfected with SFB-tagged MTF1 construct were subjected to pulldown assay using S protein beads. Western blot was performed using the indicated antibodies. (b) Schematic illustration of MTF1 domains and its truncations. (c) SFB-tagged LATS1 was expressed in HEK293T cells, purified using S protein beads, washed thoroughly with high-salt buffer containing 250 mM NaCl, and subjected to the ATP-γ-S-based in vitro kinase assay using the bacterially purified MBP-tagged MTF1-R1/2/3/4 regions (b) and GST-YAP as substrates. Western blot was performed using the indicated antibodies. (d) MBP-tagged MTF1-R2 protein was purified from bacteria, used as substrate in the SFB-LATS1 in vitro kinase assay, and subjected to mass spectrometry analysis. The identified phosphorylation sites and their PhosphoSite information (https://www.phosphosite.org/) were shown. (e-h) SFB-tagged LATS1 was expressed in HEK293T cells, purified using S protein beads, washed thoroughly with high-salt buffer containing 250 mM NaCl, and subjected to the ATP-γ-S-based in vitro kinase assay using the indicated bacterially purified MBP-MTF1-R2 and its mutant proteins as substrates (e-f). MTF1-R2-5A represents the MTF1-R2-S152A/T153A/T241A/S301A/T302A mutant. LATS1-induced MTF1-R2 phosphorylation at S152 was validated using anti-phospho-MTF1 S152 antibody via in vitro kinase assay (g). SFB-tagged MTF1 and its S152A mutant were expressed in wild-type and the LATS1/2 DKO HEK293A cells and purified using S protein beads (h). Western blot was performed using the indicated antibodies. (i) Protein sequence alignment shows that MTF1 S152 site is highly conserved among different species. The conserved Cys, Arg and Ser residues were highlighted in colors. (j) The constructs encoding the indicated SFB-tagged YAP and its mutants were expressed in wild-type and the LATS1/2 DKO HEK293A cells, and subjected to pulldown assay using S beads. Western blot was performed using the indicated antibodies. Data shown represent 2 independent experiments in a, c-h and j.
Fig. 5:
Fig. 5:. LATS-mediated MTF1 S152 phosphorylation inhibits heavy metal response.
(a-b) HEK293T cells were transfected with the constructs encoding myc-tagged LATS1 and the indicated SFB-tagged MTF1 and its mutants (a), and subjected to the MRE luciferase reporter assay (mean ± s.d., n=3 biological replicates) (b). *** p < 0.001 (two-tailed Student’s t-test). ns, no significance. (c) HEK293A cells were transfected with the constructs encoding the indicated SFB-tagged MTF1 and its mutants, treated with CdCl2 (50 μM) and ZnCl2 (250 μM) for 1 hour, and subjected to immunofluorescent staining. Scale bar, 40 μm. Data shown represent 3 independent experiments. (d) Wild-type and the LATS/MTF1 TKO HEK293A cells were transduced with the indicated constructs. Western blot was performed using the indicated antibodies. Arrow indicates the exogenously expressed SFB-tagged MTF1 and its S152D mutant. (e) The LATS/MTF1 TKO HEK293A cells were reconstituted with vector and SFB-tagged MTF1 and its S152D mutant, treated with CdCl2 (50 μM) and ZnCl2 (250 μM) for 2 hours, and subjected to ChIP assay. The precipitated DNA was quantified by q-PCR (mean ± s.d., n=3 biological replicates). *** p < 0.001 (two-tailed Student’s t-test). (f-g) The LATS/MTF1 TKO HEK293A cells were reconstituted with vector and SFB-tagged MTF1 and its S152D mutant, treated with CdCl2 (50 μM) and ZnCl2 (250 μM) for 12 hours, visualized by crystal violet staining (f), and quantified for relative viability (mean ± s.d., n=4 biological replicates) (g). * p < 0.05, *** p < 0.001 (two-tailed Student’s t-test). (h-j) The transcription of MT1A (h), MT1F (i) and ZNT2 (j) was examined in wild-type and the LATS/MTF1 TKO HEK293A cells reconstituted with vector and SFB-tagged MTF1 and its S152D mutant by q-PCR (mean ± s.d., n=3 biological replicates). Cells were treated with CdCl2 (50 μM) and ZnCl2 (250 μM) for 4 hours. * p < 0.05, ** p < 0.01, *** p < 0.001 (two-tailed Student’s t-test). ns, no significance. Data shown represent 2 independent experiments in a and d.
Fig.6:
Fig.6:. Inhibition of the Hippo pathway promotes heavy metal detoxification.
(a) Hep3B cells were treated with XMU-MP-1 at the indicated concentrations for 4 hours. Western blot was performed using the indicated antibodies. Data shown represent 2 independent experiments. (b-c) Hep3B cells were pre-incubated with DMSO and XMU-MP-1 (10 μM) for 4 hours, treated with CdCl2 (50 μM) and ZnCl2 (250 μM) for 12 hours, visualized by crystal violet staining (b), and quantified for relative viability (mean ± s.d., n=4 biological replicates) (c). *** p < 0.001 (two-tailed Student’s t-test). (d) Hep3B cells were pre-incubated with XMU-MP-1 (10 μM) for 2 hours, and treated with CdCl2 (50 μM) and ZnCl2 (250 μM) for 4 hours. Transcription of MT1A and MT1F was examined by q-PCR (mean ± s.d., n=3 biological replicates). ** p < 0.01, *** p < 0.001 (two-tailed Student’s t-test). (e-i) Schematic illustration of CdCl2 intoxication experiment in mice was shown (e). XMU-MP-1 treatment significantly increased mouse survival upon CdCl2 intoxication (n = 12 mice per group) (f). *** p < 0.001 (Log-rank test). ns, no significance. Immunohistochemical analyses of Mt1 protein expression and cell apoptosis (cleaved-caspase-3) were performed in the liver and kidney tissues collected from the mice treated with DMSO, XMU-MP-1 alone or combined with VP post CdCl2 intoxication (g). H&E, hematoxylin and eosin staining. Arrows indicate the positive cleaved-caspase 3 staining. The indicated regions in the box are shown 3 times enlarged. Scale bar, 150 μM. The transcription of Mt1, Mt2 and Ctgf was examined in mouse livers (h) and kidneys (i) under the indicated treatments by q-PCR (mean ± s.d., n=3 biological replicates). *** p < 0.001 (two-tailed Student’s t-test).
Fig. 7:
Fig. 7:. The Hippo pathway is negatively regulated by heavy metals.
(a) Hep3B cells were serum starved for 24 hours and treated with the indicated metals for 1 hour. Western blot was performed using the indicated antibodies. All the metals were used at the concentration of 250 μM except for CdCl2 (50 μM) and AgNO3 (50 μM). (b) Hep3B cells were serum starved for 24 hours, treated with CdCl2 (50 μM) and ZnCl2 (250 μM) for 1 hour, and subjected to immunofluorescent staining. Scale bar, 40 μm. Data shown represent 3 independent experiments. (c) Hep3B and HEK293A cells were serum starved for 24 hours, and treated with CdCl2 (50 μM) and ZnCl2 (250 μM) for 4 hours. The transcription of YAP downstream genes CTGF and CYR61 was examined by q-PCR (mean ± s.d., n = 3 biological replicates). *** p < 0.001 (two-tailed Student’s t-test). (d-e) Immunohistochemical analysis of Yap was performed in the mouse liver and kidney tissues two hours post CdCl2 treatment (d). The indicated regions in the box are shown 2.5 times enlarged. Scale bar, 150 μM. The transcription of genes Ctgf, Cyr61 and Mt1 was examined at the indicated time points post CdCl2 treatment by q-PCR (mean ± s.d., n=3 biological replicates) (e). *** p < 0.001 (two-tailed Student’s t-test). (f) The indicated Hep3B cells were serum starved for 24 hours, treated with CdCl2 (50 μM) and ZnCl2 (250 μM) for 1 hour, and subjected to pulldown assay using S protein beads. (g) Hep3B and HEK293A cells were serum starved for 24 hours, and treated with CdCl2 (50 μM) and ZnCl2 (250 μM) for 1 hour. Western blot was performed using the indicated antibodies. (h-m) Hep3B cells were serum starved for 24 hours, treated with CdCl2 (50 μM) and ZnCl2 (250 μM) for 1 hour, and subjected to immunoprecipitation/pulldown using the indicated antibodies. For LATS1 in vitro kinase assay, bacterially purified GST-YAP (h) and MBP-MTF1-R2 (i) proteins were used as substrates. For MST1 (j), MAP4K4 (k), SFB-MAP4K2 (l) and SFB-MAP4K6 (m) in vitro kinase assays, bacterially purified MBP-LATS1-C3 protein was used as substrate. Western blot was performed using the indicated antibodies. Data shown represent 2 independent experiments in a, f-m.
Fig. 8:
Fig. 8:. Zn binds and inhibits LATS.
(a-b) HEK293T cells were transfected with the constructs encoding SFB-tagged LATS1 (a) and LATS2 (b), and subjected to pulldown assay. (c) HEK293T cells were transfected with the constructs encoding the indicated SFB-tagged Hippo pathway components, and subjected to pulldown assay. (d) Schematic illustration of LATS1 protein domains and its truncations. (e) HEK293T cells were transfected with the constructs encoding the indicated SFB-tagged LATS1 and its truncation mutants, and subjected to pulldown assay. (f) The indicated bacterially purified MBP-tagged LATS1 truncation proteins were subjected to pulldown assay. CBS, coomassie blue staining. (g) SFB-tagged MST1 was expressed in HEK293T cells, purified using S protein beads, washed thoroughly with high-salt buffer containing 250 mM NaCl, and subjected to in vitro kinase assay. Bacterially purified MBP-LATS1-C3 protein was incubated with Zn chelator TPEN (25 μM), and used as substrate in the SFB-MST1 in vitro kinase assay. (h) SFB-tagged MST1 and MAP4K2 were expressed in HEK293T cells, purified using S protein beads, washed thoroughly with high-salt buffer containing 250 mM NaCl, and subjected to in vitro kinase assay using bacterially purified MBP-LATS1-C3 protein as substrate. The in vitro kinase was performed in the presence of Ca and Zn at the indicated concentrations. Relative phosphorylation of MBP-LATS1-C3 at T1079 was shown. (i) SFB-tagged LATS1 was expressed in HEK293T cells, purified using S protein beads, washed thoroughly with high-salt buffer containing 250 mM NaCl, incubated with Zn chelator TPEN (25 μM), and subjected to in vitro kinase assay. Bacterially purified GST-YAP protein was used as substrate in the SFB-LATS1 in vitro kinase assay. (j) SFB-tagged LATS1 and LATS2 were expressed in HEK293T cells, purified using S protein beads, washed thoroughly with high-salt buffer containing 250 mM NaCl, and subjected to in vitro kinase assay using bacterially purified GST-YAP protein as substrate. The in vitro kinase was performed in the presence of Ca and Zn at the indicated concentrations. Relative phosphorylation of GST-YAP at S127 was shown. (k-n) MBP (0.2 μg/μL) and MBP-tagged LATS1-C3 (0.2 μg/μL) proteins were purified from bacteria (k), incubated with Ca and Zn at the indicated concentrations, and subjected to circular dichroism analysis (l-n). Data shown represent 2 independent experiments in a-c, e-n.

References

    1. Gunther V, Lindert U & Schaffner W The taste of heavy metals: gene regulation by MTF-1. Biochim Biophys Acta 1823, 1416–1425 (2012). - PubMed
    1. Sharma B, Singh S & Siddiqi NJ Biomedical implications of heavy metals induced imbalances in redox systems. Biomed Res Int 2014, 640754 (2014). - PMC - PubMed
    1. Planchart A, Green A, Hoyo C & Mattingly CJ Heavy Metal Exposure and Metabolic Syndrome: Evidence from Human and Model System Studies. Curr Environ Health Rep 5, 110–124 (2018). - PMC - PubMed
    1. Baltaci AK, Yuce K & Mogulkoc R Zinc Metabolism and Metallothioneins. Biol Trace Elem Res (2017). - PubMed
    1. Coyle P, Philcox JC, Carey LC & Rofe AM Metallothionein: the multipurpose protein. Cell Mol Life Sci 59, 627–647 (2002). - PMC - PubMed

Publication types

MeSH terms