. 2022 Jan;24(1):35-50.
doi: 10.1038/s41556-021-00822-7. Epub 2022 Jan 13.

Cysteine oxidation of copper transporter CTR1 drives VEGFR2 signalling and angiogenesis

Affiliations

Cysteine oxidation of copper transporter CTR1 drives VEGFR2 signalling and angiogenesis

Archita Das et al. Nat Cell Biol. 2022 Jan.

Abstract

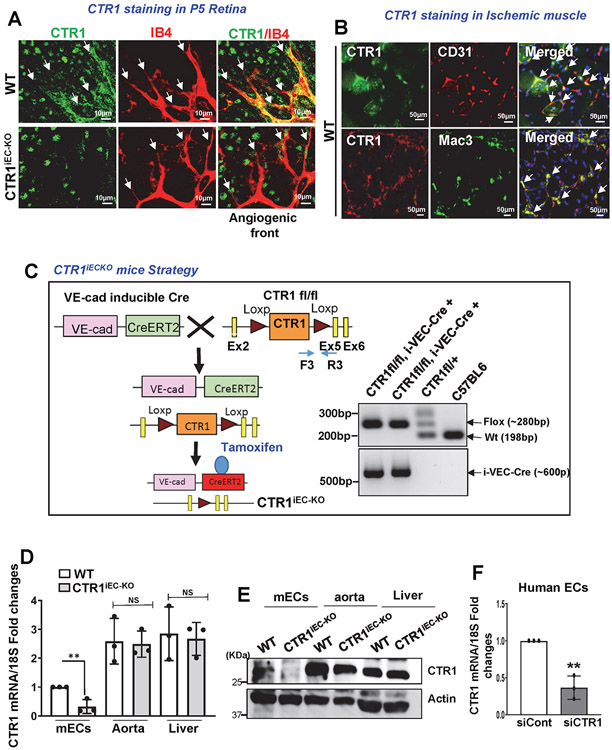
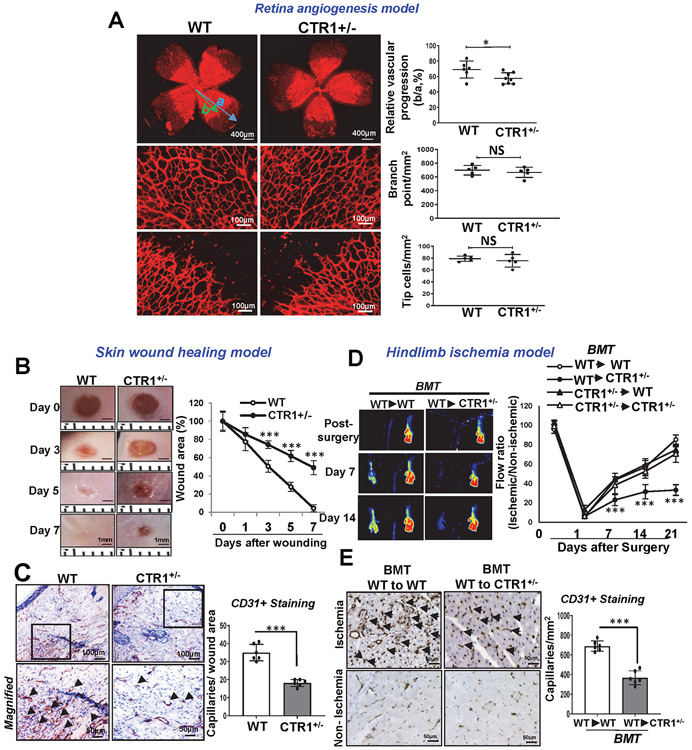
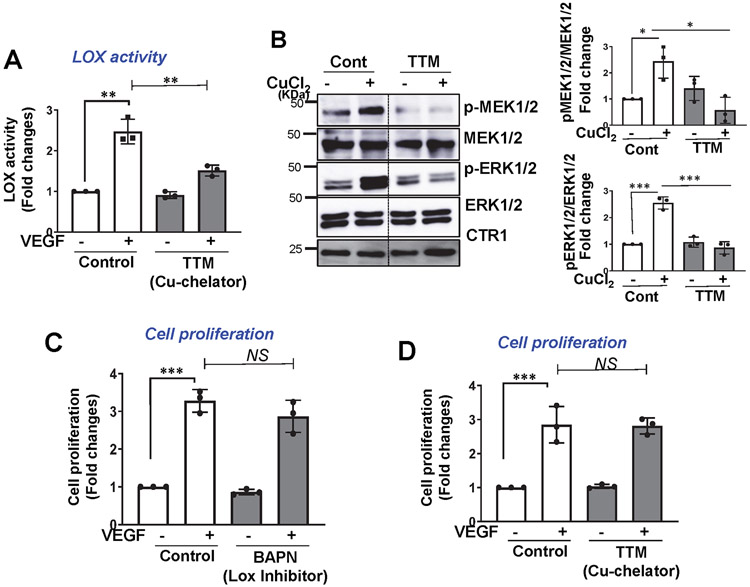
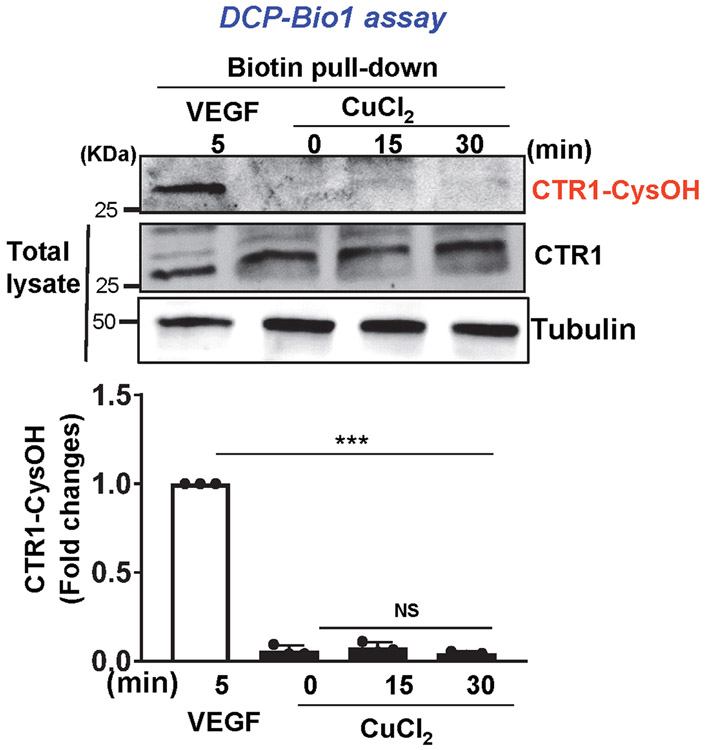
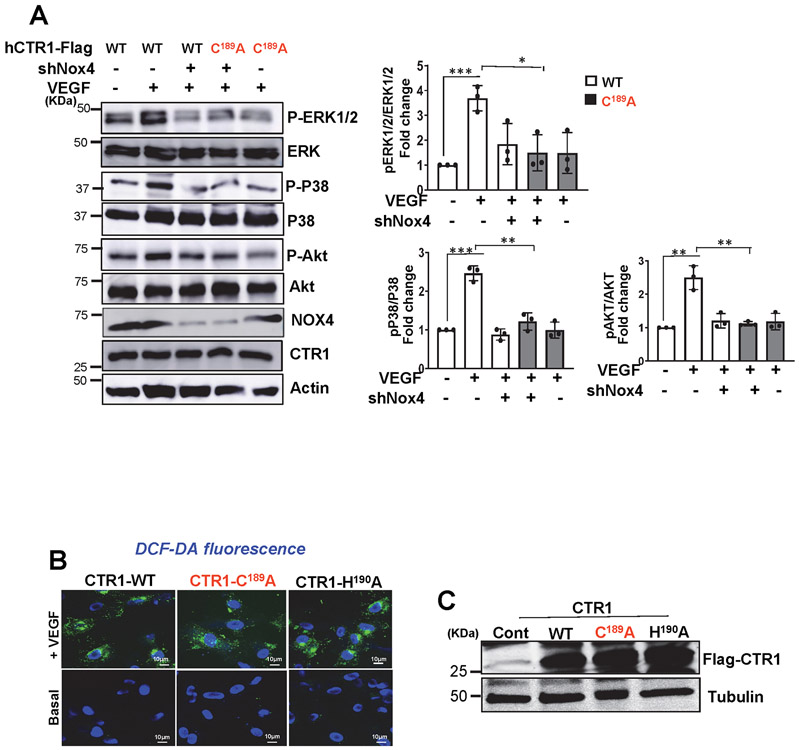
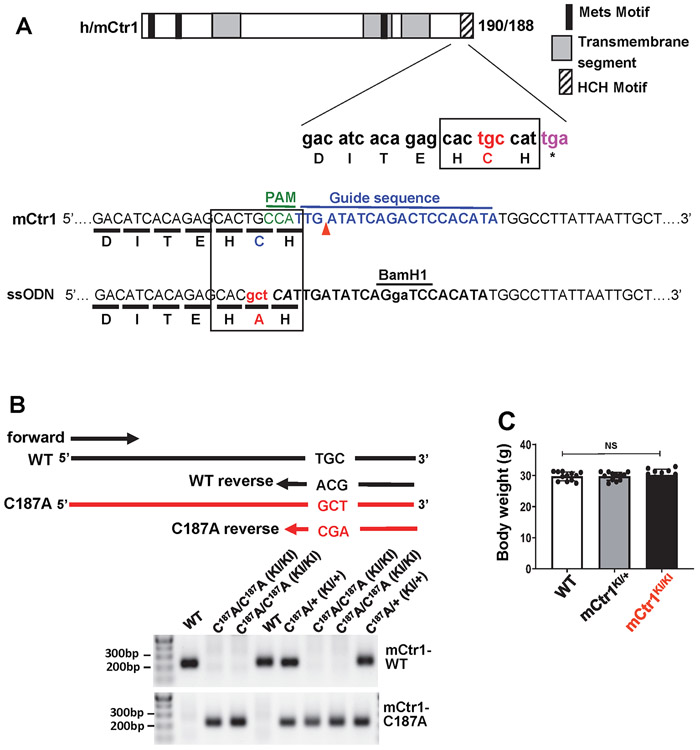
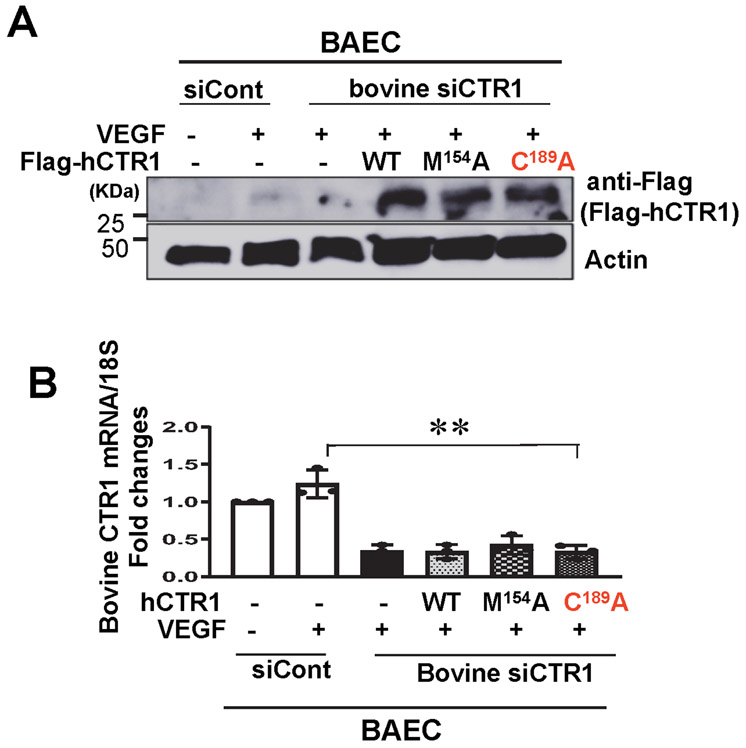
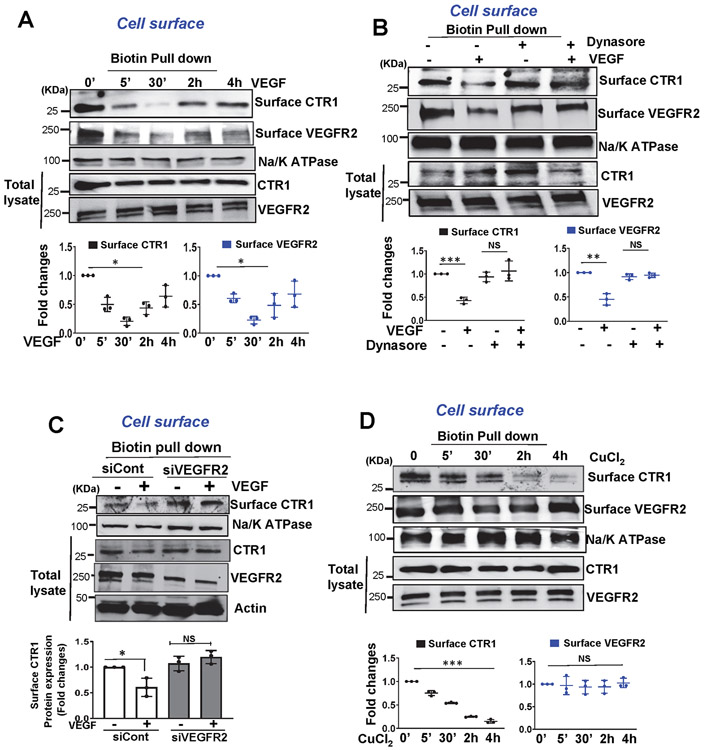
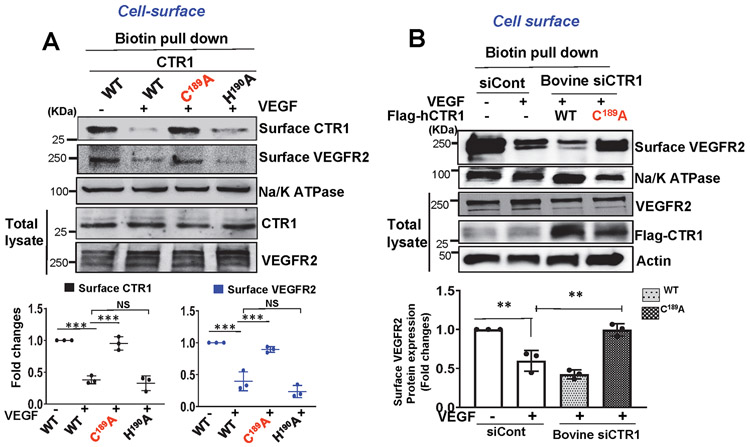
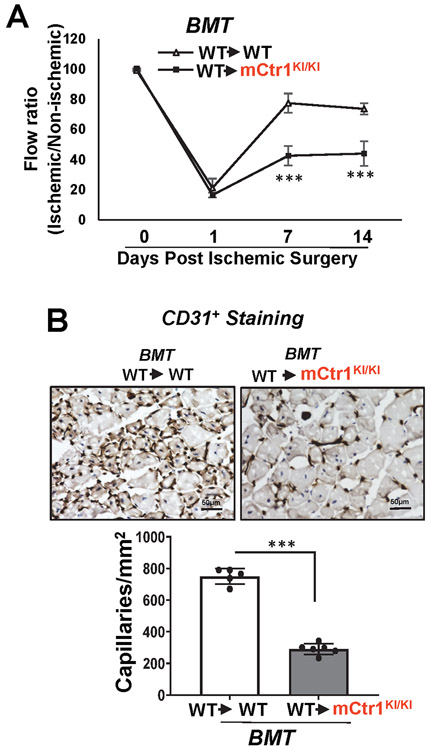
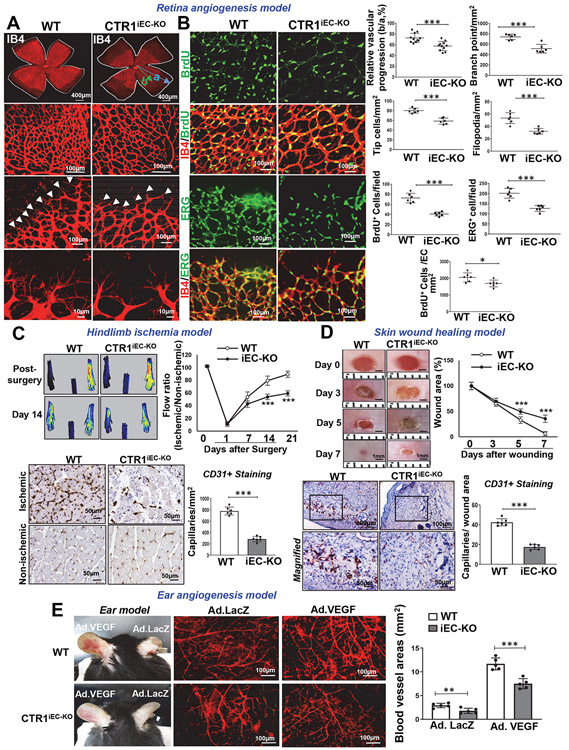
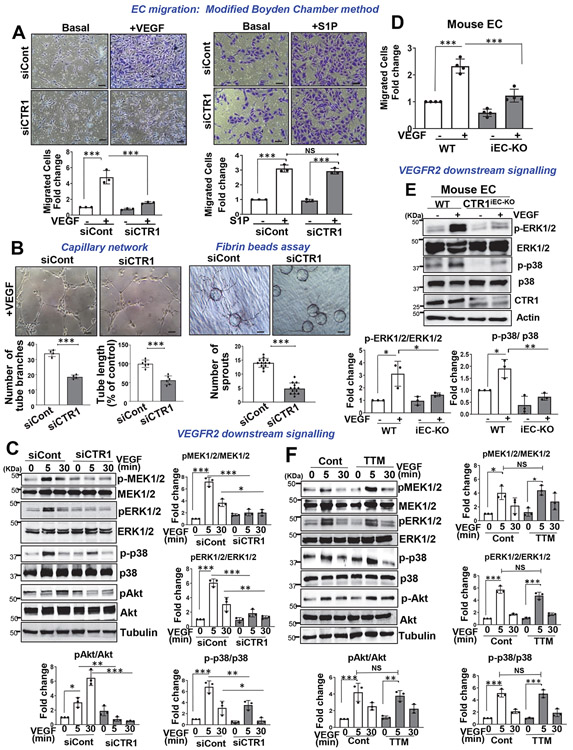
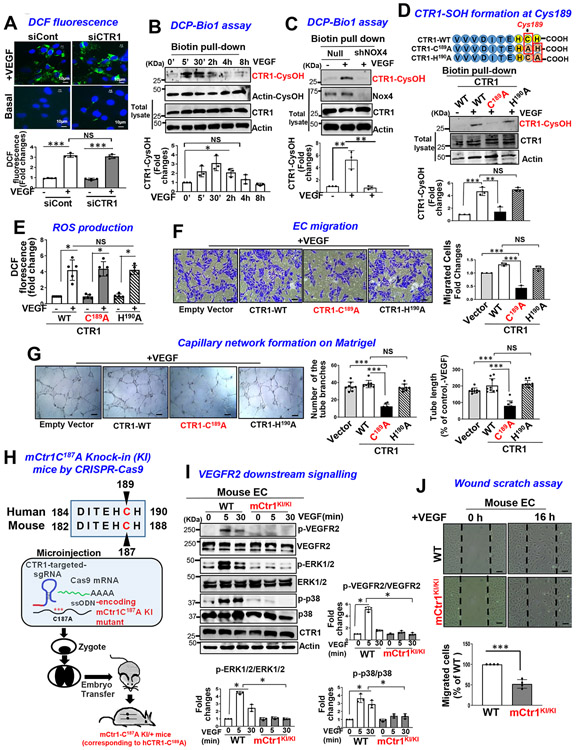
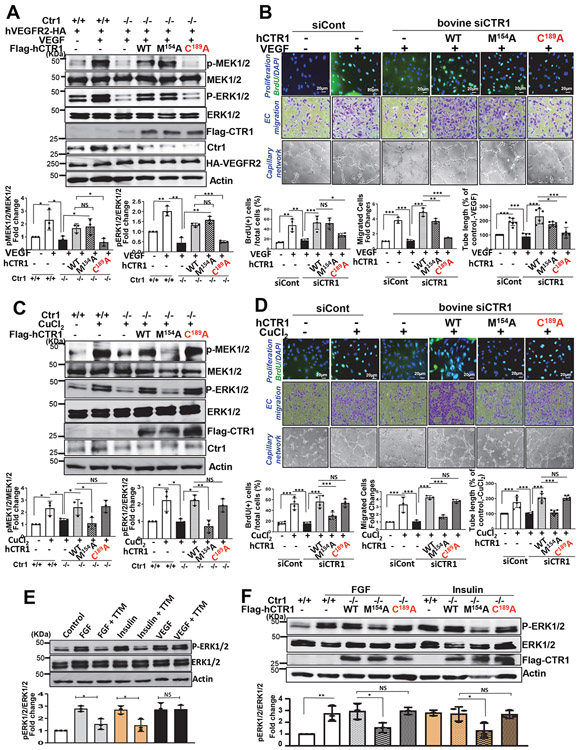
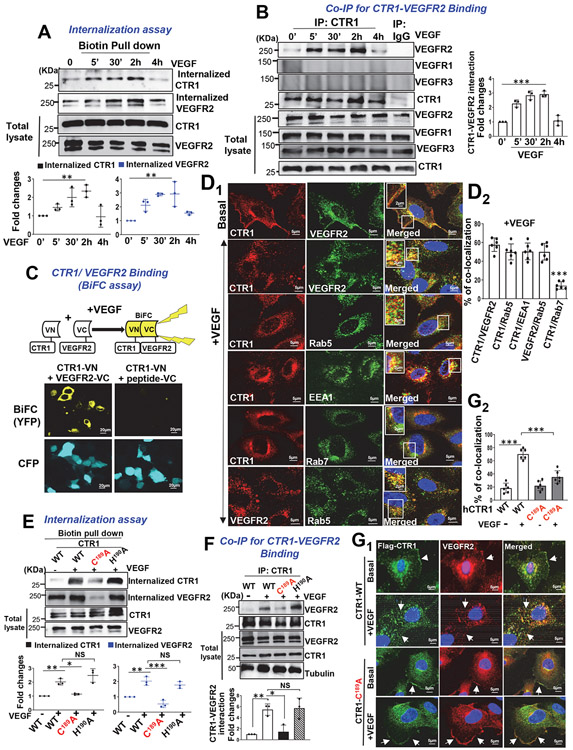
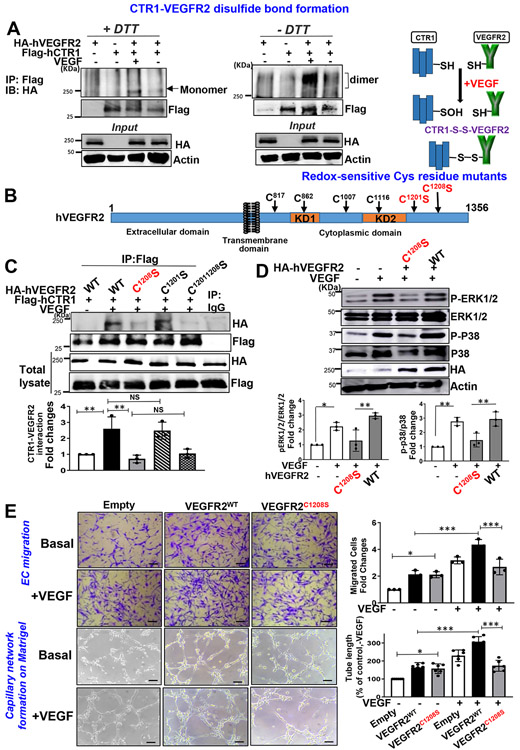
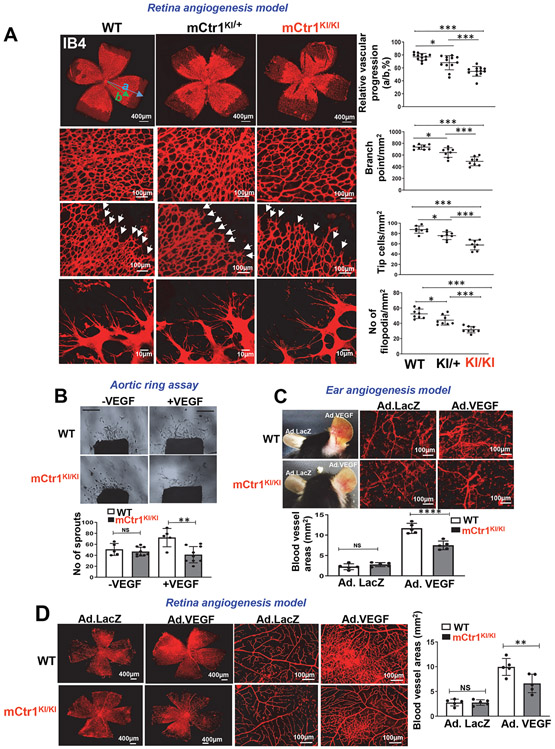
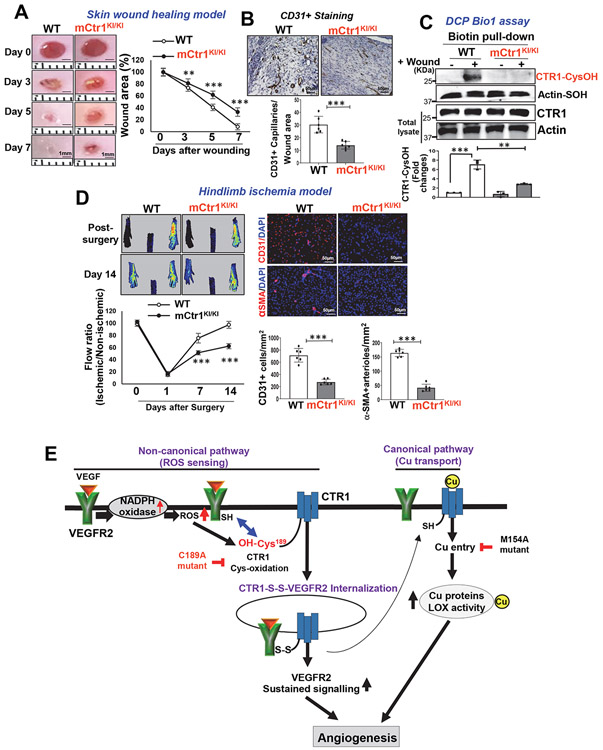
Vascular endothelial growth factor receptor type 2 (VEGFR2, also known as KDR and FLK1) signalling in endothelial cells (ECs) is essential for developmental and reparative angiogenesis. Reactive oxygen species and copper (Cu) are also involved in these processes. However, their inter-relationship is poorly understood. Evidence of the role of the endothelial Cu importer CTR1 (also known as SLC31A1) in VEGFR2 signalling and angiogenesis in vivo is lacking. Here, we show that CTR1 functions as a redox sensor to promote angiogenesis in ECs. CTR1-depleted ECs showed reduced VEGF-induced VEGFR2 signalling and angiogenic responses. Mechanistically, CTR1 was rapidly sulfenylated at Cys189 at its cytosolic C terminus after stimulation with VEGF, which induced CTR1-VEGFR2 disulfide bond formation and their co-internalization to early endosomes, driving sustained VEGFR2 signalling. In vivo, EC-specific Ctr1-deficient mice or CRISPR-Cas9-generated redox-dead Ctr1(C187A)-knockin mutant mice had impaired developmental and reparative angiogenesis. Thus, oxidation of CTR1 at Cys189 promotes VEGFR2 internalization and signalling to enhance angiogenesis. Our study uncovers an important mechanism for sensing reactive oxygen species through CTR1 to drive neovascularization.


Figures

Extended Data Fig. 1
Extended Data Fig. 1. CTR1 expression in endothelial cells and characterization of inducible Endothelial CTR1-KO mice.
A. Co-staining for CTR1 and isolectin B4 (IB4) in a postnatal day (P)5 mouse retina in CTR1 WT and CTR1iECKO mice in developmental retina angiogenesis models. Arrows indicate the tip sprouts of vessels. B. Co-staining for CTR1 and CD31 (EC marker) or Mac-3 (macrophage marker) and their colocalization (merged, white arrows) on day 3 (upper) and day 14 (lower), respectively, in ischemic gastrocnemius muscles in hindlimb ischemia models. Representative images from n=3 independent experiments are shown. C. Strategy to generate tamoxifen-inducible EC-specific CTR1 knockout (CTR1iECKO) mice by crossing CTR1flox/flox mice with VE-Cadherin (Cdh5)-ERT2 Cre delete mice, which specifically express Cre in ECs upon tamoxifen administration. D and E. mRNA and proteins from aortic ECs, liver and lung isolated from WT and CTR1iECKO mice and analyzed by qPCR and Western blotting using CTR1 antibody or Actin antibody (loading control) (n=6 biologically independent cells/samples), two-tailed unpaired t-test, **p= 0.0085. F. Real time qPCR analysis of CTR1 mRNA in HUVECs transfected with control or CTR siRNAs. (n=3 biologically independent experiments), two-tailed unpaired t-test, **p= 0.0023. NS= not significant. Data are mean ± SEM). Source numerical data and unprocessed blots are available in source data.
Extended Data Fig. 2
Extended Data Fig. 2. CTR1+/− mice show impaired postnatal developmental and reparative angiogenesis in vivo.
A. Retinal whole-mount staining with Isolectin B4 (IB4) of P5 WT and CTR1+/− mice. Right panels show quantification of vascular progression length, numbers of branch point and tip cells. (n=6 samples each for WT and CTR1+/−, compared with Two-tailed unpaired t-test. *p=0.0378). B and C. WT and CTR1+/− mice were used for skin wound healing model. Representative images show time-course for wounded skin and graph represents the wound closure rates expressed as % of wound area from control at day 0 after wounding (B). Wounded tissues at day 7 were used to measure CD31+ capillary density (C). Boxes showed magnified images. Right panel showed the quantification. (n=6 mice per group, representative of two independent experiments, compared with two-way ANOVA followed by Bonferroni’s multiple comparison analysis (B) or two-tailed unpaired t-test (C)). D and E. Irradiated WT or CTR1+/− mice were transplanted with bone marrow (BM) from WT or CTR1+/− mice. After 6 weeks of BM transplantation (BMT), mice were subjected to hindlimb ischemia and limb blood flow was measured at indicated days after surgery using a laser Doppler flow analyzer (D). In E, CD31+ capillary density (angiogenesis) in ischemic and non-ischemic gastrocnemius muscles was measured at day 21 after surgery. (n=6 mice per group, representative of two independent experiments, compared with two-way ANOVA followed by Bonferroni’s multiple comparison analysis (D), or Two-tailed unpaired t-test (E), ***p<0.001. NS=not significant. Data are mean ± SEM). Source numerical data are available in source data.
Extended Data Fig. 3
Extended Data Fig. 3. Cu-dependent LOX activity is not required for VEGF-induced EC proliferation.
A and D. HUVECs treated with Cu chelator, TTM (20nM) for 24hr were used to measure LOX activity in conditioned media (A) or cell proliferation measured by BrdU incorporation (D) after VEGF stimulation for 24 hr. B. HUVECs treated with Cu chelator TTM for 24 hr were stimulated with CuCl2 (25μM) for 5 min, and lysates were used to immunoblotted (IB) with anti-p-MEK1/2 or p-ERK1/2 and their total proteins antibodies. C. HUVECs treated with specific LOX inhibitor, BAPN (100μM) for 24h were used to measure VEGF-induced cell proliferation as described. (n=3 biologically independent experiments). A and B, two-tailed unpaired t-test. C and D, one-way ANOVA followed by Tukey's multiple comparisons analysis, *p<0.05, **p<0.01, ***p<0.001. NS=not significant. Data are mean ± SEM. Source numerical data and unprocessed blots are available in source data.
Extended Data Fig. 4
Extended Data Fig. 4. CuCl2 does not induce CTR1 Sulfenylation.
HUVECs were stimulated with CuCl2 (25μM) for indicated times or VEGF (20ng/ml) for 5min (for positive control), and DCP-Bio1-labeled lysates were pulled down with streptavidin beads and then IB with CTR1 or actin antibody to detect their CysOH formation. Bottom panel represents averaged CTR1-CysOH/total CTR1 level expressed by fold change from VEGF-induced CTR1-CysOH level as 1.0. (n=3 biologically independent experiments) two-tailed unpaired t-test. ***p<0.001. NS=not significant. Data are mean ± SEM. Source numerical data and unprocessed blots are available in source data.
Extended Data Fig. 5
Extended Data Fig. 5. Nox4-ROS-CTR1 Cys189OH axis is required for VEGF-induced VEGFR2 downstream signaling in ECs.
A, HUVECs transfected with Flag-hCTR1-WT, or Flag-hCTR1-C189A were infected with Ad.null (control) or Ad.shNox4 and stimulated with VEGF for 5 min to measure VEGF signaling using IB with antibodies indicated. Graphs represent the averaged fold change of phosphorylated proteins/total proteins over the basal control. (n=3 biologically independent experiments) two-tailed unpaired t-test. ***p= 0.0008, *p= 0.013, ***P= 0.0002, **P= 0.0019, **P= 0.0019, **P= 0.0028. Data are mean ± SEM. B and C. HUVECs transfected with Flag-CTR1-WT or Flag-hCTR1-C189A or Flag-hCTR1-H190A were stimulated with VEGF (20ng/ml) for 5min to measure DCF fluorescence with DAPI staining (B). In C, lysates were used for IB with Flag antibody to verify expression of transfected CTR1 proteins. Tubulin is a loading control. B, C. The experiment is representative of 3 independent experiments that yielded similar results. Source numerical data and unprocessed blots are available in source data.
Extended Data Fig. 6
Extended Data Fig. 6. Generation of Cys oxidation defective “redox dead” mouse mCtr1-C187A (corresponding to human CTR1-C189A) knock-in (KI) mutant (mCtr1-KI) mice by using CRISPR-Cas9 genome editing.
A. Alignment of partial amino acid sequences from human and mouse CTR1, indicating homology (boxes) between human Cys189 and mouse Cys187. Schematic of the 20-nucleotide sgRNA target sequence of the mCtr1 (blue) and the PAM (green). The red arrowhead indicates the Cas9 cleavage site. ssODN, which contains 90 base pairs (bp) of homology sequence flanking each side of the target site was used as HDR template. ssODN incorporates point mutations (red) and BamHI restriction enzyme site (underlined by black). B. CTR1 CRISPR mice genotyping for mCtr1C187A mutant and mCtr1WT after cross breeding with mCtr1KI/+ and mCtr1KI/+. Multiplex PCR genotyping of mCtr1 (C187A) progeny. One common reverse primer was used for both genotypes. The PCR products were in between 300-200bp. HDR indicates homology directed repair; sgRNA, single-guide RNA; ssODN, single-strand oligoDNA. The experiment is representative of 6 independent experiments that yielded similar results. C. Body weight of WT, mCtr1KI/+ and mCtr1KI/KI mice. (n=12 mice per group, compared with two-tailed unpaired t-test. NS= not significant. Data are mean ± SEM). Source numerical data are available in source data.
Extended Data Fig. 7
Extended Data Fig. 7. Ectopic expression of Flag-hCTR1-WT, Flag-hCTR1-C189A, or Flag-hCTR1-M154A in bovine aortic endothelial cells (BAECs) transfected with bovine siCont or siCTR1.
Lysates from Fig. 4B were used for IB with anti-Flag antibody to verify ectopic hCTR1 expression or Tubulin antibody (loading control)(A). RNA samples were used for real time qPCR analysis to measure bovine CTR1 mRNA (B). These data suggest successful knockdown of bovine CTR1 in BAEC with expression of various human CTR1 constructs. (n=3 biologically independent experiments) two-tailed unpaired t-test. **p<0.01. Data are mean ± SEM. Source numerical data and unprocessed blots are available in source data.
Extended Data Fig. 8
Extended Data Fig. 8. VEGF promotes internalization of CTR1 and VEGFR2 from cell surface in a dynamin- and VEGFR2-dependent manner but CuCl2 promotes CTR1 internalization not VEGFR2.
A, B, C. HUVECs stimulated with VEGF (20ng/ml) for indicated times (A) or incubated with dynasore, a dynamin-associated endocytic inhibitor (200nM) (B) or transfected with control or VEGFR2 siRNAs were stimulated with VEGF (20 ng/ml) for 30 min (C). Cells were labeled with cell surface biotinylation reagent, 1 mM EZ-Link Sulfo-NHS-LC-Biotin, followed by wash and then lysates were pulled down with streptavidin beads, followed by IB with antibodies indicated to detect cell surface CTR1 or VEGFR2 or Na,K-ATPase (cell surface marker). D. HUVECs stimulated with CuCl2 (25μM) for indicated times were labeled with cell surface biotinylation reagent, 1 mM EZ-Link Sulfo-NHS-LC-Biotin. After wash, lysates were pulled down with streptavidin beads, followed by IB with antibodies indicated to detect cell surface CTR1 or VEGFR2 or Na,K-ATPase. Bottom panels represent the averaged cell surface CTR1 and VEGFR2 levels expressed as fold changes from the basal control. (n=3 biologically independent experiments). A, B and D two-tailed unpaired t-test. C, one-way ANOVA followed by Tukey's multiple comparisons analysis, *p<0.05, **p<0.01, ***p<0.001. NS=not significant. Data are mean ± SEM). Source numerical data and unprocessed blots are available in source data.
Extended Data Fig. 9
Extended Data Fig. 9. CTR1 sulfenylation at Cys189 is required for VEGF-induced internalization of CTR1 and VEGFR2.
A. HUVECs were transfected with Flag-hCTR1-WT or Flag-hCTR1-C189A or Flag-hCTR1-H190A, cells stimulated with VEGF (20ng/ml) for 30min were used for measurement of cell surface CTR1 or VEGFR2 or Na/K ATPase using cell surface biotinylation assay, as in Extended data Fig. 9. B. BAECs transfected with bovine sibovine siCTR1 or siControl, together with either Flag-hCTR1-WT, or Flag-hCTR1-C189A were stimulated with VEGF (20ng/ml) for 30 mins. Cells were used to measure cell surface VEGFR2 or Na,K-ATPase protenin expression using cell surface biotinylation assay, as described.) (n=3 biologically independent experiments). one-way ANOVA followed by Tukey's multiple comparisons analysis, *p<0.05, **p<0.01, ***p<0.001. NS=not significant. Data are mean ± SEM. Source numerical data and unprocessed blots are available in source data.
Extended Data Fig. 10
Extended Data Fig. 10. CTR1 sulfenylation in tissue resident cells is required for ischemia-induced angiogenesis in vivo.
A and B. Irradiated WT or mCTR1KI/KI mice were transplanted with BM from WT mice. After 6 weeks of BMT, mice were subjected to hindlimb ischemia and limb blood flow using a laser Doppler flow analyzer (A). CD31+ capillary density in ischemic gastrocnemius muscle at day 14 after ischemic injury were measured (B). (n=6 mice per group, representative of two independent experiments, compared with two-way ANOVA followed by Bonferroni’s multiple comparison analysis (A) or two-tailed unpaired t-test (B), ***p<0.001. Data are mean ± SEM). Source numerical data are available in source data.
Figure 1:
Figure 1:. Endothelial CTR1 is required for postnatal angiogenesis in vivo.
A and B. Retinal whole-mount staining with Isolectin B4 (IB4) of P6 WT and CTR1iECKO mice. Arrowheads show tip cell sprouting and filopodia (A). BrdU or ERG (endothelial nuclei marker)(green) co-stained with or without IB4 (red) in P6 retinal flatmounts of WT and CTR1iECKO mice (B). Right panels show quantification of vascular progression length, numbers of branch point, tip cells and filopodia (A) and BrdU -or ERG-positive cells or endothelial BrdU-positive cells in the field (B), (vascular progression: n=11 samples each for WT and CTR1iECKO; branch point, tip cells, filopodia, BrdU+, ERG+: n=6 samples each for WT and CTR1iECKO respectively, compared with two-tailed unpaired t-test). C. Blood flow recovery after hindlimb ischemia as determined by the ratio of foot perfusion between ischemic (left) and non-ischemic (right) legs in WT and CTR1iECKO mice (right), two-way ANOVA followed by Bonferroni’s multiple comparison analysis. Left panels show representative laser Doppler images of legs at day 14. Bottom panels show CD31+ staining (capillary density) in ischemic and nonischemic gastrocnemius muscles at day 14. Right panel shows quantification, (n=6 mice per group, representative of two independent experiments, compared with two-tailed unpaired t-test). D. Excisional cutaneous wounds were created using a 3 mm biopsy punch on the dorsal skin of WT and CTR1iECKO mice. Ruler notches=1 mm. Right panel shows the quantification of wound closure rates, two-way ANOVA followed by Bonferroni’s multiple comparison analysis. Bottom images show CD31 staining of wounded tissues at day 7 with magnified images in Box. Right panel shows quantification, (n=6 mice per group, representative of two independent experiments, compared with two-tailed unpaired t-test). E. Adenovirus encoding VEGF164 (1×10⁹ pfu) (Ad-VEGF) or β-galactosidase (Ad-LacZ) was intradermally injected into the right and left ear skin of WT and CTR1iECKO mice, respectively. Ear vasculature (red) was visualized by a whole-mount staining with CD31. Right panel shows the quantification of vessel density. (n=5 mice per group, representative of two independent experiments, two-tailed unpaired t-test. *p<0.05, **p<0.005, ***p<0.001. Data are mean ± SEM). Source numerical data are available in source data.
Figure 2:
Figure 2:. CTR1 knockdown inhibits VEGF-induced signaling and angiogenesis in ECs.
A and D. EC migration measured by the modified Boyden chamber method in HUVECs transfected with control or CTR siRNAs stimulated with VEGF (20ng/ml) or S1P (10μM) for 6 h (A) or ECs isolated from WT (WT ECs) or Ctr1iECKO mice stimulated with VEGF for 8h (D). Graph represents the averaged fold change of migrated cells over the basal control (n=3 biologically independent experiments, one-way ANOVA followed by Bonferroni’s multiple comparison analysis). Scale bars=50μm. B. Capillary-like network formation on Matrigel analyzed by the number of tube branches or capillary tube length (left). Capillary sprouting formation in the fibrin clot analyzed by the number of sprouts (right). (n=3 biologically independent experiments, two-tailed unpaired t-test). Scale bars=50μm. C,E,F. HUVECs transfected with control or CTR1 siRNAs (C); or WT ECs or Ctr1iECKO ECs (E); HUVECs treated with the Cu chelator TTM (20 nM) for 24h (F) stimulated with VEGF (20ng/ml) were used to measure VEGF signaling using Western blotting. Graphs represent the averaged fold change of phosphorylated proteins/total proteins over the basal control (n=3 biologically independent experiments). C, one-way ANOVA followed by Tukey's multiple comparisons analysis. E, two-tailed unpaired t-test. F, one-way ANOVA followed by Bonferroni’s multiple comparison analysis. *p<0.05, **p<0.01, ***p<0.001. Data are mean ± SEM. Source numerical data and unprocessed blots are available in source data.
Figure 3:
Figure 3:. VEGF induces CTR1-Cys189OH formation, which promotes angiogenesis in ECs.
A. HUVECs transfected with control or CTR1 siRNAs stimulated with VEGF (20 ng/ml) for 5 min were used for dichlorofluorescein (DCF) fluorescence and DAPI staining (blue). Bottom panel represents the averaged fold change from the basal control (n=3 biologically independent experiments, one-way ANOVA followed by Bonferroni’s multiple comparison analysis). B, C, D. HUVECs stimulated with VEGF for indicated time (B), or HUVECs infected with Ad.null or Ad.shNox4 (C), or transfected with Flag-hCTR1-WT, Flag-hCTR1-C189A or Flag-hCTR1-H190A (D) stimulated with VEGF for 5 min were used for DCP-Bio1 assay. In D, top panel: Amino acid sequence of the human CTR1 C terminus in WT and two mutants (CTR1-WT, CTR1-C189A, CTR1-H190A). DCP-Bio1-labeled lysates pulled down with streptavidin beads were immunoblotted (IB) with anti-CTR1 or actin (B) or anti-CTR1 (C) or Flag (D) to measure CTR1-CysOH formation. (n=3 biologically independent experiments, two-tailed unpaired t-test). *p =0.0143, ** P=0.0072, **P=0.0063, ***P=0.0006, **P=0.005. E, F, G. HUVECs transfected with empty vector, Flag-CTR1-WT, Flag-CTR1-C189A or Flag-CTR1-H190A were used to measure DCF fluorescence stimulated with VEGF for 5 min (E), or EC migration (Boyden chamber assay) stimulated with VEGF for 6 h (F), or capillary network formation on Matrigel stimulated with VEGF for 4 h. Scale bars=50μm. G. Bar graphs represent the averaged fold change from the basal control. H. Schematic diagram of CRISPR-generated “redox dead” mCtr1-C187A (human CTR1-C189A) knock-in (KI)(mCtr1KI/+ mice. CRISPR sgRNA targeting the mCtr1 gene, Cas9 mRNA, and single stranded oligo donor DNA (ssODN) encoding CTR1 mutations was injected into mouse zygotes. I and J. Aortic ECs from WT and mCtr1KI/KI mice were used to measure VEGF signaling using Western blots (I) or EC migration using a wound scratch assay. Scale bars=50μm. J. Graph represents the averaged % of migrated cells at wounded area compared to WT ECs. E, F, G, I and J. (n=3 biologically independent cells, two-tailed unpaired t-test). *p<0.05, **p<0.01, ***p<0.001. NS=not significant. Data are mean ± SEM. Source numerical data and unprocessed blots are available in source data.
Figure 4:
Figure 4:. Role of CTR1-Cys189OH formation and Cu transport function in VEGF-, Cu-, and other growth factor-induced signaling and angiogenic responses.
A and C. Ctr1−/− MEFs transfected with HA-hVEGFR2 (A only), Flag-hCTR1-WT, Flag-hCTR1-C189A or Flag-hCTR1-M154A; or Ctr+/+ MFFs transfected with HA-hVEGFR2 (A only) or empty vector were stimulated with VEGF (20ng/ml)(A) or CuCl2 (100μM)(C), followed by Western blotting. B and D. Bovine aortic endothelial cells (BAECs) were transfected with siControl or siCTR1, and siCTR1-treated ECs were also transfected with empty vector, Flag-hCTR1-WT, Flag-hCTR1-C189A, or Flag-hCTR1-M154A. These cells were used to measure VEGF (20ng/ml)(B)- or CuCl2 (100μM)(D)-induced cell proliferation (BrdU incorporation), cell migration (modified Boyden chamber assay) or capillary network formation on Matrigel. E and F. HUVECs treated with Cu chelator, TTM (20nM) for 24h (E), CTR1+/+ or Ctr1−/− MEFs transfected with Flag-hCTR1-WT, Flag-hCTR1-C189A or Flag-hCTR1-M154A (F) were stimulated with FGF (1ng/ml) or insulin (25μg/ml) for 10 min. Lysates were used to measure p-ERK1/2, and their total proteins using Western blots. Graphs represent the averaged fold change of phosphorylated proteins/total proteins over the basal control (n=3 biologically independent experiments). A and C, two-tailed unpaired t-test. B, D, E and F, one-way ANOVA followed by Tukey's multiple comparisons analysis. *p<0.05, **p<0.01, ***p<0.001. NS=not significant. Data are mean ± SEM. Source numerical data and unprocessed blots are available in source data.
Figure 5:
Figure 5:. CTR1-Cys189OH formation is required for VEGF-induced CTR1 binding to VEGFR2 and their co-internalization to early endosomes.
A. Cell surface of HUVECs were labeled with 1 mM EZ-Link Sulfo-NHS-SS-Biotin for 60min, followed by VEGF (20ng/ml) stimulation. After wash, lysates were biotin-pulled down, followed by IB with anti-CTR1 or VEGFR2 to measure their internalization. Bottom panels represent averaged fold change over the basal control. B. HUVECs stimulated with VEGF (20ng/ml) were immunoprecipitated (IP) with anti-CTR1 or IgG (negative control), followed by IB with antibodies indicated. Right panel represents the averaged fold change of CTR1/VEGFR2 ratio over the basal ratio. A and B. (n=3 biologically independent experiments, one-way ANOVA followed by Bonferroni’s multiple comparison analysis). **P= 0.0064, **P= 0.0014. C. BiFC assay. HEK293 cells co-transfected with Flag-hCTR1-VN173 and HA-hVEGFR2-VC155 or peptide-VC155 (negative control) with ECFP were stimulated with VEGF for 30 min. The YFP (Yellow) shows interaction of CTR1 and VEGFR2. (the experiment is representative of 3 independent experiments that yielded similar results) D. HUVECs stimulated with VEGF for 20 min were co-stained for CTR1 with VEGFR2 or early endosome markers (Rab5 or EEA1) or late endosome marker (Rab7). Yellow fluorescence shows their colocalization in the white box in the merged images (D1). Right panel shows the averaged % of co-localization (D2). E and F. HUVECs transfected with Flag-hCTR1-WT, Flag-hCTR1-C189A or Flag-hCTR1-H190A stimulated with VEGF (20ng/ml) for 30 min were used to measure internalized CTR1 (detected by anti-Flag) and VEGFR2 using cell surface biotinylation assay (E) or Co-IP for CTR1-VEGFR2 (F). (n=3 biologically independent experiments, one-way ANOVA followed by Tukey's multiple comparisons analysis). **p= 0.0071, *p= 0.0159, **p= 0.0017, ***p= 0.0001, **p= 0.0084, *p= 0.0153. G. HUVECs transfected with Flag-hCTR1-WT or Flag-hCTR1-C189A stimulated with VEGF for 30min were used for CTR1-VEGFR2 co-localization analysis using anti-Flag (green for CTR1) and anti-VEGFR2 (red) (G1). White arrow heads show their colocalization. Upper panel shows the averaged % of co-localization (G2). D2 and G2. (n=6 images examined over 3 biologically independent experiments; one-way ANOVA followed by Bonferroni’s multiple comparison analysis). *p<0.05, **p<0.01, ***p<0.001. NS=not significant. Data are mean ± SEM. Source numerical data and unprocessed blots are available in source data.
Figure 6:
Figure 6:. CTR1 Cys189OH forms disulfide bond with VEGFR2 at Cys1208, which promotes VEGFR2 signaling and angiogenic responses.
A. Right panel Schematic diagram of disulfide formation between CTR1-S(Cys189)OH and VEGFR2-SH after VEGF stimulation. Left panel, HEK293T cells transfected with HA-hVEGFR2-WT and Flag-hCTR1-WT were stimulated with VEGF (20ng/ml) for 10 min. Lysates were IP with anti-Flag, followed by SDS-PAGE under nonreducing (-DTT) and reducing (+DTT) conditions and IB with anti-HA antibody (the experiment is representative of 3 independent experiments that yielded similar results). B. VEGFR2 protein structure. VEGFR2 is composed of an extracellular domain, transmembrane domain, two separate kinase domains (KD1 and KD2), and C-terminal domain. The highly conserved six cysteine residues in VEGFRs are indicated by arrows and redox sensitive cysteine residues (C1201 and C1208) are shown in red. C. HEK cells co-transfected with Flag-hCTR1 WT and various HA-hVEGFR2 mutants (VEGFR2-WT, C1201S, C1208S, C1201, 1208S) were stimulated with VEGF (20 ng/mL) for 10 min. Lysates were IP with anti-Flag or IgG (negative control), followed by IB with anti-HA antibody. (n=3 biologically independent experiments, one-way ANOVA followed by Tukey's multiple comparisons analysis). **P=0.0093, **P=0.0029. D and E. BAECs transfected with empty vector, HA-VEGFR2-WT, or -VEGFR2-C1208S were used to measure VEGFR2 signaling stimulated by VEGF for 5 min using Western blotting (D) (n=3 biologically independent experiments, one-way ANOVA followed by Tukey's multiple comparisons analysis). *P=0.021, **P=0.0037, **P=0.0019, **P=0.006. In parallel, cells were used to measure VEGF-induced EC migration using the Boyden chamber assay or capillary network formation on Matrigel (E). Scale bars=50μm. Bar graphs represent the averaged fold change from the basal control. (n=3 biologically independent experiments, one-way ANOVA followed by Tukey's multiple comparisons analysis). *p<0.05, **p<0.01, ***p<0.001. NS=not significant. Data are mean ± SEM. Source numerical data and unprocessed blots are available in source data.
Figure 7:
Figure 7:. CTR1-CysOH formation is required for developmental and VEGF-induced angiogenesis in vivo.
A. Retinal whole-mount staining with Isolectin B4 (IB4) of P5 WT, “redox dead” mCTR1KI/+ or mCTR1KI/KI mice. Arrowheads show tip cell sprouting and filopodia. Right panels show quantification of vascular progression length, numbers of branch point, tip cells and filopodia. (vascular progression: n=12 samples each for WT, mCTR1KI/+, and mCTR1KI/KI; branch point, tip cells, filopodia: n=8 samples each for WT, mCTR1KI/+, and mCTR1KI/KI respectively, compared with One-way ANOVA followed by Tukey's multiple comparisons analysis, *p<0.05, **p<0.01, ***p<0.001). B. Aortic ring assays showing the number of sprouts from WT and mCTR1KI/KI mice embedded on Matrigel stimulated with VEGF (20 ng/ml) for 9 days. Scale bars=1mm. (two independent experiments were performed using n=5 and n=9 aortic explants from WT and mCtr1KI/KI respectively, compared with One-way ANOVA followed by Tukey's multiple comparisons analysis, **p= 0.001). C. Ad.VEGF (1×10⁹ pfu) or Ad-LacZ was intradermally injected into the right and left ear skin of WT and mCTR1KI/KI mice, respectively. Ear vasculature (red) was measured by a whole mount staining with CD31 antibody. D. Ad.VEGF (1×10⁹ pfu) or Ad-LacZ was injected intravitreously into WT and mCTR1KI/KI mice, and retina vasculature was measured by isolectin B4 staining. C and D. Histograms show the averaged vessel density. (n=5 samples each for WT and mCTR1KI/KI mice respectively, compared with one-way ANOVA followed by Tukey's multiple comparisons analysis, **p=0.0059, ****p<0.0001. Data are mean ± SEM). Source numerical data are available in source data.
Figure 8:
Figure 8:. CTR1-CysOH formation is required for reparative angiogenesis in vivo.
A, B, C, D. WT and mCTR1KI/KI mice were used for skin wound healing model (A, B, C) or hindlimb ischemia model (D). In A, representative images show time-course for wounded skin closure and graph represents the wound closure rates expressed as % of wound area from control at day 0 after wounding. B and C. Wounded tissues at day 7 were used to measure CD31+ capillary density (B) or CysOH formation of CTR1 or actin (control) using DCP-Bio1 assay (C). D. Left panels show blood flow recovery as determined by the ratio of foot perfusion between ischemic (left) and non-ischemic (right) legs after hindlimb ischemia. Upper panels show representative laser Doppler images and bottom panel shows quantitative analysis. Right panels show the CD31+ capillaries or α-SMA+ arterioles co-stained with DAPI in ischemic gastrocnemius muscles with quantification. (n=6 mice per group, representative of two independent experiments, compared with two-way ANOVA followed by Bonferroni’s multiple comparison analysis (A and D-left panel), and two-tailed unpaired t-test (B, C, and D-right panel), *p<0.05, **p<0.01, ***p<0.001. Data are mean ± SEM). Source numerical data and unprocessed blots are available in source data. E. Proposed model: VEGF stimulation in ECs rapidly induces CTR1-CysOH formation at Cys189 via NOX4-derived ROS, which promotes CTR1-VEGFR2 disulfide bond formation and subsequently their co-internalization to early endosomes driving sustained VEGFR2 signaling in a Cu transport-independent manner. Subsequently, internalized CTR1 and VEGFR2 return to the plasma membrane, and which may activate Cu uptake-LOX axis-dependent angiogenic responses. Thus, VEGF-induced CysOH formation of CTR1 at Cys189 which promotes Cu entry-independent activation of VEGFR2 signaling as well as the canonical Cu entry-dependent activation of Cu-dependent enzymes, such as LOX, are orchestrated to enhance developmental and reparative angiogenesis.

References

    1. Simons M, Gordon E & Claesson-Welsh L Mechanisms and regulation of endothelial VEGF receptor signalling. Nat Rev Mol Cell Biol 17, 611–625 (2016). - PubMed
    1. Simons M An inside view: VEGF receptor trafficking and signaling. Physiology (Bethesda) 27, 213–222 (2012). - PMC - PubMed
    1. Eichmann A & Simons M VEGF signaling inside vascular endothelial cells and beyond. Curr Opin Cell Biol 24, 188–193 (2012). - PMC - PubMed
    1. Lanahan A et al. The neuropilin 1 cytoplasmic domain is required for VEGF-A-dependent arteriogenesis. Dev Cell 25, 156–168 (2013). - PMC - PubMed
    1. Sawamiphak S et al. Ephrin-B2 regulates VEGFR2 function in developmental and tumour angiogenesis. Nature 465, 487–491 (2010). - PubMed

Publication types

MeSH terms