. 2022 Feb;28(2):333-344.
doi: 10.1038/s41591-021-01625-x. Epub 2022 Jan 13.

Anti-GD2 synergizes with CD47 blockade to mediate tumor eradication

Affiliations

Anti-GD2 synergizes with CD47 blockade to mediate tumor eradication

Johanna Theruvath et al. Nat Med. 2022 Feb.

Abstract

The disialoganglioside GD2 is overexpressed on several solid tumors, and monoclonal antibodies targeting GD2 have substantially improved outcomes for children with high-risk neuroblastoma. However, approximately 40% of patients with neuroblastoma still relapse, and anti-GD2 has not mediated significant clinical activity in any other GD2+ malignancy. Macrophages are important mediators of anti-tumor immunity, but tumors resist macrophage phagocytosis through expression of the checkpoint molecule CD47, a so-called 'Don't eat me' signal. In this study, we establish potent synergy for the combination of anti-GD2 and anti-CD47 in syngeneic and xenograft mouse models of neuroblastoma, where the combination eradicates tumors, as well as osteosarcoma and small-cell lung cancer, where the combination significantly reduces tumor burden and extends survival. This synergy is driven by two GD2-specific factors that reorient the balance of macrophage activity. Ligation of GD2 on tumor cells (a) causes upregulation of surface calreticulin, a pro-phagocytic 'Eat me' signal that primes cells for removal and (b) interrupts the interaction of GD2 with its newly identified ligand, the inhibitory immunoreceptor Siglec-7. This work credentials the combination of anti-GD2 and anti-CD47 for clinical translation and suggests that CD47 blockade will be most efficacious in combination with monoclonal antibodies that alter additional pro- and anti-phagocytic signals within the tumor microenvironment.


Conflict of interest statement

Competing interests

R.G.M. and C.L.M. are founders of, hold equity in and receive consulting fees from Syncopation Life Sciences. C.L.M. is a founder of, holds equity in and receives consulting fees from Lyell Immunopharma. R.G.M. and E.S. are consultants for Lyell Immunopharma. R.G.M. is a consultant for NKarta, Illumina Radiopharmaceuticals, GammaDelta Therapeutics, Aptorum Group and Zai Labs. J.T. is a consultant for Dorian Therapeutics. C.L.M. has also received consulting fees from NeoImmune Tech, Nektar Therapeutics and Apricity Health and royalties from Juno Therapeutics for CD22-CAR. W.A.W. is a founder of, holds equity in and receives consulting fees from StemSynergy Therapeutics. R.M. is on the Board of Directors of BeyondSpring and the Scientific Advisory Boards of Coherus BioSciences, Kodikaz Therapeutic Solutions and Zenshine Pharmaceuticals. R.M. and I.W. are inventors on several patents related to CD47 cancer immunotherapy that are licensed to Gilead Sciences. J.P. is an employee and shareholder of ALX Oncology, and T.C.K. and E.R.B.S. are shareholders of ALX Oncology. J.S. receives research funding from Stemcentrx/Abbvie and Pfizer and licensed a patent to Forty Seven/Gilead on the use of CD47 blocking strategies in SCLC (with I.W.). C.R.B. is a co-founder of Redwood Biosciences (a subsidiary of Catalent), Enable Biosciences, Palleon Pharmaceuticals, InterVenn Bio, Lycia Therapeutics and OliLux Biosciences and is a member of the Board of Directors of Eli Lilly. J.R.C. is a co-founder and equity holder of xCella Biosciences, Combangio and Trapeze Therapeutics. All other authors declare no competing interests.

Figures

Extended Data Fig. 1 |
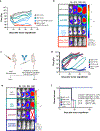
Extended Data Fig. 1 |. anti-GD2 and anti-CD47 synergize to promote tumor cell phagocytosis.
a-b, Representative Images of Incucyte based live cell phagocytosis assay. a, pHrodo red labeled KCNR (top) or CHLA255 (bottom) neuroblastoma cells were co-cultured with human blood derived macrophages in the presence of anti-GD2 mAb, anti-CD47 mAb or dual treatment. Red indicative of tumor cell phagocytosis. Images were obtained after 24 hours of co-culture. b, Magnified image of cells shown in a. c-d, Quantification of phagocytosis normalized to the phagocytosis in the untreated control for each cell line, c, KCNR (Untreated vs. GD2+CD47 p = 2.9E-14, GD2 vs. GD2+CD47 p = 5.4681E-10, CD47 vs. GD2+CD47 p = 1.13E-12) d, CHLA255 (Untreated vs. GD2+CD47 p = 3.3E-14, GD2 vs. GD2+CD47 p = 2.128E-12, CD47 vs. GD2+CD47 p = 3.3E-14). Data are mean values +/− s.e.m. of five experimental replicates. Experiment was performed one time. e, Flow-based phagocytosis assay of KCNR neuroblastoma cells co-cultured with human blood derived macrophages in the presence of different concentrations of anti-GD2 mAb, anti-CD47 mAb or dual treatment. % phagocytosing macrophages are reported. Data are mean values +/− s.d. of three experimental replicates. Experiment was performed one time. Statistical comparisons performed with one-way ANOVA with multiple comparisons correction, *P < 0.05, **P < 0.01, ***P < 0.001, ****P < 0.0001, ns P>0.05.
Extended Data Fig. 2 |
Extended Data Fig. 2 |. Anti-CD47 and anti-GD2 synergize to mediate significant anti-tumor activity in orthotopic models of neuroblastoma.
One million KCNR neuroblastoma cells expressing GFP-luciferase were implanted into the renal capsule and treated four days later with IgG control, anti-G2 mAb, anti-CD47 (magrolimab, Hu5F9-G4) mAb or dual anti-GD2/anti-CD47 (Hu5F9-G4) every other day for three doses as in Fig. 1c. a, Quantification of tumor progression for each individual mouse as measured by flux values acquired via bioluminescence (BLI) photometry. b, BLI images of representative mice from each treatment group at different time points. Experiment was performed one time. N = 4 mice for IgG, and N = 5 for anti-GD2 per group and those groups are the same as in Fig. 1c–f. N=3 for anti-CD47 and anti-CD47 + anti-GD2 c, One million CHLA255 neuroblastoma cells expressing GFP-luciferase cells were implanted into the renal capsule in NSG mice. Four days later, mice were injected with IgG control, anti-GD2 mAb, anti-CD47 mAb or dual anti-GD2/anti-CD47 treatment every other day for three doses. d, Quantification of tumor progression for each individual mouse as measured by flux values acquired via BLI photometry. e, BLI images of representative mice from each treatment group shown in d at different time points. Red cross indicates deceased mouse. f, Survival curves for mice bearing tumors shown in d. d-f, Representative data from three independent experiments with N = 5 mice per group. All survival curves were compared using the Log-rank test (two-tailed).
Extended Data Fig. 3 |
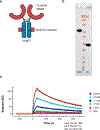
Extended Data Fig. 3 |. Expression and affinity of ALX301, an engineered molecule capable of blocking murine CD47.
a, Schematic of ALX301: Murine IgG1 containing a N297A mutation was fused to a mutated SIRPα capable of binding murine CD47 with enhanced affinity. b, Purified ALX301 was detected on 4–20% Tris-glycine gel in non-reducing (NR) and reducing (R) buffer. ALX301 runs slightly larger than the expected 76.16 kDa (NR) and 38.038 kDa (R). c, ALX301 was immobilized on GLC sensor chip (Bio-rad). Recombinant mouse CD47 protein was injected as analyte over the chip at 5 concentrations, 3-fold dilution (100nM, 33.3nM, 11.1nM, 3.7nM, 1.2nM). Using Langmuir binding model for curve fitting, the binding of ALX301 to mouse SIRPα was determined to be 3.41nM. Association rate (ka), dissociation rate (kd), affinity (KD). b-c were performed one time.
Extended Data Fig. 4 |
Extended Data Fig. 4 |. Absence of toxicity of anti-GD2 and anti-CD47 treated mice in a model of metastatic neuroblastoma.
a, One million CHLA255 neuroblastoma cell were injected in the tail vein of the mice. After 4 days mice were treated intraperitoneally with PBS (control), anti-GD2, anti-CD47 or the combination of anti-GD2 and anti-CD47 3x/week for a total of 7 doses. b, Weight was serially recorded. c-e, CatWalk gait analysis was performed at indicated time points and c, swing speed, d, stride length and e, regularity index are reported from mice treated as in a. Data shown are mean values +/− s.e.m. n = 5 mice per group. Experiment was performed one time. f, Hematoxylin and eosin (H&E) stained sections of all organs examined were within normal limits as assessed by brightfield microscopy. Shown are sections of cerebrum, cerebellum, peripheral nerve, heart, liver, kidney, spleen, and lung of animals from mice treated as in a. Magnification: 40x, Scale bars: 20μm.
Extended Data Fig. 5 |
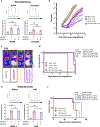
Extended Data Fig. 5 |. Lack of synergy of anti-B7-H3 with anti-CD47 in xenograft models of neuroblastoma or osteosarcoma.
a, Graphs show flow cytometry-based quantification of phagocytosis of neuroblastoma cell lines co-cultured with human blood derived macrophages in the presence of anti-CD47 mAb, anti-B7-H3 mAb, or dual treatment, compared with untreated control; results normalized to the phagocytosis in the untreated control for each cell line and blood donor. Shown are mean values +/− s.d. of three experimental replicates. Statistical comparisons performed with one-way ANOVA with multiple comparisons correction (KCNR: control vs. anti-B7-H3 p = 0.9643, anti-CD47 vs. anti-B7-H3 and anti-CD47 p = 0.9976; CHLA255: control vs. anti-B7-H3 p>0.9999, anti-CD47 vs. anti-B7-H3 and anti-CD47 p = 0.8519). Representative data from at least three experiments with three different blood donors. Inset: B7-H3 expression as assessed by flow cytometry on respective cell lines. b, One million CHLA255 neuroblastoma cells were engrafted into NSG mice by tail-vein injection. On D+4, mice were treated with IgG control, anti-CD47 mAb, anti-B7-H3 mAb, or anti-B7-H3+anti-CD47 every other day for three doses. Quantification of tumor progression for each individual mouse as measured by flux values acquired via BLI photometry. c, BLI images of representative mice from each treatment group shown in b at one time point. d, Survival curves for mice bearing tumors shown in b. N = 5 mice per group, performed one time. Survival curves were compared using the Log-rank test (two-tailed). e, Graph shows flow cytometry-based quantification of phagocytosis of osteosarcoma cell lines co-cultured with human blood derived macrophages; results normalized to the phagocytosis in the untreated control for each cell line and blood donor. Shown are mean values +/− s.d. of three experimental replicates. Statistical comparisons performed as in a. Representative data from at least three experiments with three different blood donors. Inset: B7-H3 expression as assessed by flow cytometry on respective cell lines. f, Survival curves for mice that received hind leg injection of 1e6 MG63.3 cells and treated on D+7 with indicated antibodies 3x/week for four weeks. N = 5 mice per group, performed one time. Survival curves were compared using the Log-rank test (two-tailed). *P < 0.05, ns P>0.05.
Extended Data Fig. 6 |
Extended Data Fig. 6 |. upregulation of ‘Eat me’ signal calreticulin and induction of cell death by ligation with anti-GD2 mAb on neuroblastoma cell lines.
a, Flow cytometric analysis of the levels of expression of GD2 on the surface of neuroblastoma cell lines CHLA255 and KCNR and their GD2-KO (B4GALNT1 KO) versions. b, Flow-based quantification of cell viability. Neuroblastoma cell lines and their GD2-KO versions were incubated with anti-GD2 mAb for the indicated times at 37 degrees and stained with DAPI. Percent of DAPI- populations were normalized to the untreated control for each cell line. Shown are mean values +/− s.d. of 6 experimental replicates. (CHLA255: 3hr p = 4.17E-08, 6hr p = 6.5044E-09, 12hr p = 1.2983E-11, 24hr p = 1.9094E-07, 48hr p = 7E-15, 72hr p = 1.2397E-08; CHLA255 GD2 KO: 3hr p = 0.3013, 6hr p = 0.506, 12hr p = 0.4125, 24hr p = 0.983, 48hr p = 0.4263, 72hr p = 0.8453; KCNR: 3hr p = 3.75E-10, 6hr p = 7.0881E-07, 12hr p = 1.1406E-07, 24hr p = 4.2986E-08, 48hr p = 2.6777E-06, 72hr p = 2.9544E-06; KCNR GD2 KO: 3hr p = 0.0059, 6hr p = 0.0083, 12hr p = 0.3223, 24hr p = 0.8197, 48hr p = 0.1443, 72hr p = 0.1002). c, Graph shows flow cytometric quantification of the expression of calreticulin (ΔMFI) on the surface of live neuroblastoma cell lines treated as in b. Shown are mean values +/− s.d. of 3 experimental replicates. CHLA255: 3hr p = 6.57E-05, 6hr p = 0.0004, 12hr p = 0.0002, 24hr p = 9.2150E-06, 48hr p = 0.0167, 72hr p = 0.027; CHLA255 GD2 KO: 3hr p = 0.4701, 6hr p = 0.9563, 12hr p = 0.9024, 24hr p = 0.7235, 48hr p = 0.6415, 72hr p = 0.4069; KCNR: 3hr p = 7.41E-07, 6hr p = 7.4552E-07, 12hr p = 0.0038, 24hr p = 0.0024, 48hr p = 0.0019, 72hr p = 0.0005; KCNR GD2 KO: 3hr p = 0.671, 6hr p = 0.9445, 12hr p = 0.023, 24hr p = 0.2359, 48hr p = 0.0426, 72hr p = 0.8656. ΔMFI was calculated as the difference between the MFI in the PE channel of the calreticulin stained sample and the MFI in the PE channel of an isotype stained sample from the same experimental condition. The full time-course experiment was performed twice and the twelve-hour timepoint shown is identical to Fig. 4h. b-c, Statistical comparisons performed with the unpaired t-test, *P < 0.05, **P < 0.01, ***P < 0.001, ****P < 0.0001, ns P>0.05.
Extended Data Fig. 7 |
Extended Data Fig. 7 |. Anti-CD47 and anti-GD2 synergize to mediate significant anti-tumor activity in xenograft model of small cell lung cancer (SCLC).
a, NCI-H69 SCLC were engrafted on both flanks of NSG mice. Quantification of tumor growth for each individual tumor was assessed by caliper measurement. b, Survival curves for mice bearing tumors shown in a. Survival curves were compared using the Log-rank test (two-tailed). Representative of two independent experiments with n = 5 mice per group.
Extended Data Fig. 8 |
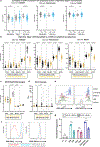
Extended Data Fig. 8 |. Anti-GD2 and anti-CD47 treatment leads to an increase in macrophage infiltration and reduction of M2 macrophages.
a, Flow cytometric analysis of M2 macrophages (defined as CD163+ and CD206+, gated on CD45+, CD11b+, F4/80 + macrophages) in osteosarcoma tumors treated as described in Fig. 6, pooled results from two independent experiments. Shown are mean values +/− s.em. of 10 experimental replicates. Control vs. GD2+CD47 p = 0.0007, CD47 vs. GD2+CD47 p = 0.0738, GD2 vs. GD2+CD47 p = 0.8869. b-f, CHLA255 neuroblastoma tumor cells were engrafted in the flank and allowed to grow for 19 days before initiation of treatment with IgG control, anti-GD2 mAb, anti-CD47 mAb or dual anti-GD2/anti-CD47. After one week of treatment, tumors were harvested for immunohistochemistry (IHC) and flow cytometric analysis. b, Representative IHC images showing detection of macrophages via staining with anti-F4/80 on tumors harvested from mice treated with indicated mAbs. c, Quantification of percent of positive F4/80 staining obtained from IHC analysis. Shown are mean values +/− s.e.m. of 4–5 biologic replicates. Control vs. GD2+CD47 p = 0.0281, CD47 vs. GD2+CD47 p = 0.0415, GD2 vs. GD2+CD47 p = 0.2804. d, Quantification of percent of positive iNOS staining obtained from IHC analysis. Shown are mean values +/− s.e.m. of 4–5 biologic replicates. Control vs. GD2+CD47 p = 0.2401, CD47 vs. GD2+CD47 p = 0.413, GD2 vs. GD2+CD47 p = 0.7487. e-f, Flow cytometric analysis of M2 macrophages (defined as CD163+ and CD206+, gated on CD45+, CD11b+, F4/80 + macrophages) in CHLA255 tumors. e, Representative flow plots and f, quantification of M2 macrophages. Shown are mean values +/− s.e.m. of 4–5 biologic replicates. Control vs. GD2+CD47 p = 0.0218, CD47 vs. GD2+CD47 p = 0.9999, GD2 vs. GD2+CD47 p = 0.7102. b-f, Experiment was performed one time. All statistical comparisons were made between groups with the one-way ANOVA with correction for multiple comparisons correction, *P < 0.05, **P < 0.01, ***P < 0.001, ****P < 0.0001, ns P>0.05.
Extended Data Fig. 9 |
Extended Data Fig. 9 |. GD2 antigen density may determine response to anti-GD2/anti-CD47.
a, Expression levels of CD47 mRNA in samples from three different datasets of primary tumors from high-risk, stage 4 neuroblastoma stratified by MYCN status (amplified vs non-amplified), age at diagnosis, and ploidy (where available). b, Expression levels of CD163, CD86, and SIGLEC7, together with CD47 and MYCN in samples from the same databases as in a grouped based on MYCN amplification status. c-d, Expression levels of CD47 and MYC family genes in samples from osteosarcoma c or SCLC d primary tumors. Samples are stratified based on high or low expression of any of the three MYC family genes: MYC, MYCL or MYCN. Dot plots represent log2 (a-c) or TPM (d) expression values. Error bars represent median ± s.d. Differences in gene expression levels between groups were calculated using the Mann-Whitney U test (unpaired, two-sided). e, Flow cytometric analysis of the expression of GD2 (top) and CD47 (bottom) on tumor cell lines used in in vivo models. f, Flow cytometric analysis of the expression of GD2 (top) and CD47 (bottom) on isogenic SH-SY5Y neuroblastoma GD2-low and GD2-high cell lines. g, Graphs show flow cytometry-based quantification of phagocytosis of SY5Y-GD2-low and SY5Y-GD2-high neuroblastoma cell lines co-cultured with human blood derived macrophages in the presence of anti-GD2 mAb, anti-CD47 mAb or dual treatment, compared with untreated control; results normalized to the phagocytosis in the untreated (UT) control for each cell line and blood donor. Shown are mean values +/− s.d. of three experimental replicates. SY5Y-GD2-high-UT vs. SY5Y-GD2-low-UT p>0.9999, SY5Y-GD2-high-GD2-treated vs. SY5Y-GD2-low-GD2-treated p = 5.1941E-07, SY5Y-GD2-high-CD47-treated vs. SY5Y-GD2-low-CD47-treated p = 0.5091, SY5Y-GD2-high-GD2+CD47-treated vs. SY5Y-GD2-low-GD2+CD47-treated p = 9.8567E-07. Representative data from two experiments performed with two different blood donors. Statistical comparisons performed with one-way ANOVA with multiple comparisons correction, *P < 0.05, **P < 0.01, ***P < 0.001, ****P < 0.0001, ns P>0.05.
Fig. 1 |
Fig. 1 |. Anti-CD47 and anti-GD2 synergize to mediate anti-tumor activity in xenograft models of neuroblastoma.
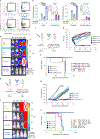
a, Representative flow cytometry plots depicting the phagocytosis of CFSE-labeled KCNR cells co-cultured with human-blood-derived macrophages in the presence or absence of anti-GD2 mAb, anti-CD47 mAb or dual treatment. b, Graphs show flow-cytometry-based quantification of phagocytosis of neuroblastoma cell lines in the presence of anti-GD2 mAb, anti-CD47 mAb or dual treatment, compared to untreated control; results normalized to the phagocytosis in the untreated control for each cell line and blood donor. Shown are mean ± s.d. of three experimental replicates. Statistical comparisons were performed with one-way ANOVA with multiple comparison correction, ****P < 0.0001. KCNR: control versus anti-GD2 and anti-CD47, P = 2.4 × 10⁻¹⁴, anti-GD2 versus anti-GD2 and anti-CD47, P = 5.7452 × 10⁻¹¹, anti-CD47 versus anti-GD2 and anti-CD47, P = 3.66 × 10⁻¹³; CHLA255: control versus anti-GD2 and anti-CD47, P = 1.8 × 10⁻¹⁴, anti-GD2 versus anti-GD2 and anti-CD47, P = 1.43 × 10⁻¹³, anti-CD47 versus anti-GD2 and anti-CD47, P = 1.8 × 10⁻¹⁴. Inset: flow histograms show surface GD2 expression on neuroblastoma cell lines used for each assay, blue: wild-type line, gray: GD2 KO (B4GALNT1 KO) line. a, b, Representative data from at least three experiments performed with three different blood donors. c, Experimental overview of the orthotopic neuroblastoma model. d, Quantification of tumor progression for each individual mouse as measured by flux values acquired via BLI photometry. e, BLI images of representative mice from each treatment group shown in d at different time points. Red cross indicates deceased mouse. f, Survival curves for mice bearing tumors shown in d. Survival curves were compared using the log-rank test (two-tailed). d–f are representative of two independent experiments. n = 5 (anti-GD2 mAb, anti-CD47 mAb, anti-GD2/anti-CD47) and n = 4 (IgG control) mice per experiment. g, Experimental overview of the metastatic neuroblastoma model. h, Quantification of tumor progression for each individual mouse as measured by flux values acquired via BLI photometry. i, BLI images of representative mice from each treatment group shown in h at different time points. Red cross indicates deceased mouse. j, Survival curves for mice bearing tumors shown in h. Survival curves were compared using the log-rank test (two-tailed). h–j are representative of four independent experiments. n = 5 per group in each experiment. APC, allophycocyanin; FITC, fluorescein isothiocyanate; i.p., intraperitoneally; mAb, monoclonal antibody.
Fig. 2 |
Fig. 2 |. CD47 blockade licenses TAMs to enhance the activity of anti-GD2 in a syngeneic model of neuroblastoma.
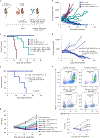
a, Experimental overview of the syngeneic model of neuroblastoma. One million cells from de novo tumors from TH-MYCN mice were harvested and injected subcutaneously into the flank of 129X1/SvJ mice. Once tumors reached a volume of ~700 mm3, mice were injected with anti-GD2 mAb (14G2a), CD47 blocker (ALX301) or dual anti-GD2/CD47 blocker treatment twice a week for 3 weeks. b, Tumor progression for each individual mouse was followed using caliper measurements of tumor dimensions. c, Survival curves for mice bearing tumors shown in b. Survival curves were compared using the log-rank test (two-tailed). Data for a–c are are from two pooled experiments with n = 7 (anti-CD47, anti-GD2/anti-CD47) and n = 8 (anti-GD2) mice per group. d, Mice received clodronate liposomes and anti-CSF1R mAb or no depletion alongside anti-GD2/CD47 blocker. Tumor progression for each individual mouse was followed using caliper measurements of tumor dimensions. e, Survival curves for mice from d. Survival curves were compared using the log-rank test (two-tailed). n = 4 mice per group. f, g, Mice treated with anti-Ly6G mAb were enrolled into the metastatic model of neuroblastoma as in Fig. 1g. f, Flow cytometry showing depletion of granulocytes in blood samples from mice treated with anti-Ly6G (bottom) versus control mice (top). g, Quantification of tumor progression for each individual mouse (left) as well as mean ± s.e.m. per treatment group (right) as measured by flux values acquired via BLI photometry. Statistical comparisons were made between Ly6G depleted and non-depleted groups using repeated-measures two-way ANOVA (NS denotes not significant, P > 0.05). The experiment was performed one time with n = 5 mice per group. i.p., intraperitoneally; mAb, monoclonal antibody.
Fig. 3 |
Fig. 3 |. Absence of neurotoxicity related to combined anti-GD2 and anti-CD47 treatment.
a, Non-tumor-bearing 129X1/SvJ mice were treated with anti-GD2 (14G2a), CD47 blocker (ALX301) or the combination of anti-GD2 (14G2a) and CD47 blocker (ALX301) for a total of three doses, and percent weight change during antibody treatment was recorded. Data shown are mean ± s.e.m. be, Mice performed CatWalk gait analysis at indicated time points, and swing speed (c), stride length (d) and regularity index (e) were measured. Data shown are mean ± s.e.m. f, H&E-stained sections of all examined organs were within normal limits as assessed by bright-field microscopy. Shown are sections of cerebrum, cerebellum, peripheral nerve, heart, liver, kidney, spleen and lung of animals from different experimental groups: (1) control, (2) CD47 blocker (ALX301) treatment, (3) anti-GD2 (14G2a) antibody treatment and (4) combined CD47 blocker (ALX301)/anti-GD2 (14G2a) antibody treatment. Magnification: ×40; scale bars, 20 μm. af, The experiment was performed once with n = 5 mice per group.
Fig. 4 |
Fig. 4 |. Anti-GD2 blocks the interaction of GD2 with its ligand Siglec-7, an inhibitory immune receptor.
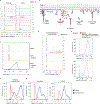
a, Flow cytometric histograms of CHLA255 and KCNR stained with recombinant human Siglecs. b, Experimental overview for the analysis of Siglec binding specificity to sialic-acid-stripped and GD2-coated Nalm6 cells. c, Flow cytometric histograms showing intensity of GD2 staining of Nalm6 cells (top), Nalm6 cells treated with sialidases (middle) and Nalm6 cells treated with sialidases and coated with GD2 (bottom). d, Flow cytometric histograms showing staining of Nalm6 cells pre-treated with sialidase and coated with GD2 as in b with each individual recombinant Siglec. e, Flow cytometric analysis of the expression of GD2 (top) and Siglec-7 ligands (bottom) on the surface of wild-type Nalm6 cells or Nalm6 cells transduced with lentiviral constructs expressing B4GALNT1 (GD2 synthase) and ST8SIA1 (GD3 synthase). f, Flow cytometric analysis of Siglec-7 binding to Nalm6 treated as in b before (control, blue) and after (red) incubation with anti-GD2 mAb. g, Flow cytometric analysis of Siglec-7 binding to neuroblastoma cell lines CHLA255 and KCNR before (control, blue) and after (red) incubation with anti-GD2 mAb. APC, allophycocyanin; mAb, monoclonal antibody.
Fig. 5 |
Fig. 5 |. Anti-GD2 antibody primes neuroblastoma cells for removal by the immune system.
a, Graph shows flow-based quantification of cell viability after incubation with anti-GD2 for 12 h normalized to the untreated control. Data shown are the mean ± s.d. of six experimental replicates. Statistical comparisons were performed with the unpaired t-test. CHLA255 P = 1.2983 × 10⁻¹¹, CHLA255-GD2KO P = 0.4125, KCNR P = 1.1405 × 10⁻⁷, KCNR-GD2 KO P = 0.3223. b, Representative histograms of the expression of calreticulin on the surface of neuroblastoma cells after incubation with anti-GD2. c, Graph shows quantification of the expression of calreticulin (ΔMFI) on the surface of neuroblastoma cell lines treated as in a. Data shown are the mean ± s.d. of three experimental replicates. Statistical comparisons were performed with the unpaired t-test. CHLA255 P = 0.0002, CHLA255-GD2KO P = 0.9024, KCNR P = 0.0038, KCNR-GD2 KO P = 0.023. ac were performed three times. d, Proposed model of synergy of anti-GD2 and anti-CD47. At baseline, tumor cells express CD47 and GD2, which bind to SIRPα and Siglec-7, respectively, on the surface of the macrophage, both of which are ‘Don’t eat me’ signals that inhibit phagocytosis. Anti-GD2 blocks GD2:Siglec-7 interactions and induces export of calreticulin to the cell surface, upregulating an ‘Eat me’ signal. In the presence of anti-CD47, the balance of macrophage activity is shifted toward phagocytosis. e, Flow cytometric analysis of anti-GD2 and Fc-dead anti-GD2 mAb binding to GD2 on CHLA255 cells. Both antibodies were detected with a fluorophore-labeled secondary donkey anti-human IgG antibody. f, Flow cytometric detection of anti-GD2, but not Fc-dead anti-GD2, bound to CHLA255 cells detected with recombinant FcγRI-Dylight650. g, h, Metastatic neuroblastoma model as described in Fig. 1g. g, Quantification of tumor burden for individual mice on day 24 as measured by flux values acquired via BLI photometry. h, BLI images of representative mice from each treatment group shown in g. The experiment was performed one time. Data shown are mean ± s.e.m for n = 5 mice per group. Statistical comparisons performed with one-way ANOVA with multiple comparison correction. Fc-dead-GD2 versus control P = 1.52509 × 10⁻⁸, control versus Fc-active-GD2 P = 5.20468 × 10⁻⁹, Fc-dead-GD2 + CD47 versus control P = 1.20949 × 10⁻⁸, control versus Fc-active-GD2 + CD47 P = 3.96719 × 10⁻⁹, Fc-dead-GD2 versus Fc-active-GD2 P = 0.992 and Fc-dead-GD2 + CD47 versus Fc-active-GD2 + CD47 P > 0.999. *P < 0.05, **P < 0.01, ***P < 0.001, ****P < 0.0001 and NS P > 0.05. mAb, monoclonal antibody; NS, not significant.
Fig. 6 |
Fig. 6 |. Anti-CD47 and anti-GD2 elicit anti-tumor responses in models of osteosarcoma via TAM activation.
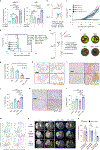
a, Quantification of phagocytosis of osteosarcoma cell normalized to phagocytosis in the untreated control. Data shown are mean ± s.d. of three experimental replicates. Statistical comparisons were performed with one-way-ANOVA with multiple comparison correction. MG63.3: control versus anti-GD2 P = 0.0283, control versus anti-CD47 P = 0.0007, control versus anti-GD2 and anti-CD47 P = 4.6064 × 10⁻⁷, anti-GD2 versus anti-GD2 and anti-CD47 P = 2.20048 × 10⁻⁵, anti-CD47 versus anti-GD2 and anti-CD47 P = 0.0004. 143b: control versus anti-GD2 P = 0.6849, control versus anti-CD47 P = 0.535, control versus anti-GD2 and anti-CD47 P = 0.0435, anti-GD2 versus anti-GD2 and anti-CD47 P = 0.0037, anti-CD47 versus anti-GD2 and anti-CD47 P = 0.0024. Representative data from three experiments performed with three blood donors. b, Experimental overview of the orthotopic model of osteosarcoma. c, Tumor progression for mice treated as in b. d, Survival curves for mice shown in c compared by log-rank test (two-tailed). b–d are representative of three independent experiments with n = 5 mice per group. e, Experimental overview of metastatic model of osteosarcoma. f, Representative images of GFP+ metastases in lungs from treated mice. g, Quantification of metastases from f. Data shown are mean ± s.e.m. of n = 4 biologic replicates. Statistical comparisons as in a. GD2 + CD47 versus CD47 P = 0.0286, GD2 + CD47 versus IgG P = 0.0286, GD2 + CD47 versus GD2 P = 0.0286. Representative of two independent experiments. h, Representative IHC images showing lung metastases. i–o Mice were treated with indicated antibodies for 7 d after tumors grew for 21 d. i, Representative IHC images showing detection of macrophages (anti-F4/80). j, Quantification of i. k, Representative IHC images showing staining with anti-iNOS. l, Quantification of k. j, l, Data are the mean ± s.e.m. of 4–5 biologic replicates. Statistical comparisons as in a. F4/80: IgG1 versus CD47 + GD2 P = 2.6746 × 10⁻⁷, CD47 versus CD47 + GD2 P = 1.0476 × 10⁻⁵, GD2 versus CD47 + GD2 P = 0.0020. iNOS: IgG1 versus CD47 + GD2 P = 0.0016, CD47 versus CD47 + GD2 P = 0.0025, GD2 versus CD47 + GD2 P = 0.1399. m, Representative flow plots of M2 macrophages (CD163+/CD206+). n, Representative magnetic resonance images of mouse tumors pre-treatment and post-treatment, before or 12 h after ferumoxytol. Arrows point to hypointense areas of iron-labeled macrophages. o, Quantification of T2* relaxation time from n. Data shown are mean ± s.e.m. of four biologic replicates. Statistical comparisons were made between groups with the Mann–Whitney test (unpaired, two-sided). Pre-contrast/pre-treatment P > 0.9999, pre-contrast/post-treatment P = 0.4127, post-contrast/post-treatment P = 0.0159. *P < 0.05, **P < 0.01, ***P < 0.001, ****P < 0.0001 and NS P > 0.05. i.p., intraperitoneally; NS, not significant.

References

    1. Schulz G et al. Detection of ganglioside GD2 in tumor tissues and sera of neuroblastoma patients. Cancer Res. 44, 5914–5920 (1984). - PubMed
    1. Long AH et al. Reduction of MDSCs with all-trans retinoic acid improves CAR therapy efficacy for sarcomas. Cancer Immunol. Res. 4, 869–880 (2016). - PMC - PubMed
    1. Dobrenkov K, Ostrovnaya I, Gu J, Cheung IY & Cheung NK Oncotargets GD2 and GD3 are highly expressed in sarcomas of children, adolescents, and young adults. Pediatr. Blood Cancer 63, 1780–1785 (2016). - PMC - PubMed
    1. Mount CW et al. Potent antitumor efficacy of anti-GD2 CAR T cells in H3-K27M+ diffuse midline gliomas. Nat. Med. 24, 572–579 (2018). - PMC - PubMed
    1. Cheresh DA, Rosenberg J, Mujoo K, Hirschowitz L & Reisfeld RA Biosynthesis and expression of the disialoganglioside GD2, a relevant target antigen on small cell lung carcinoma for monoclonal antibody-mediated cytolysis. Cancer Res. 46, 5112–5118 (1986). - PubMed

Publication types