. 2022 Feb;28(2):353-362.
doi: 10.1038/s41591-021-01623-z. Epub 2022 Jan 13.

T cell characteristics associated with toxicity to immune checkpoint blockade in patients with melanoma

Affiliations

T cell characteristics associated with toxicity to immune checkpoint blockade in patients with melanoma

Alexander X Lozano et al. Nat Med. 2022 Feb.

Abstract

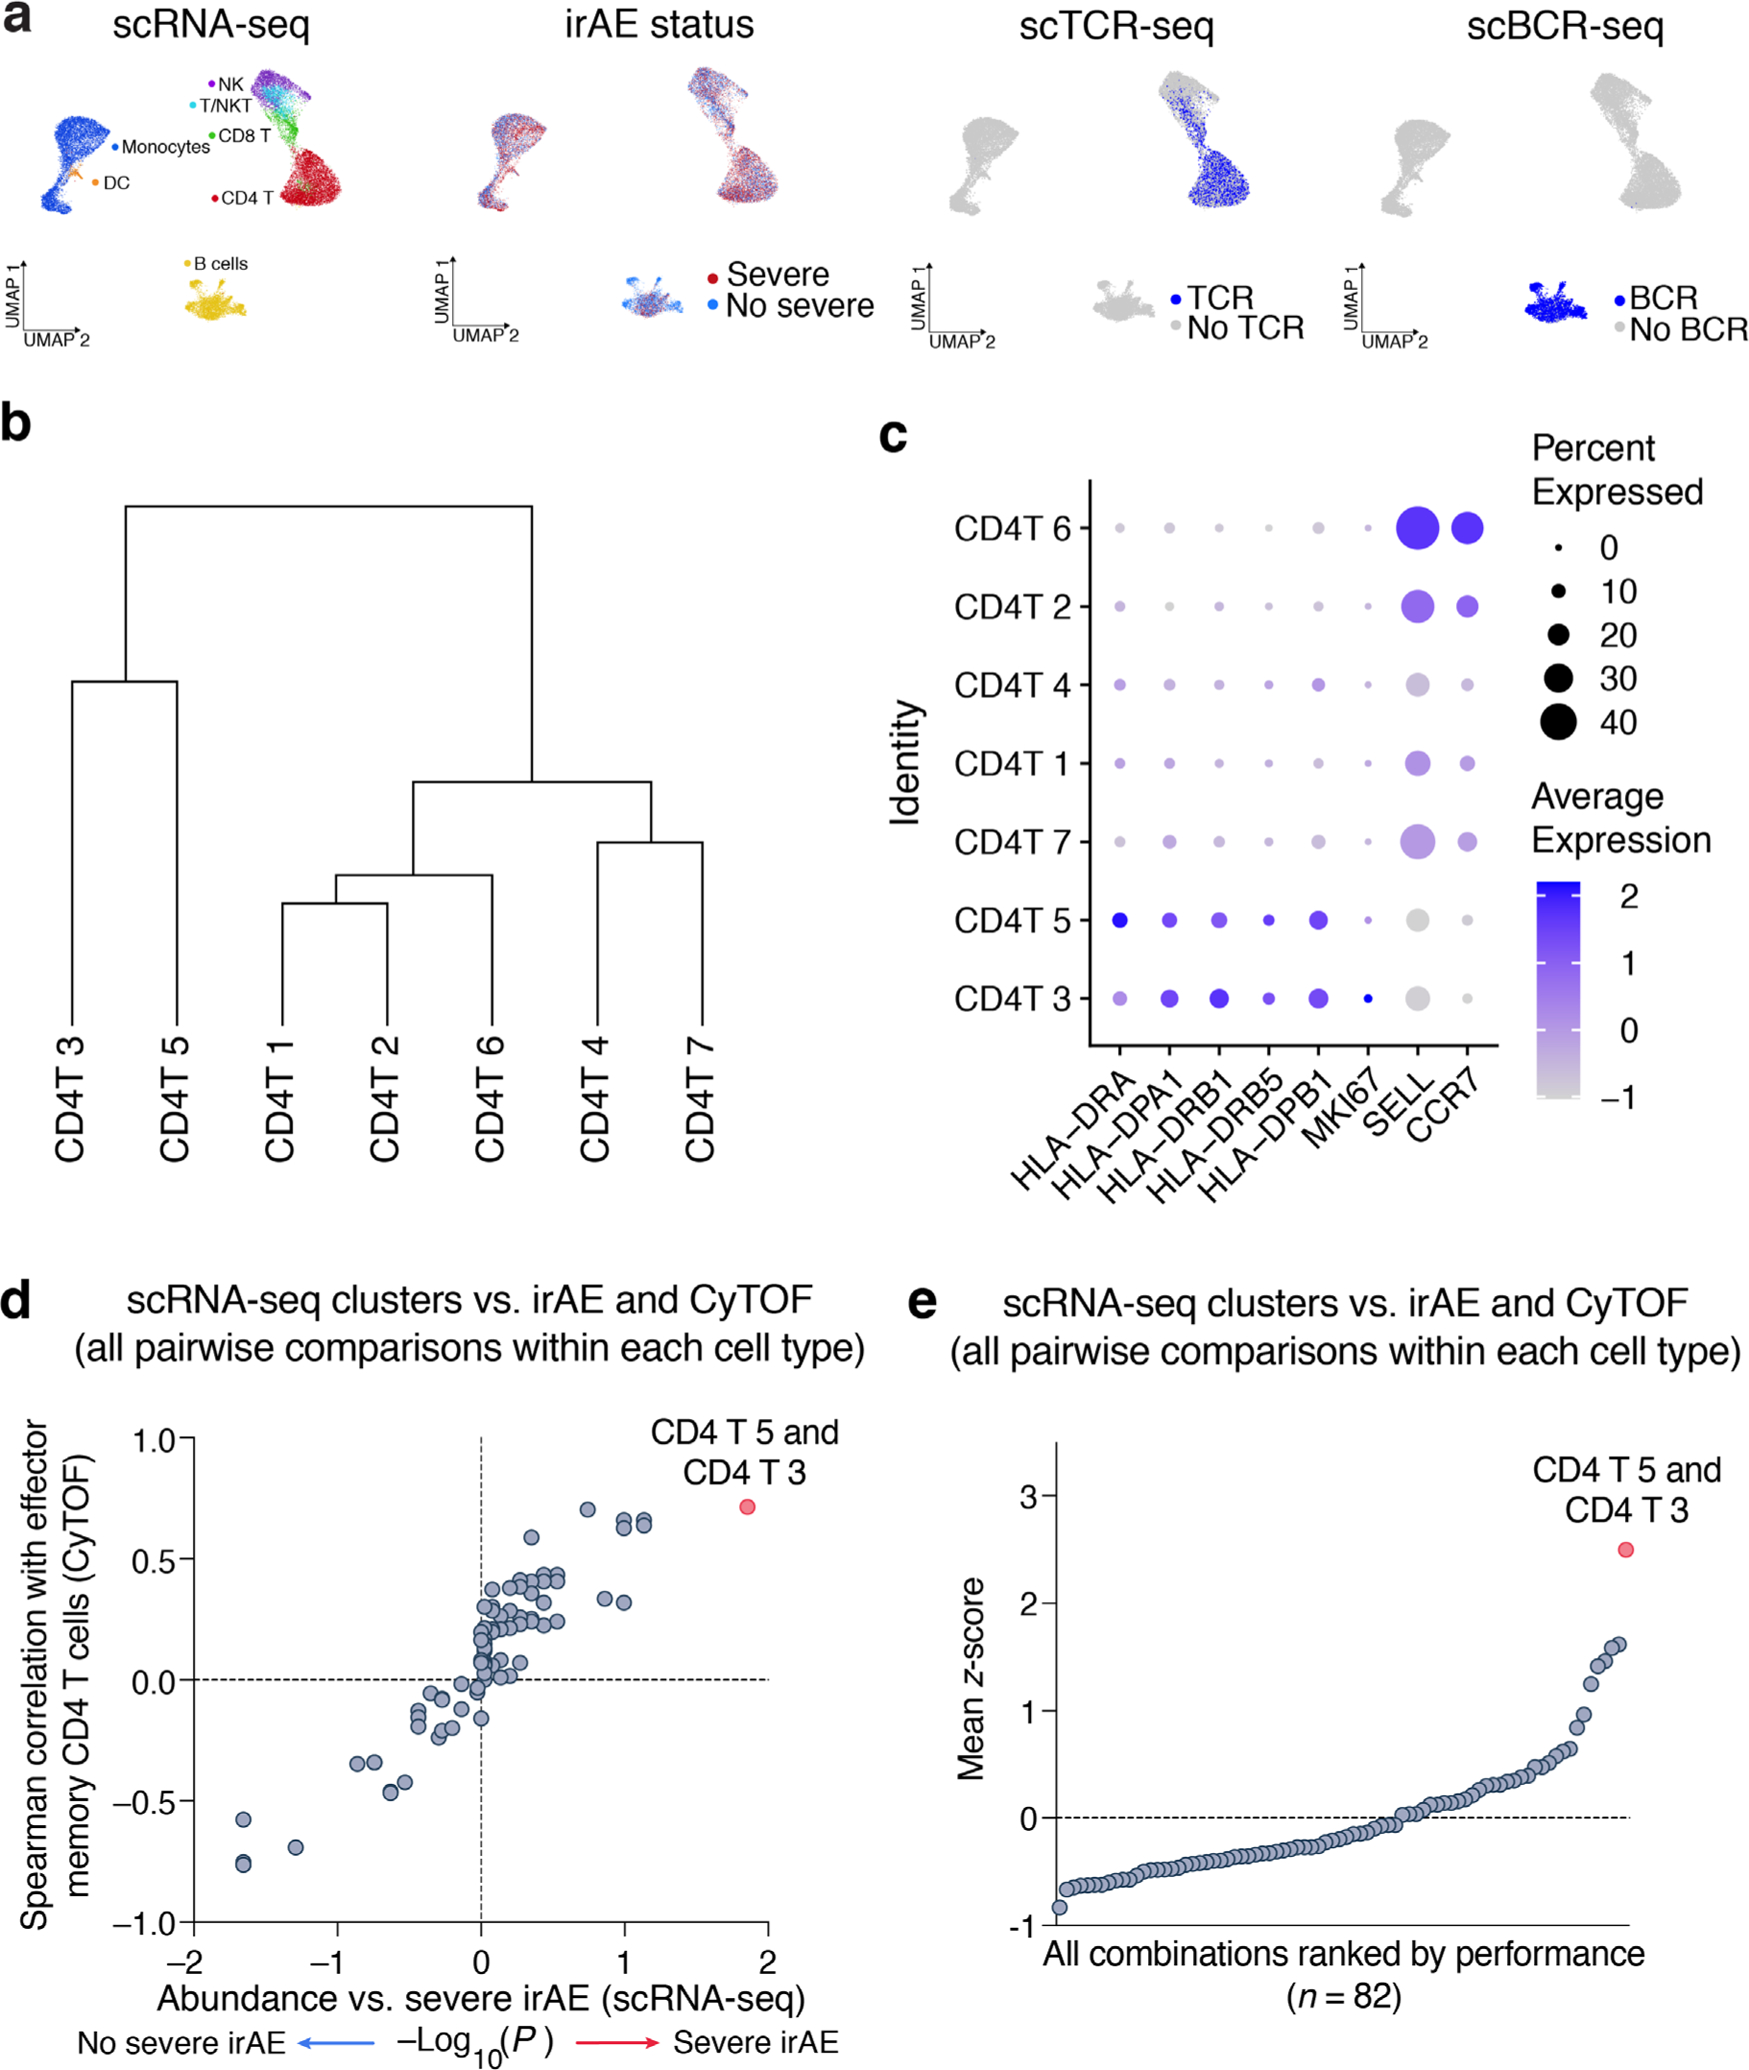
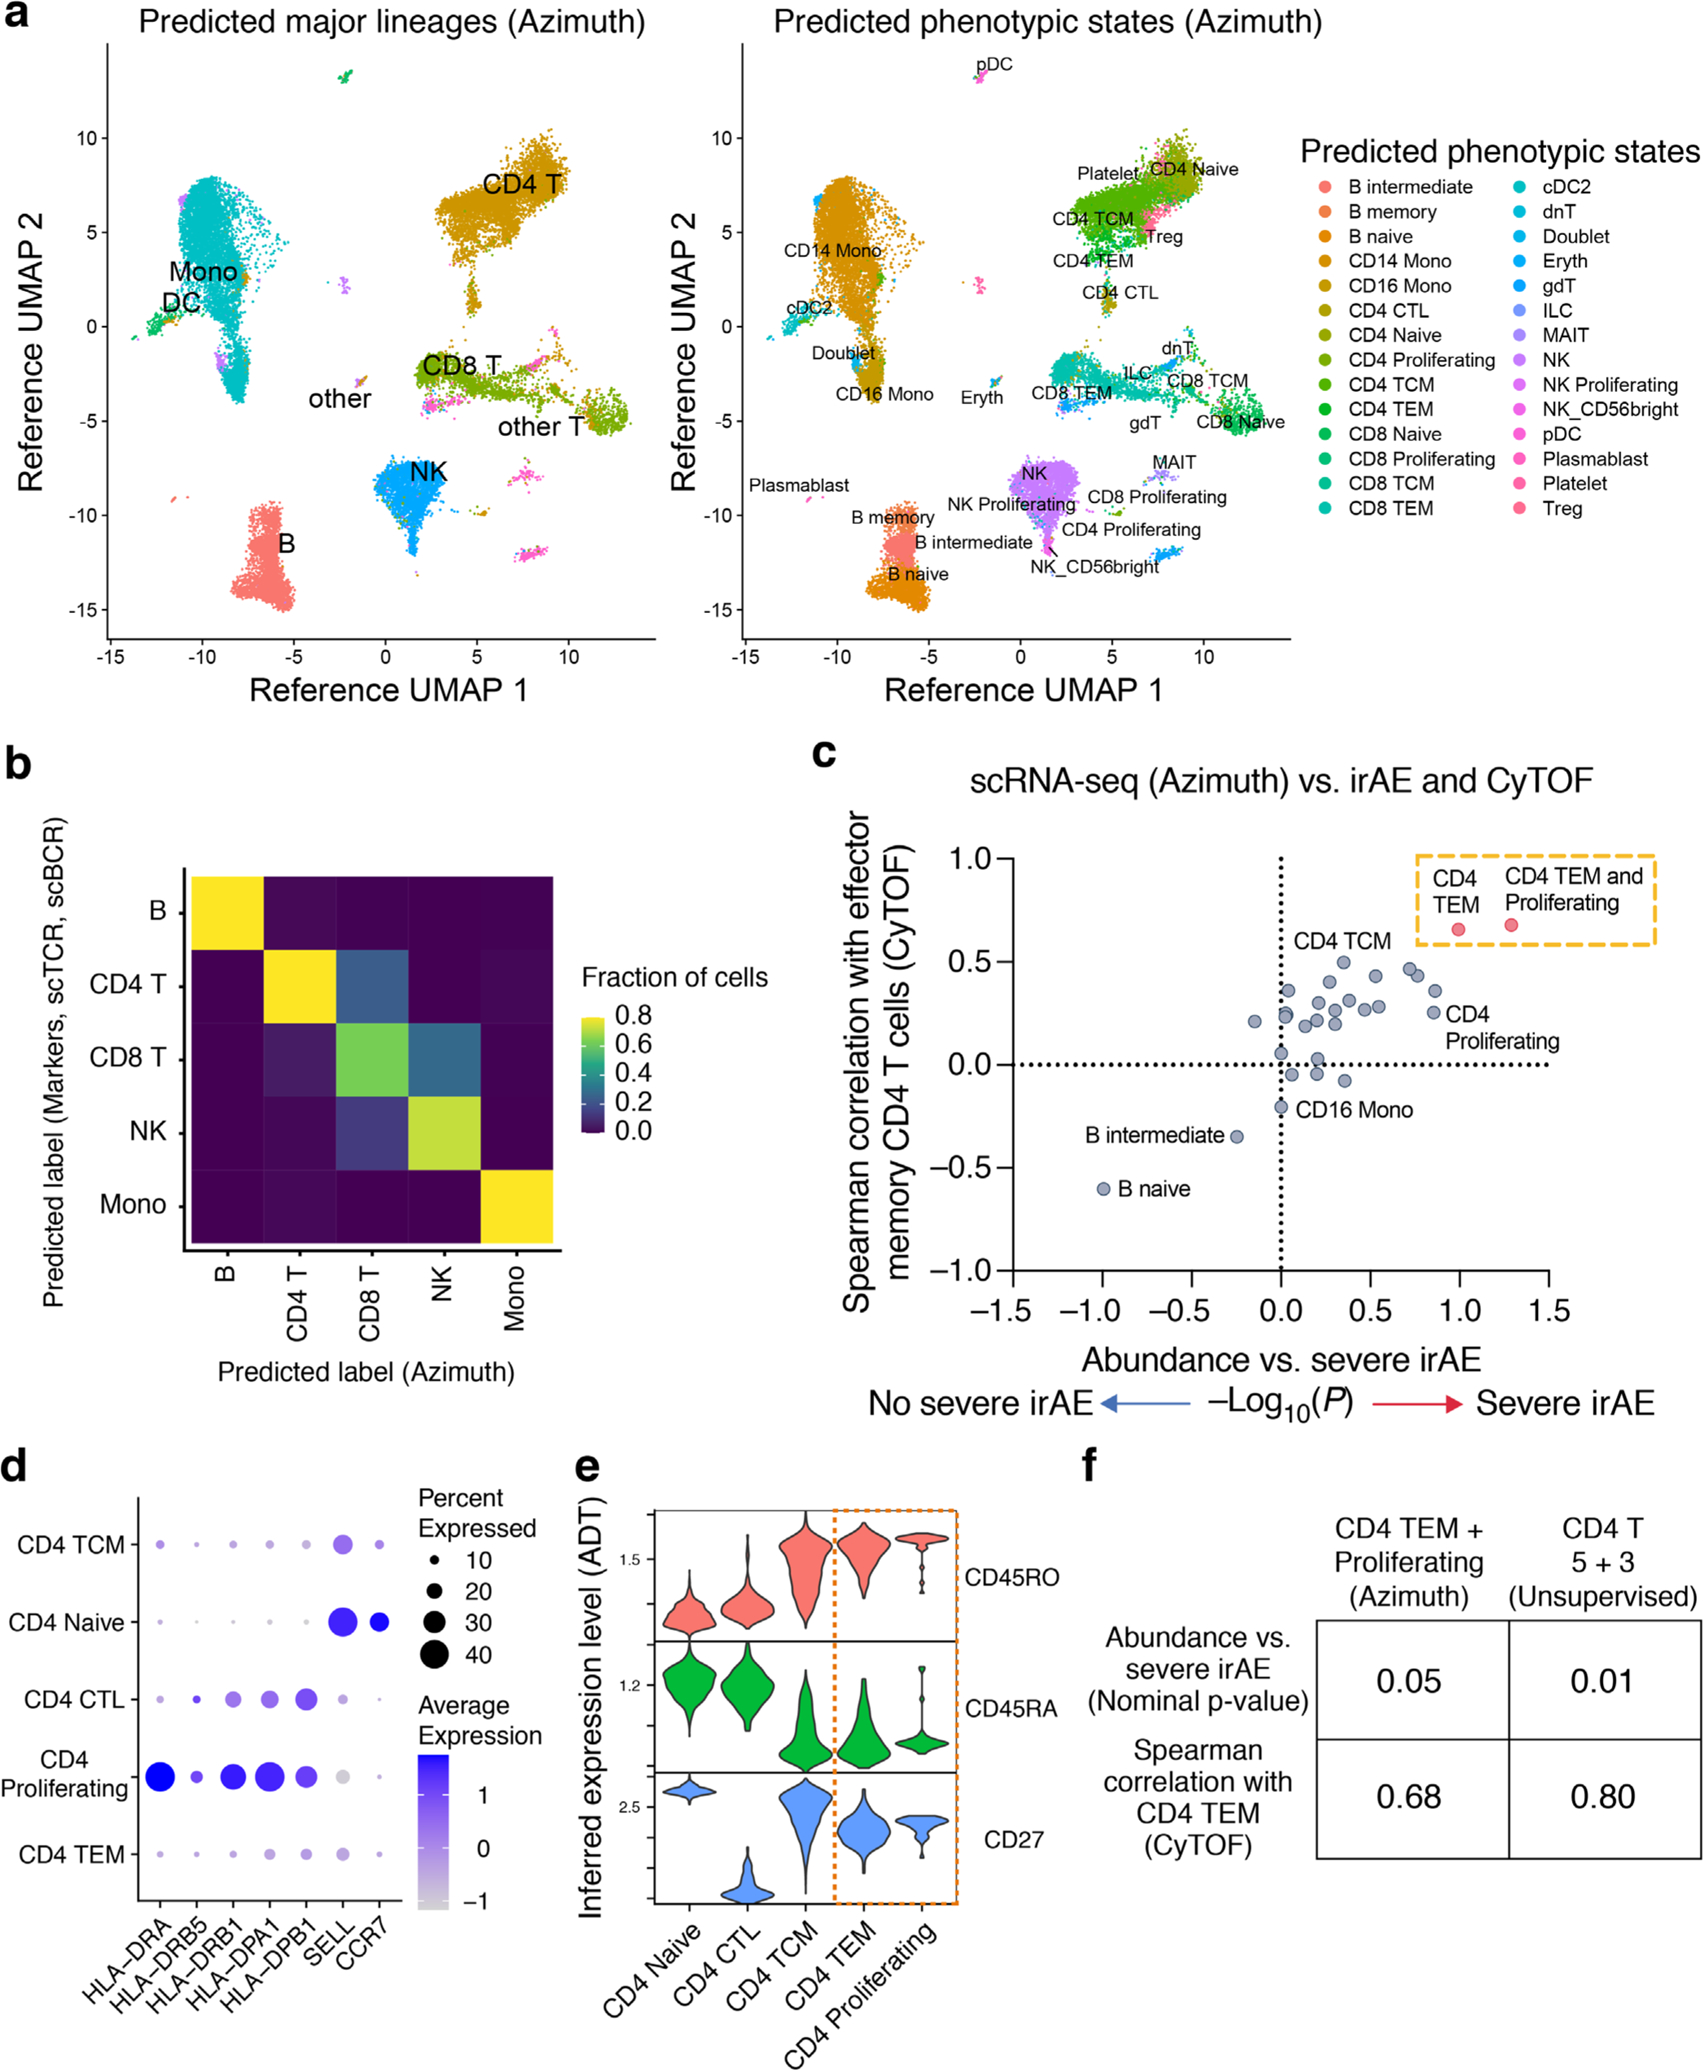
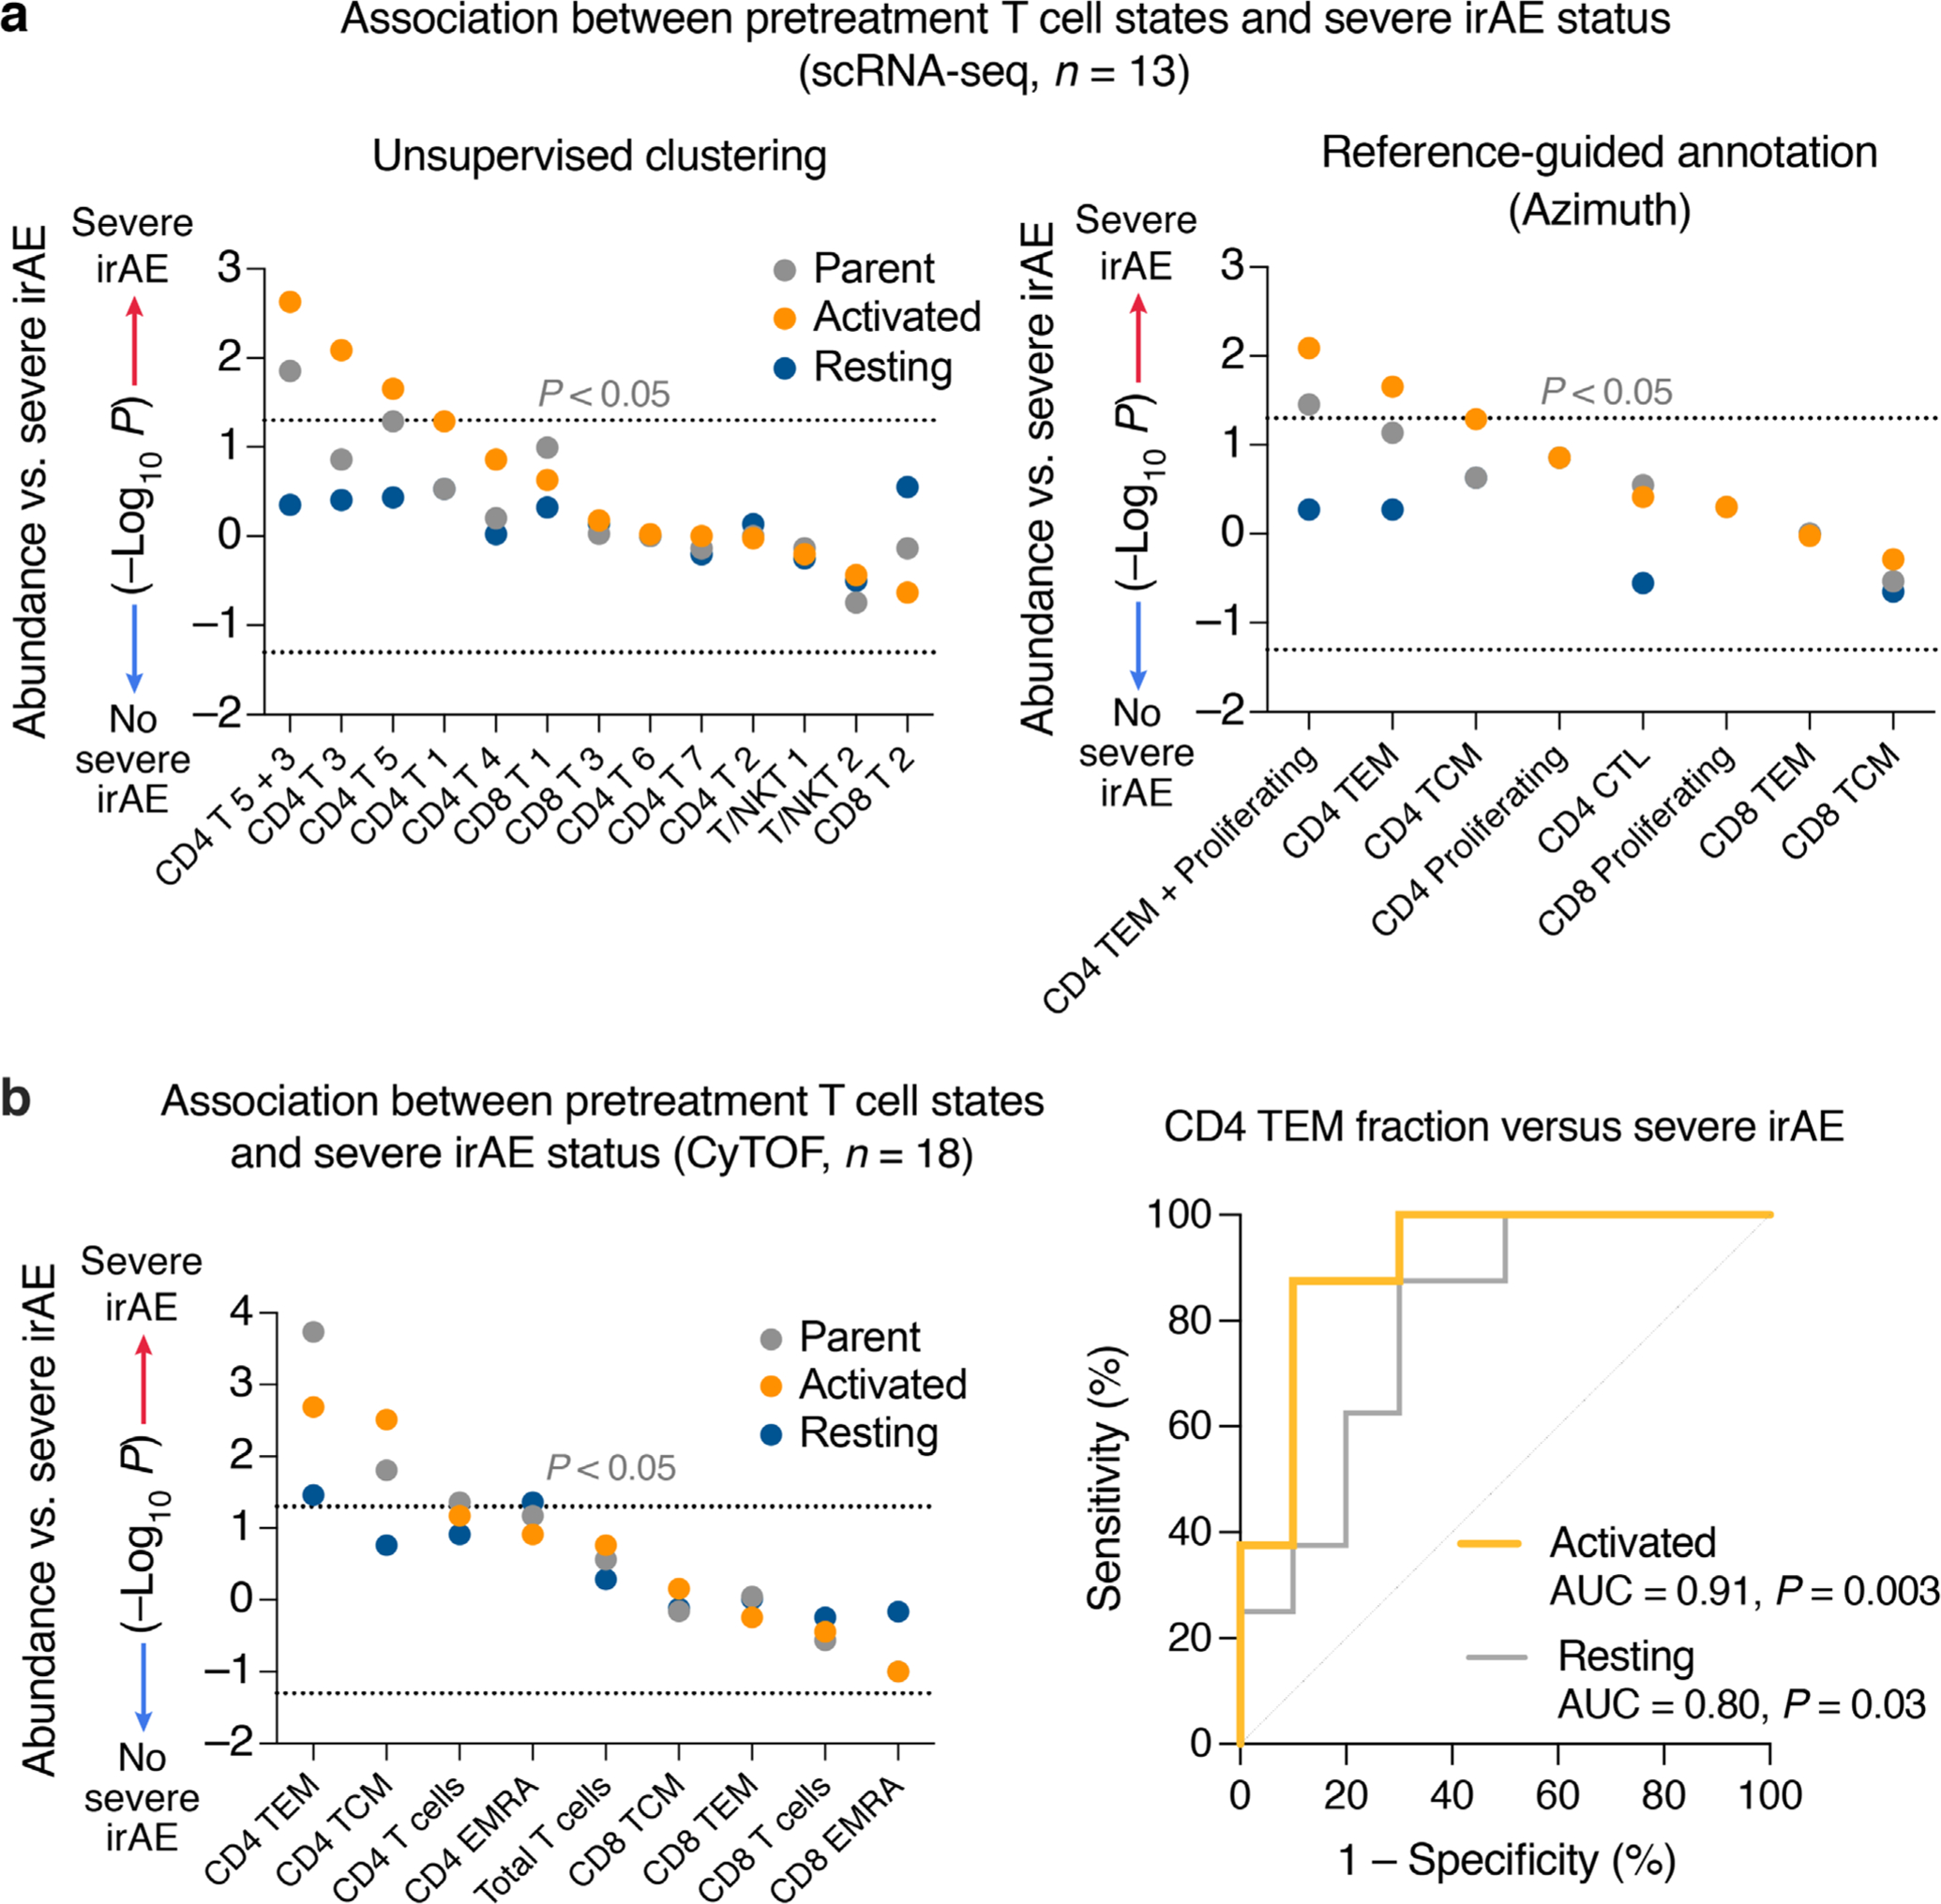
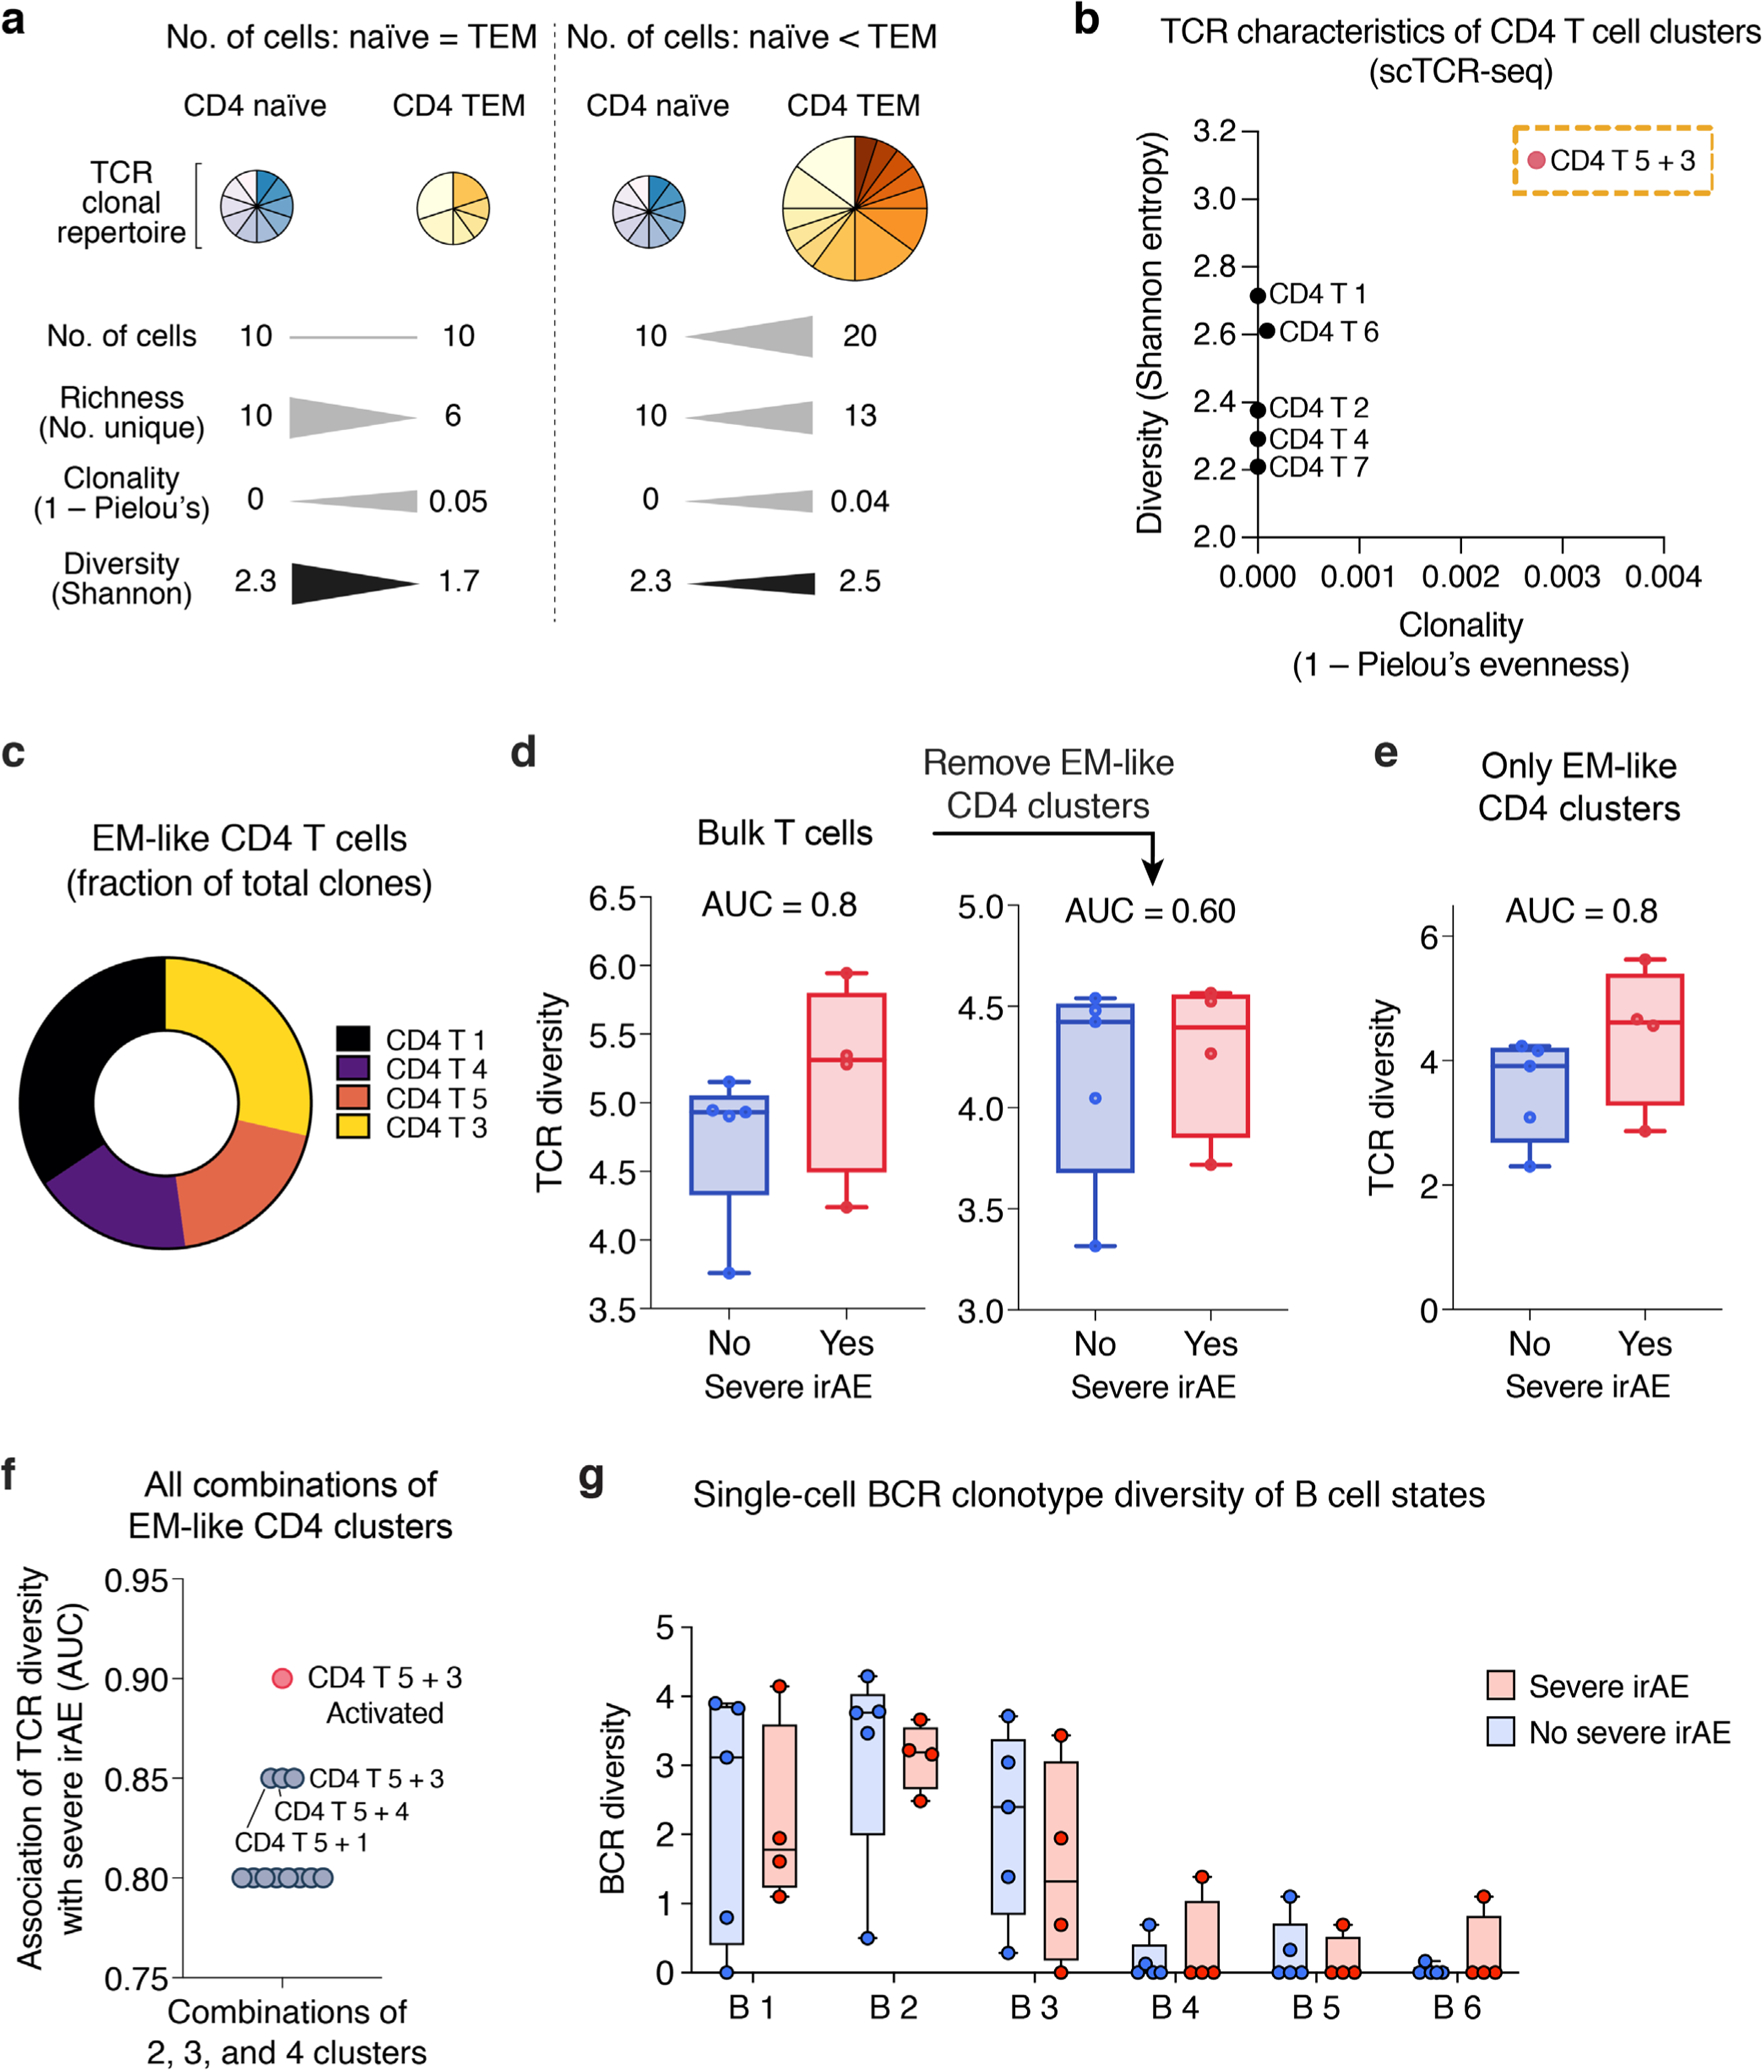
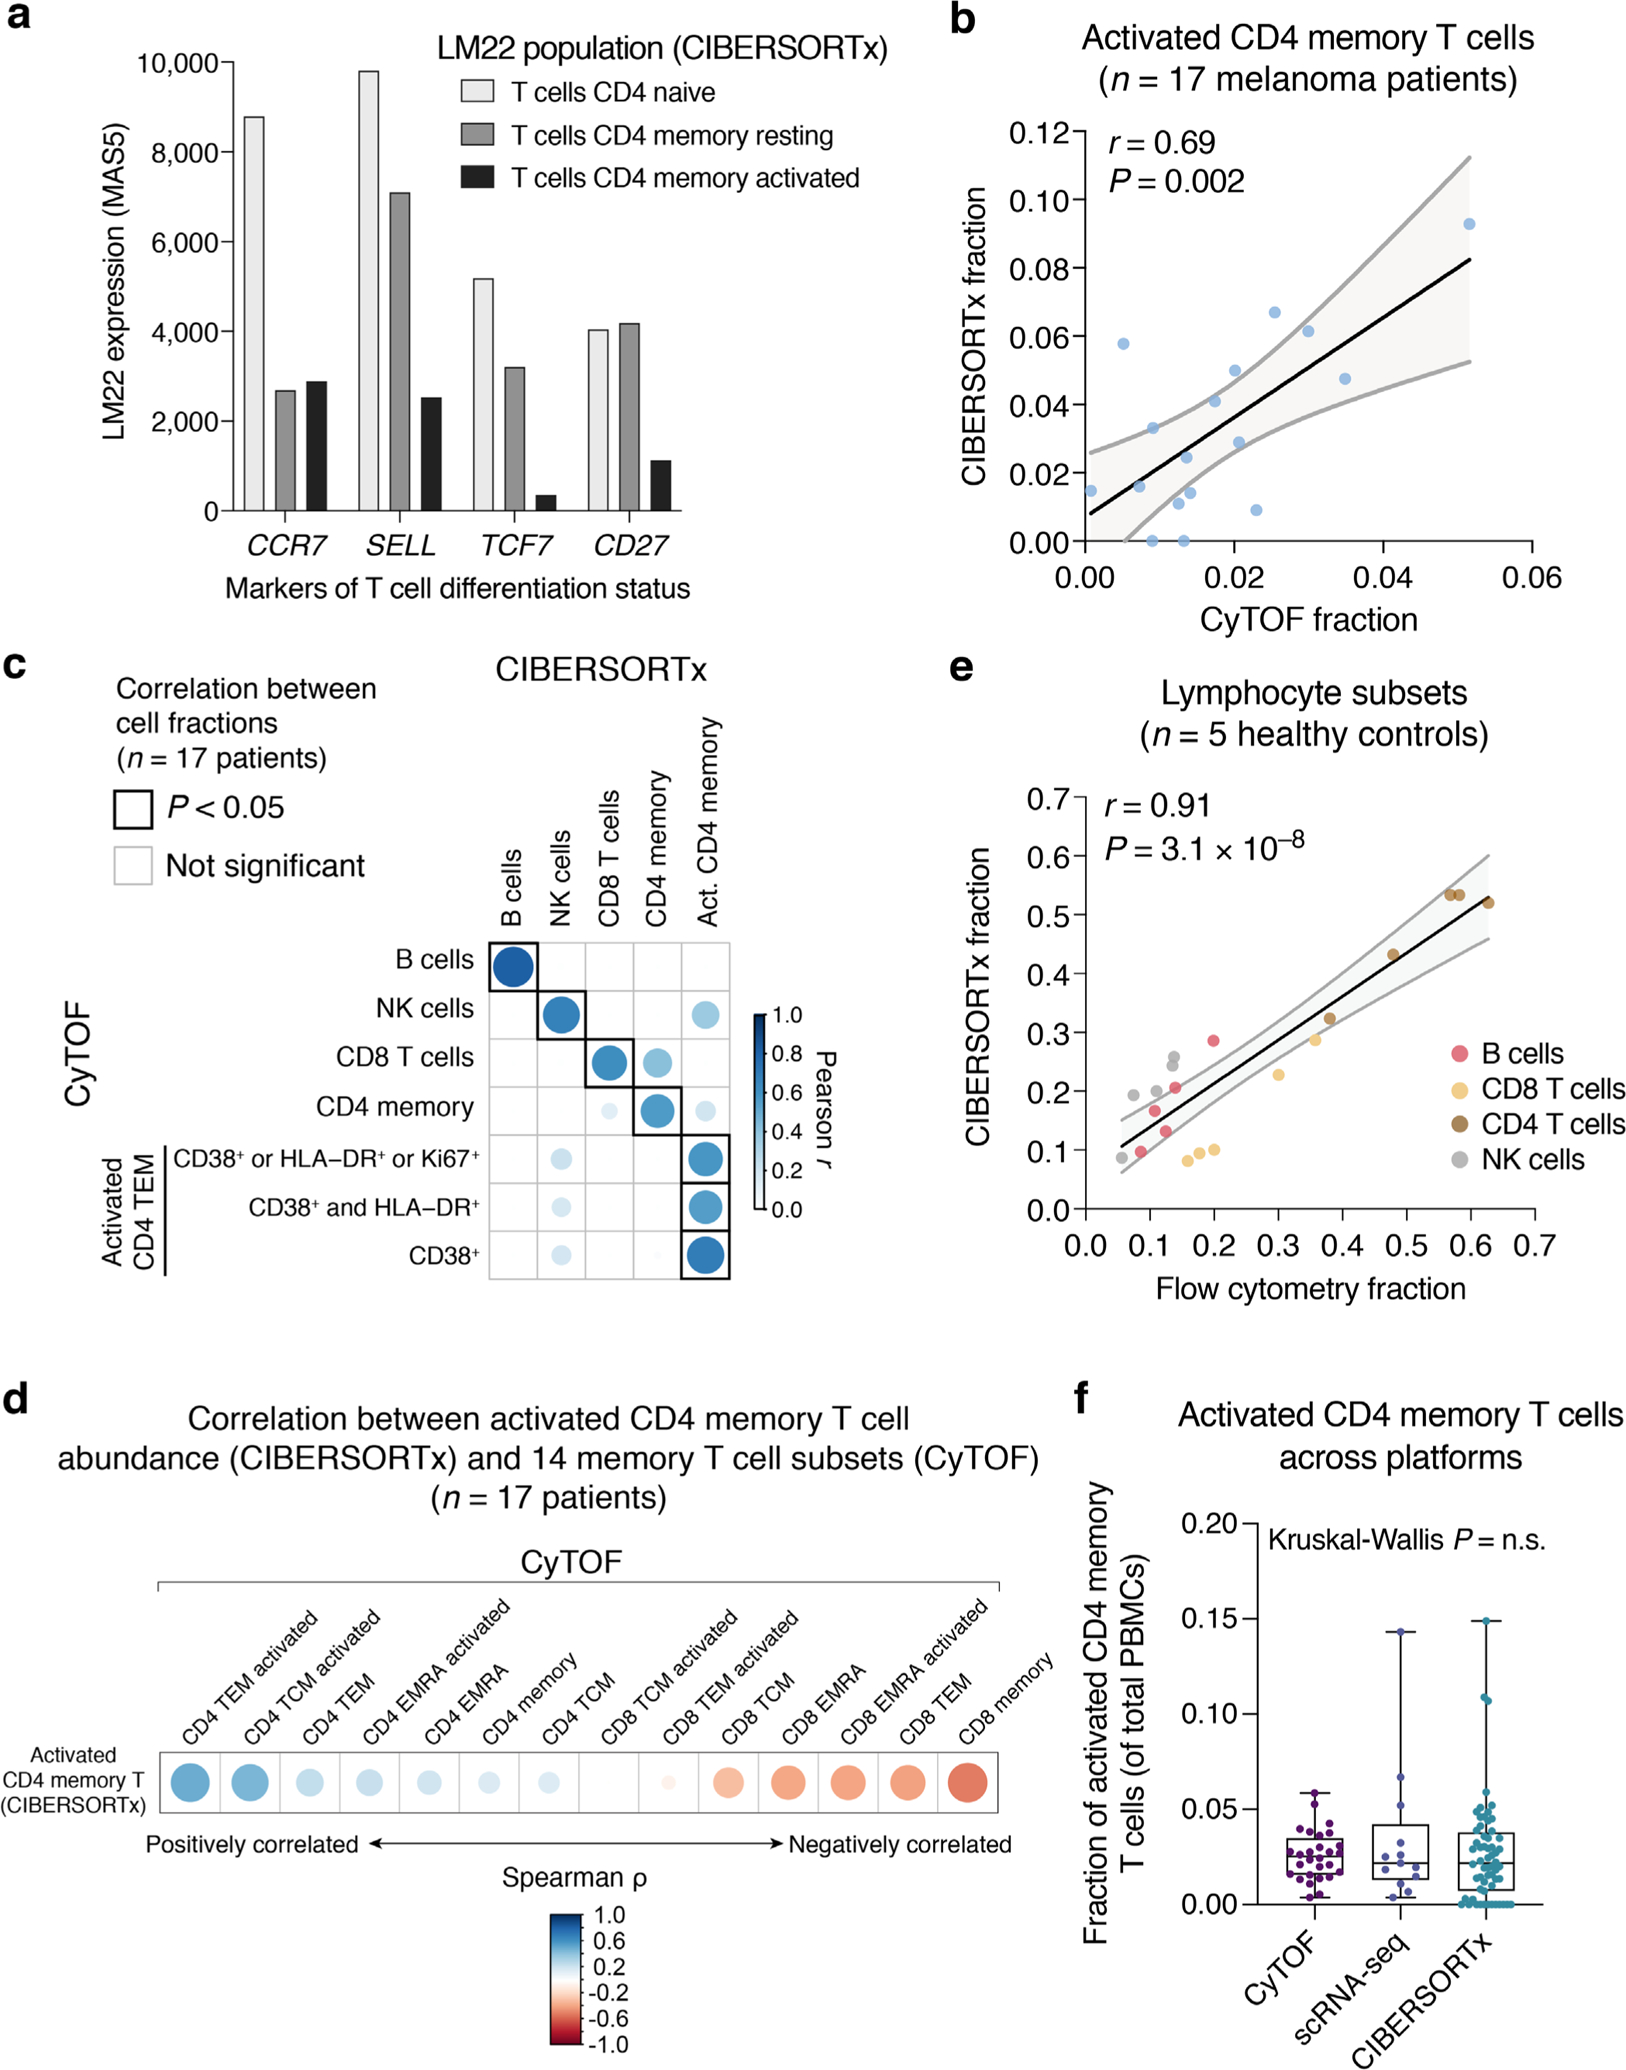
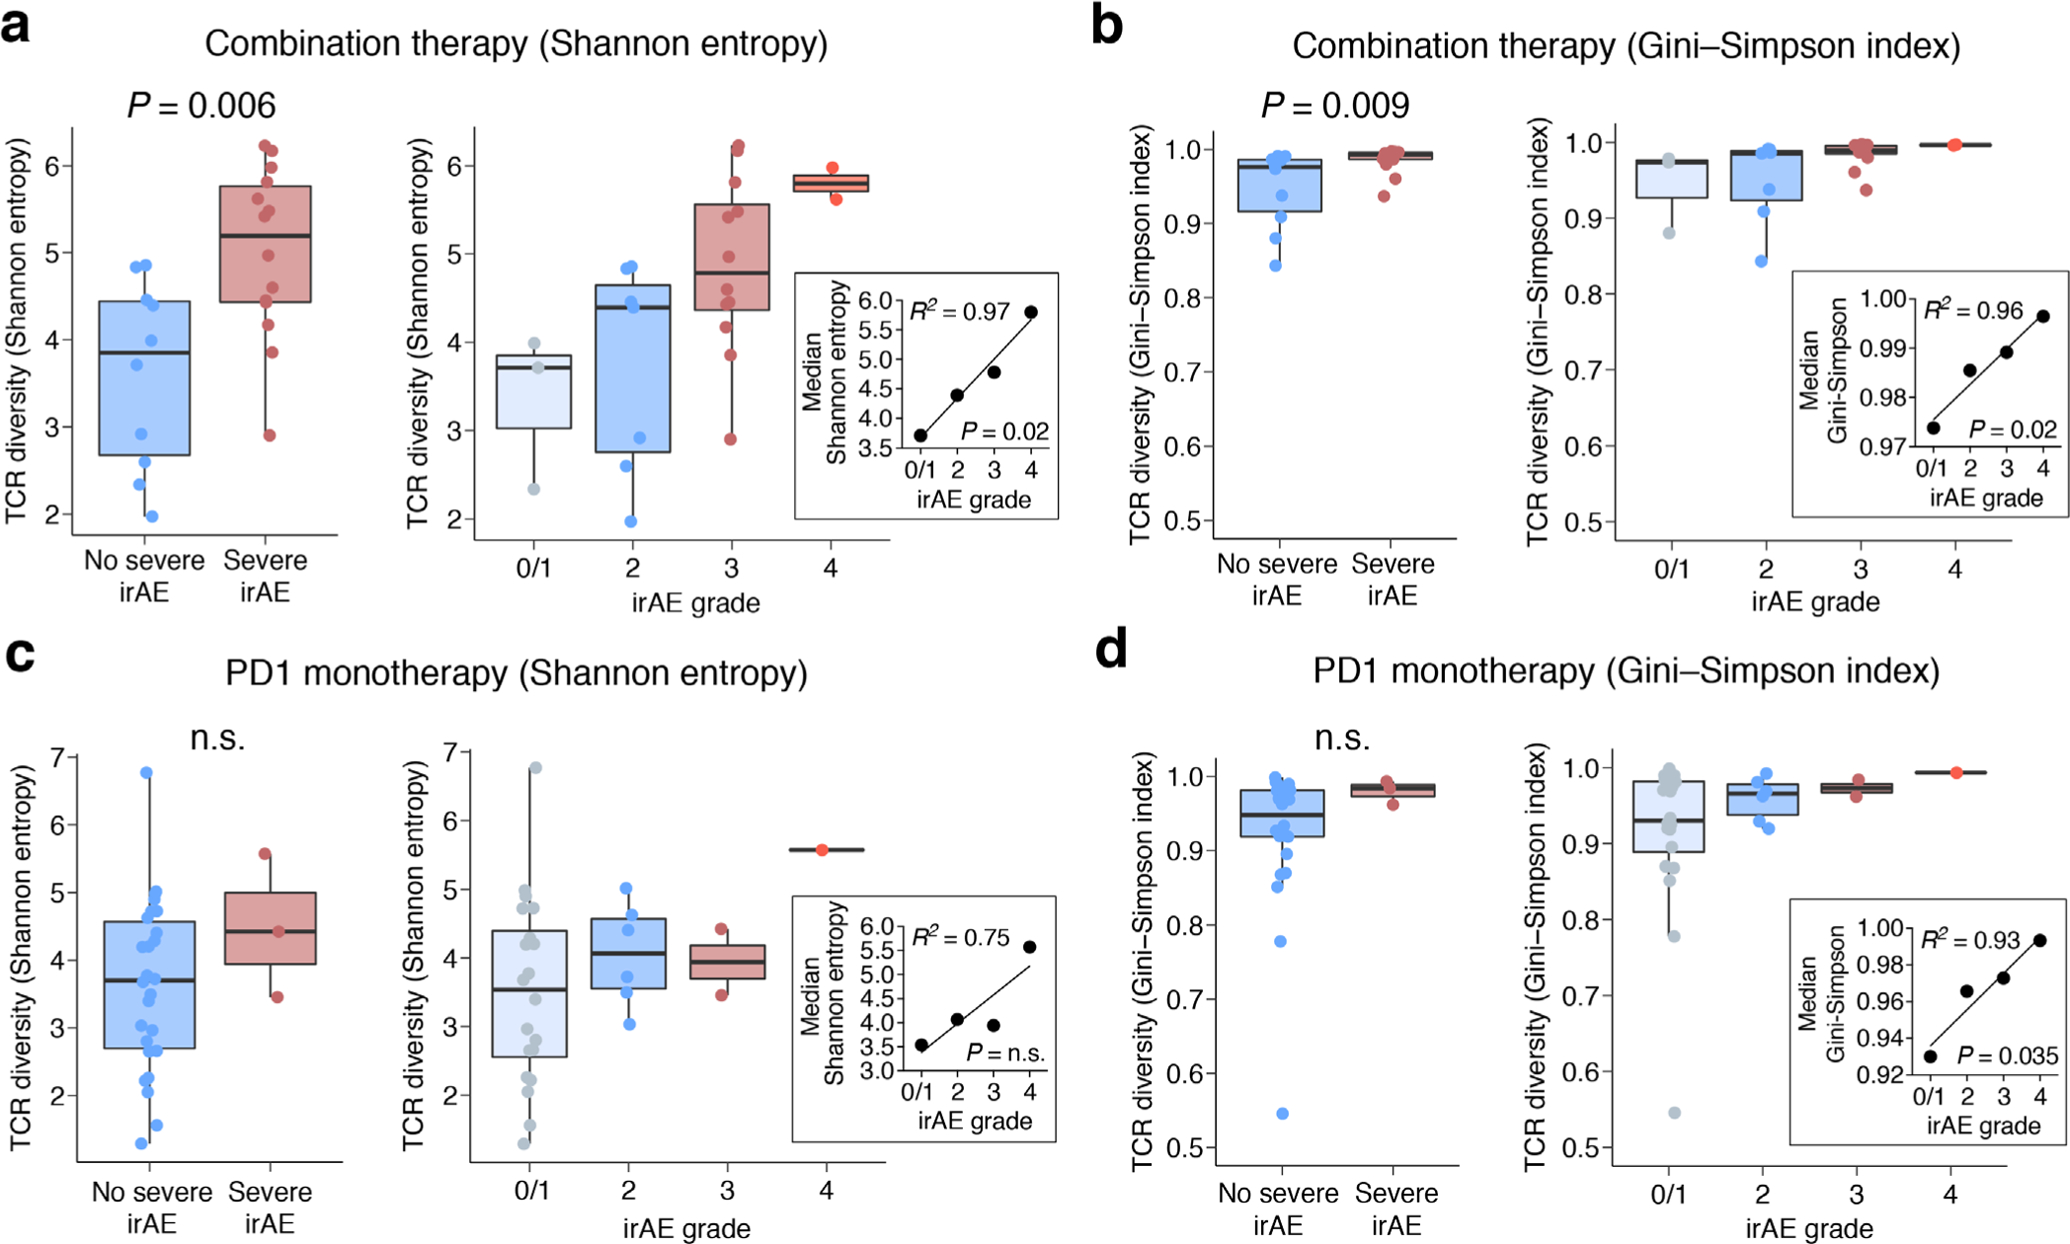
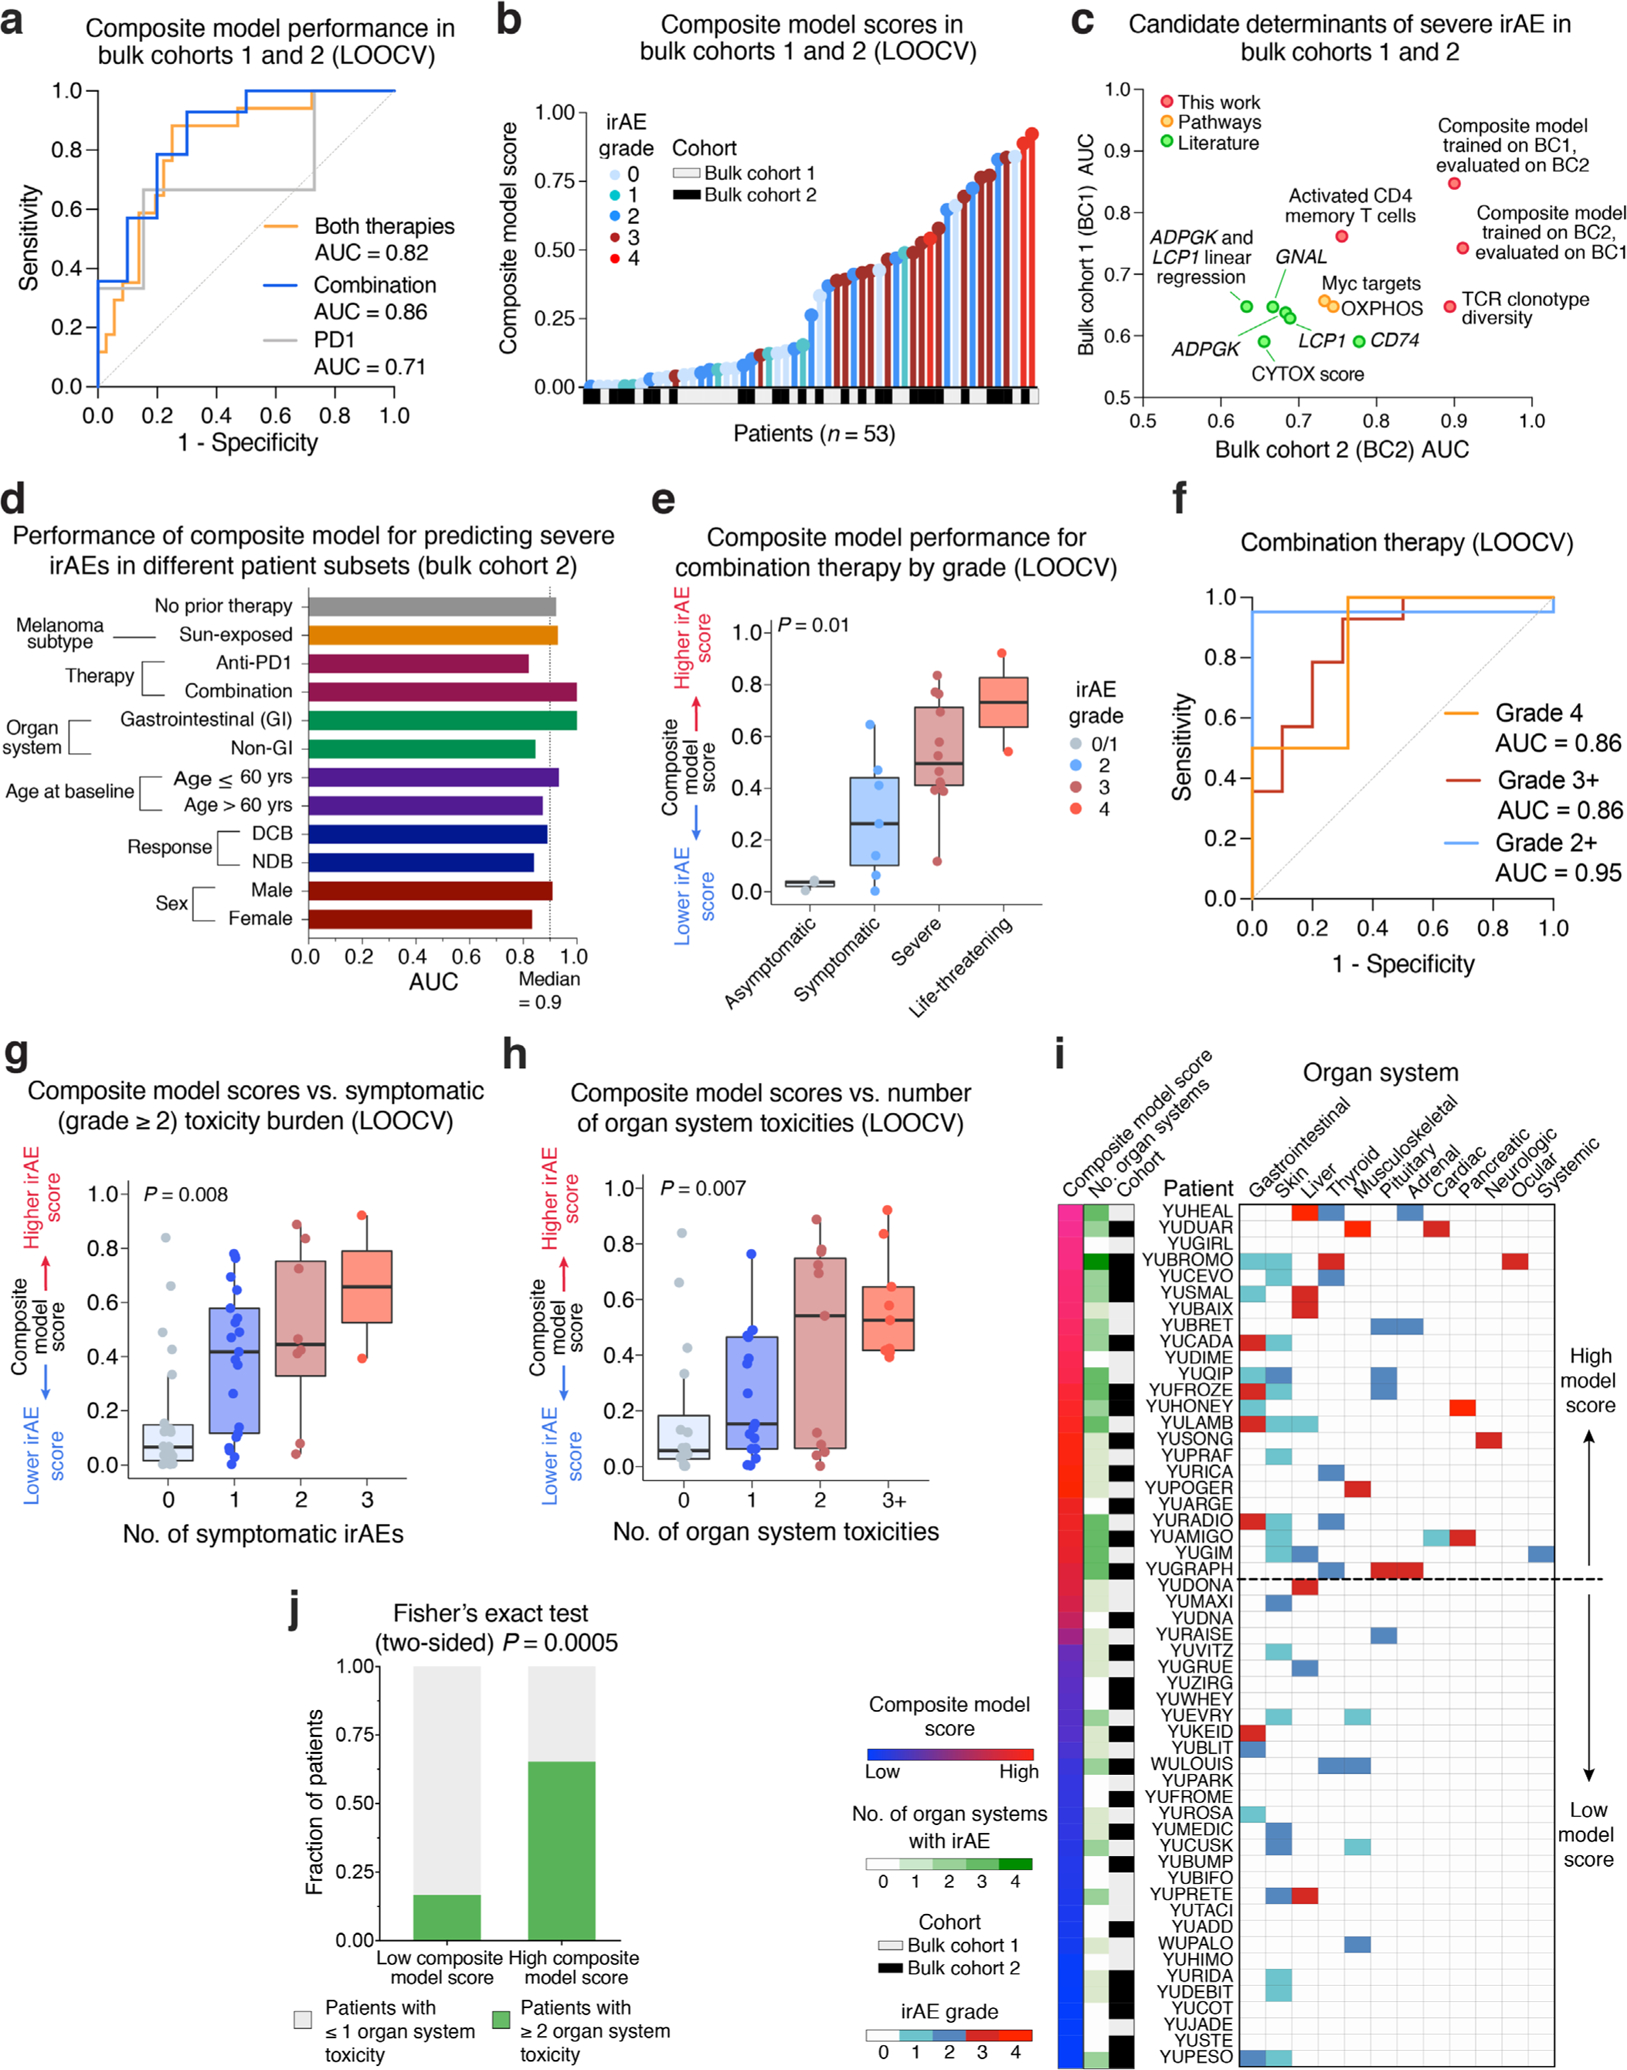
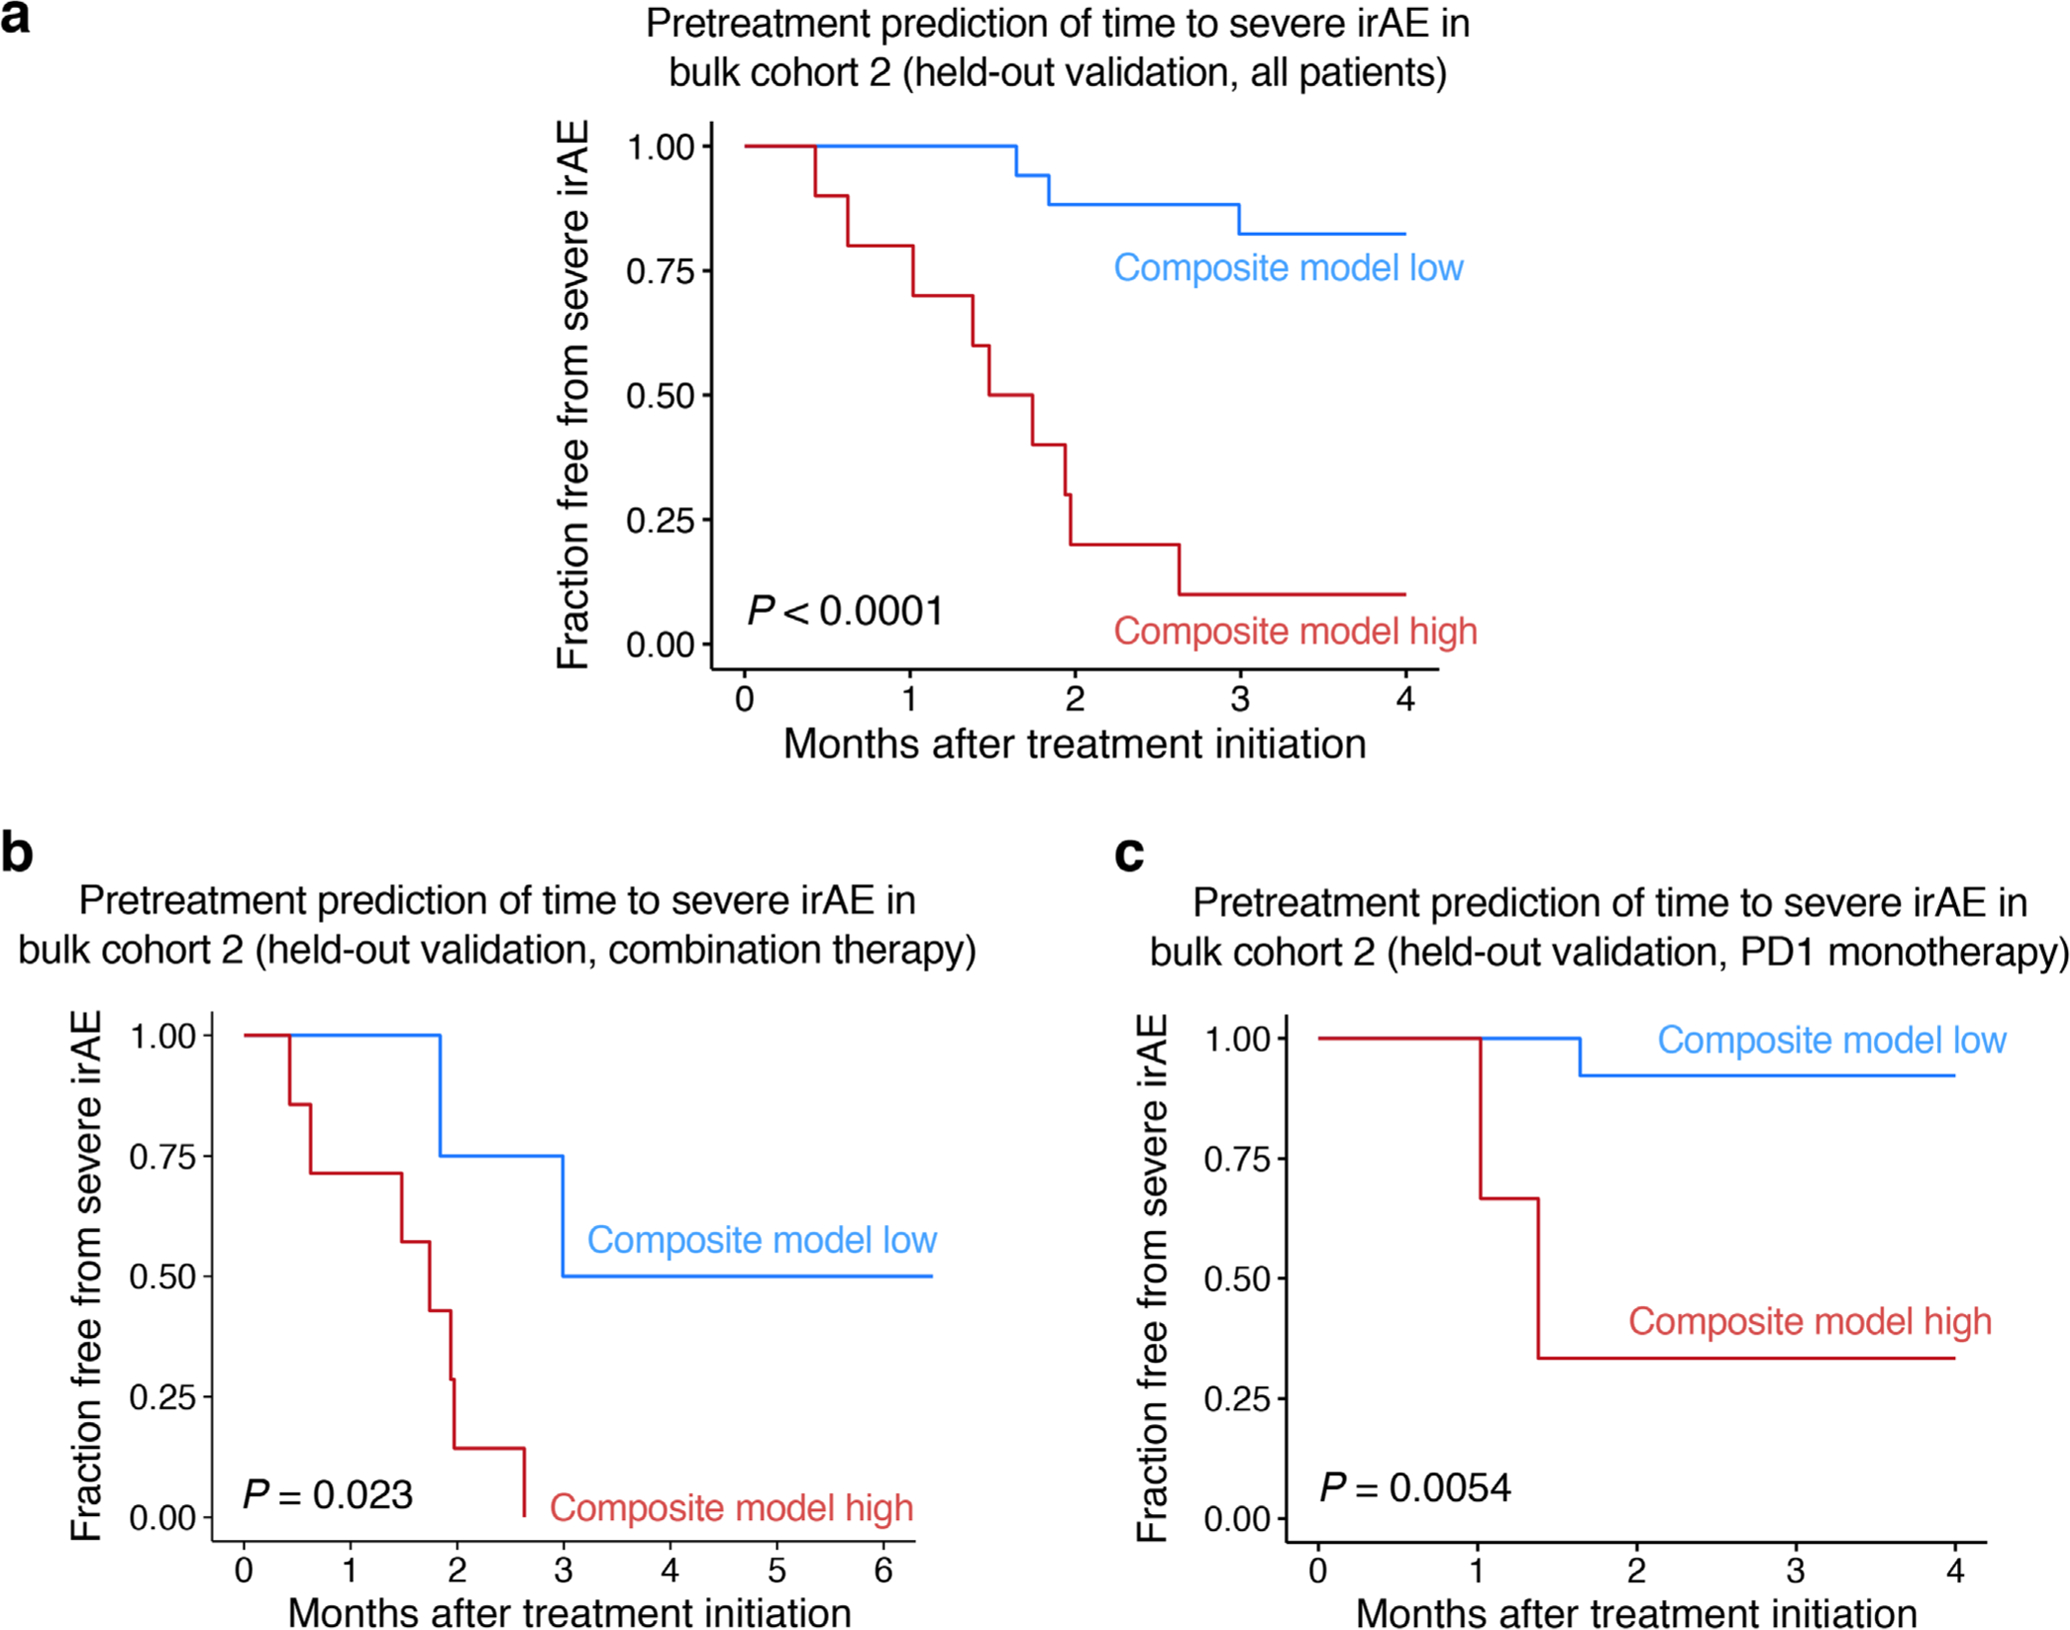
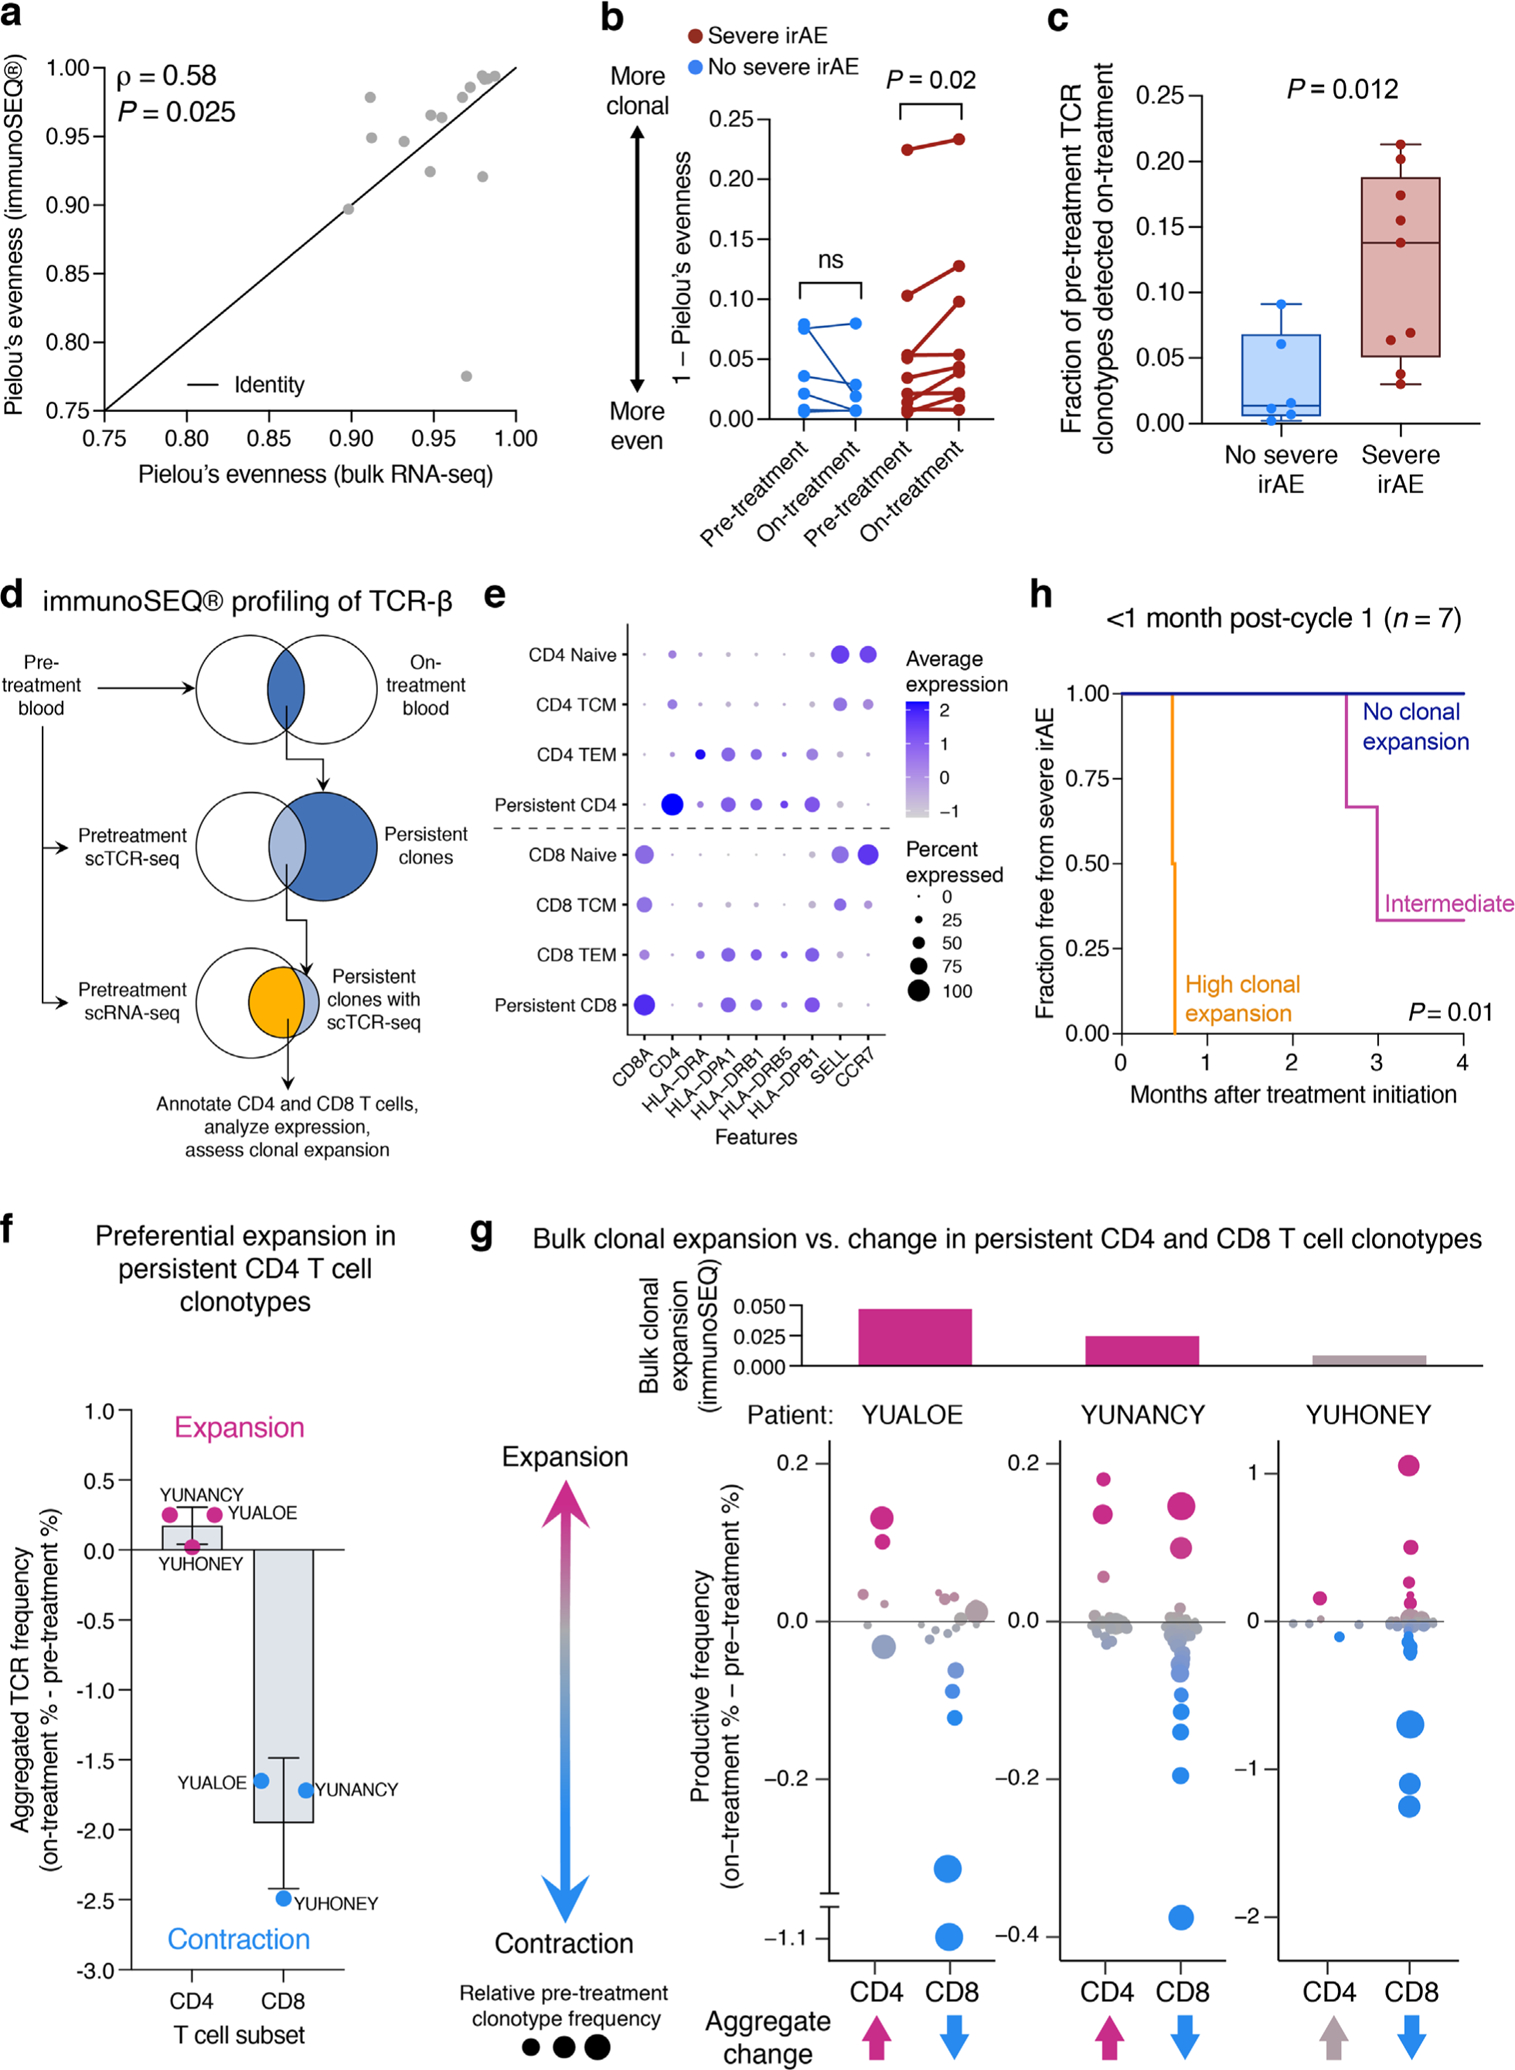
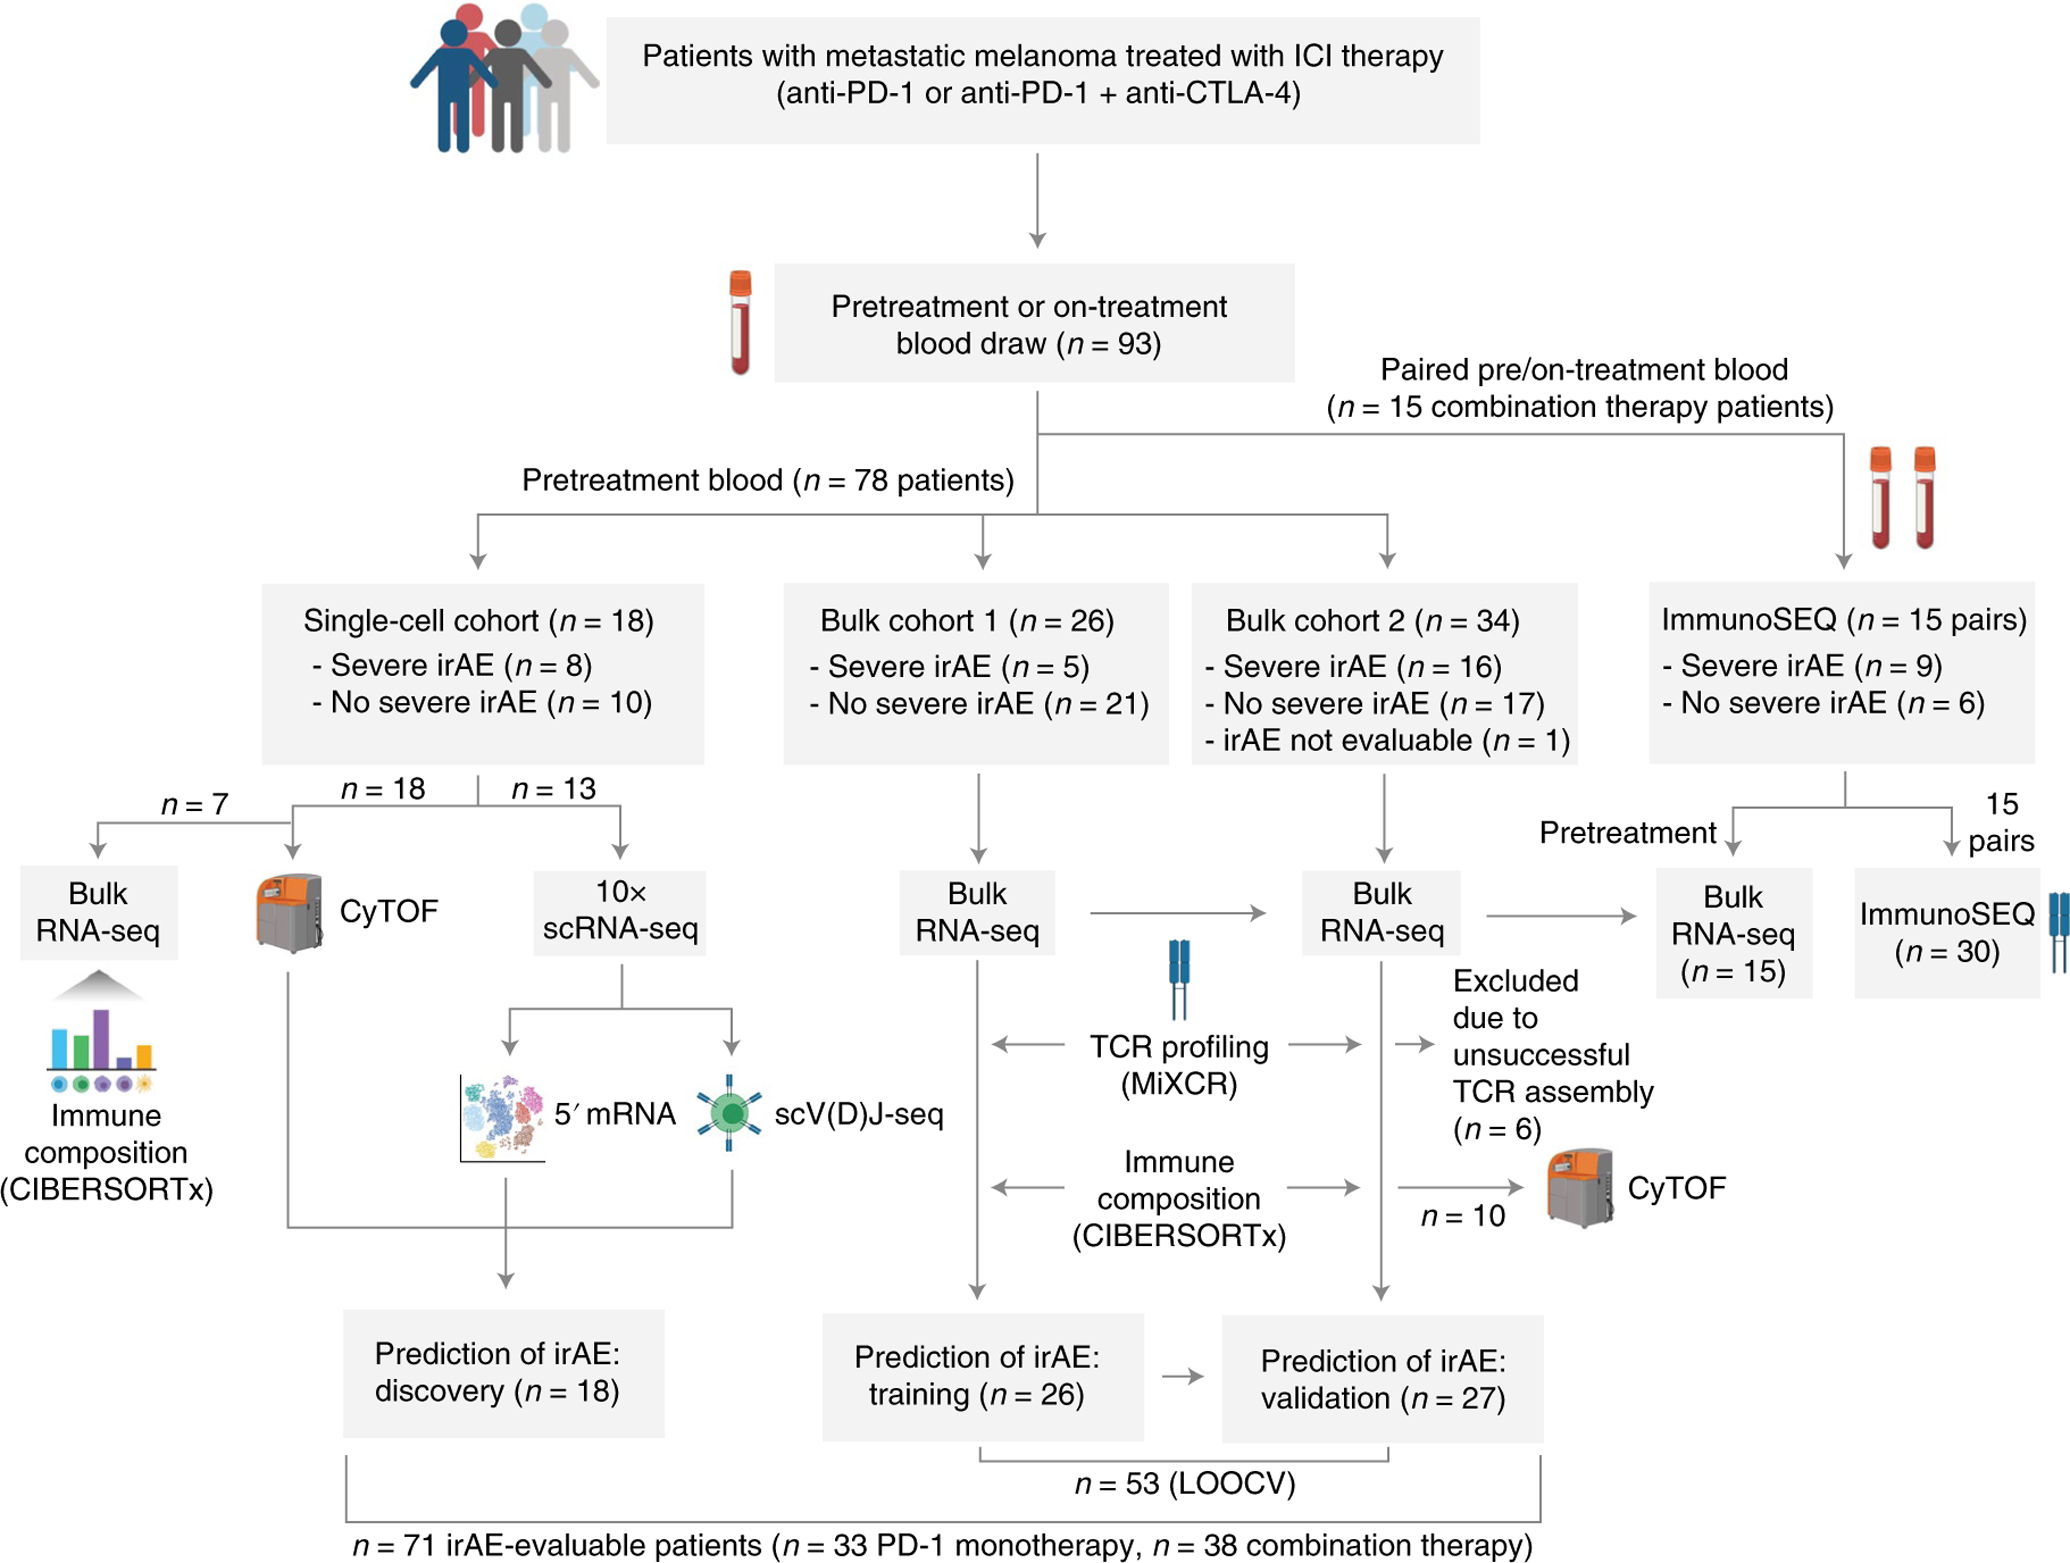
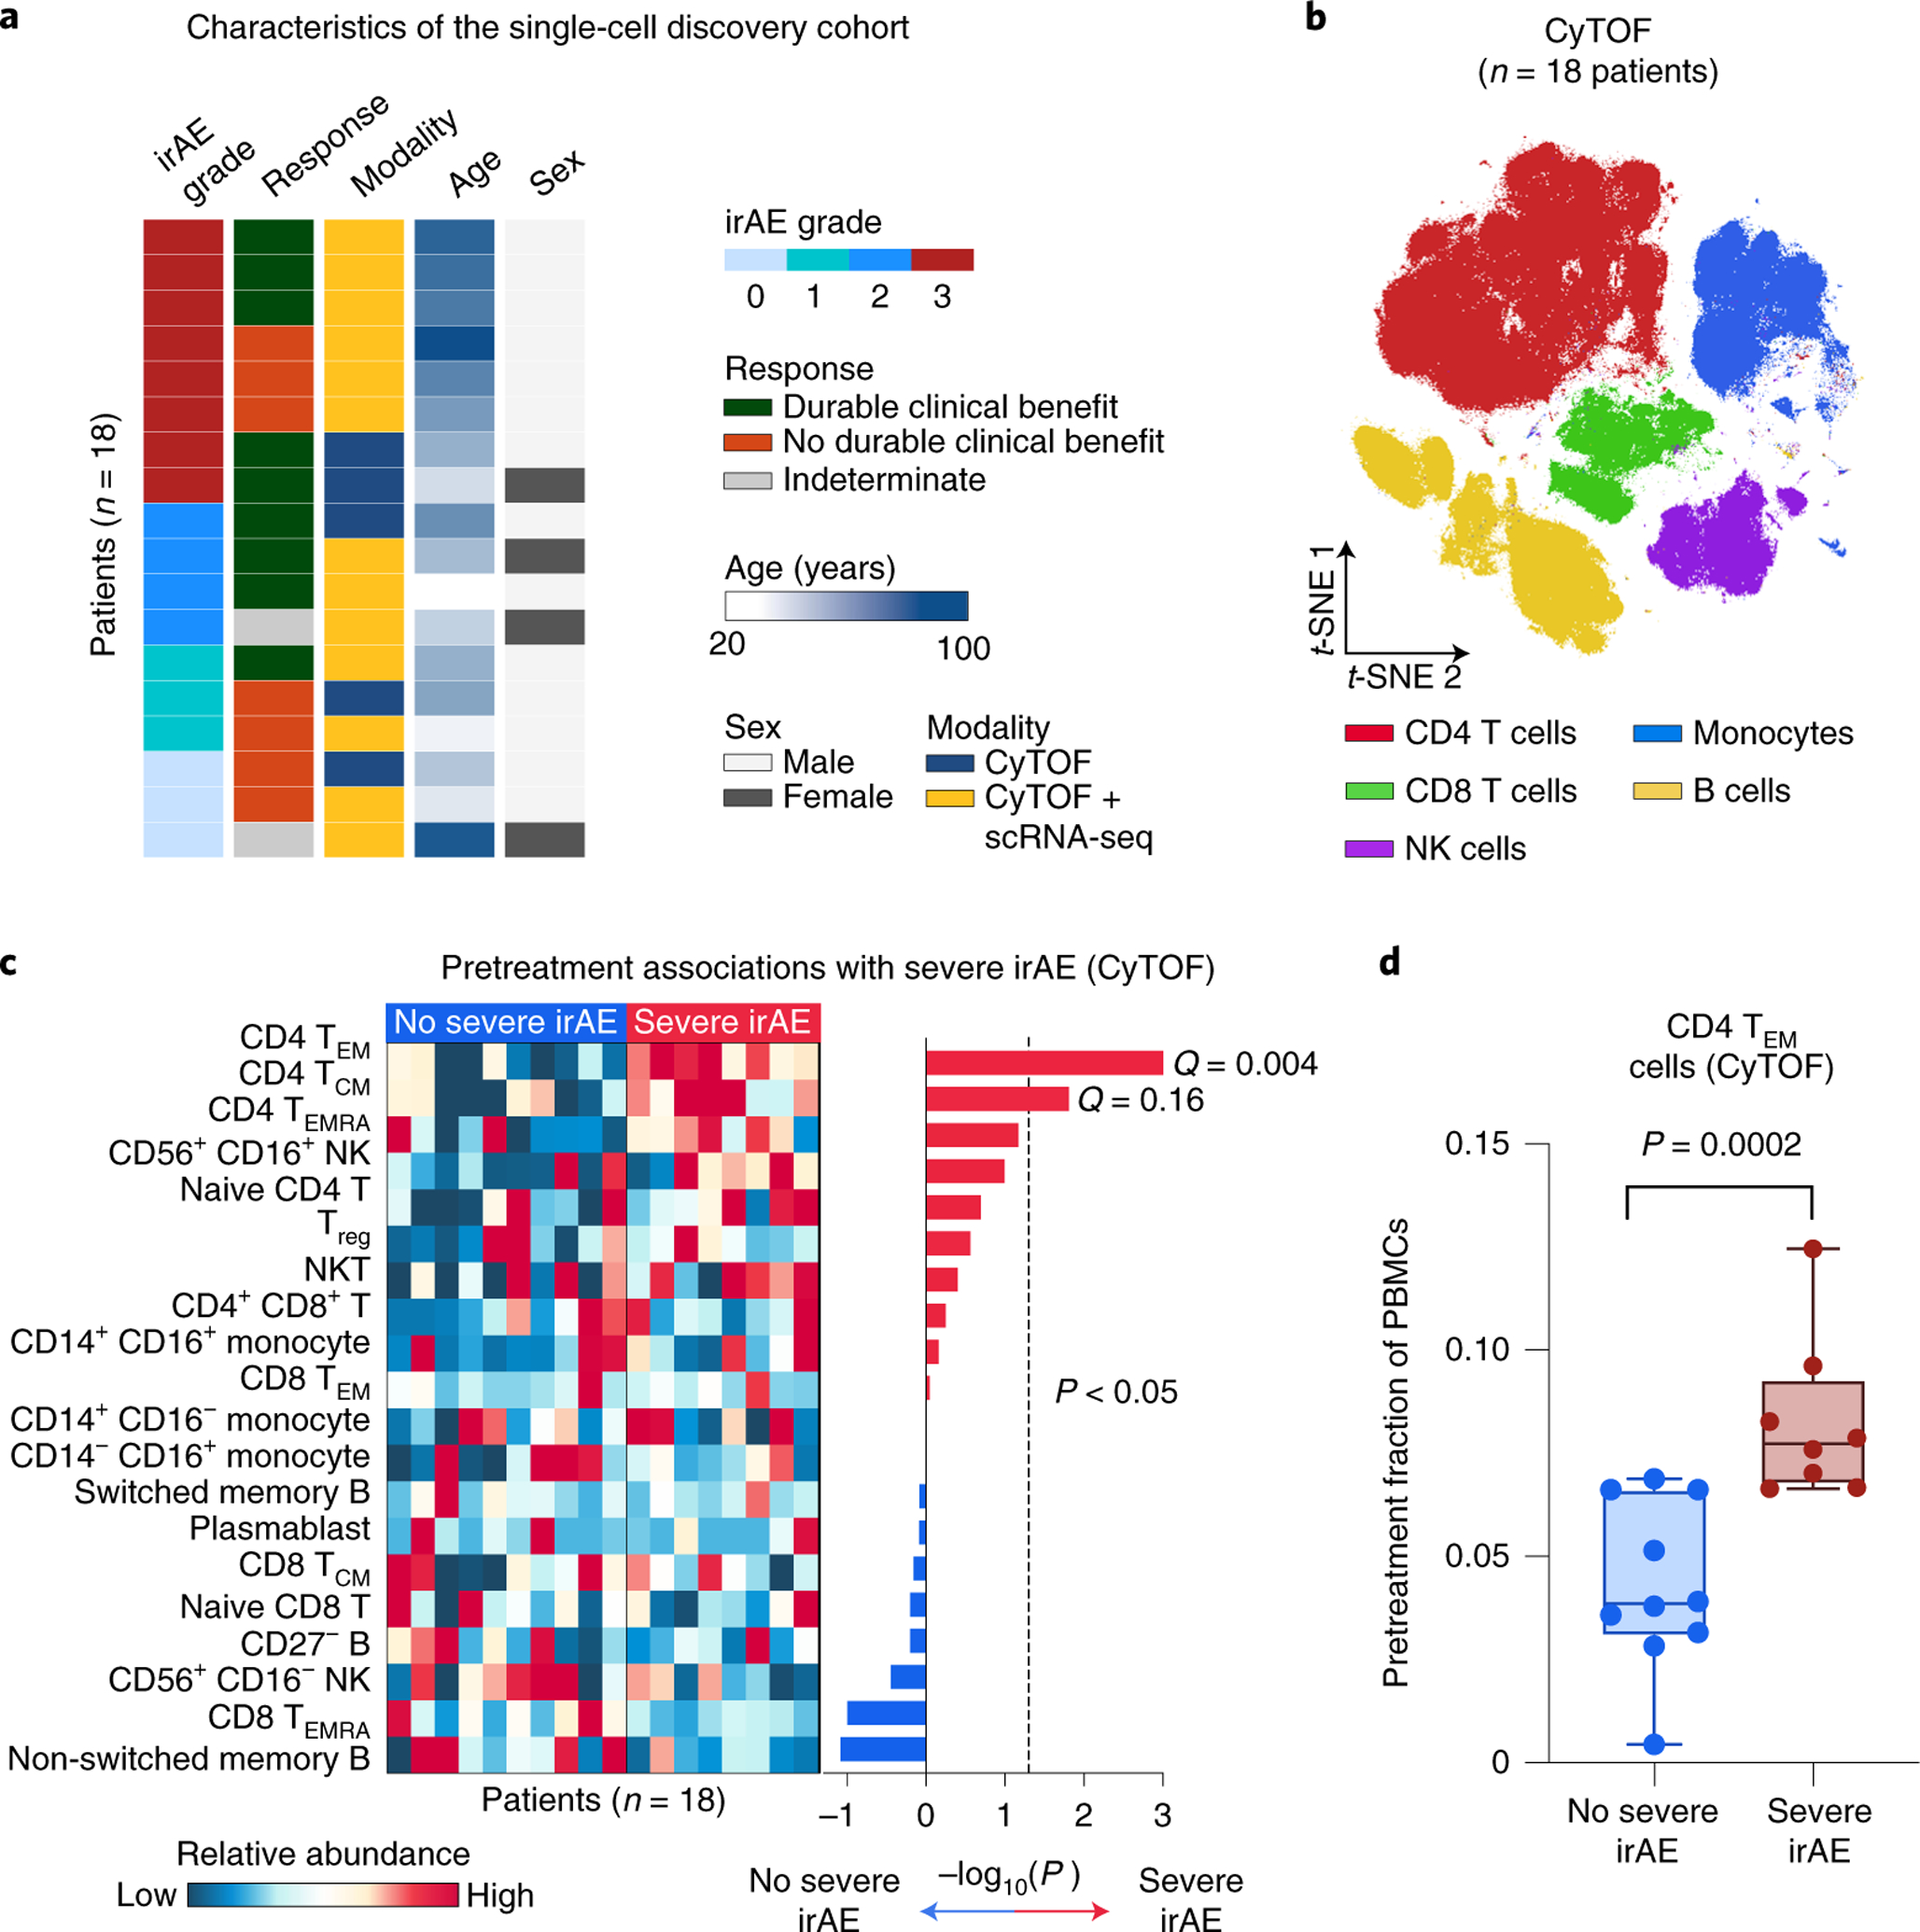
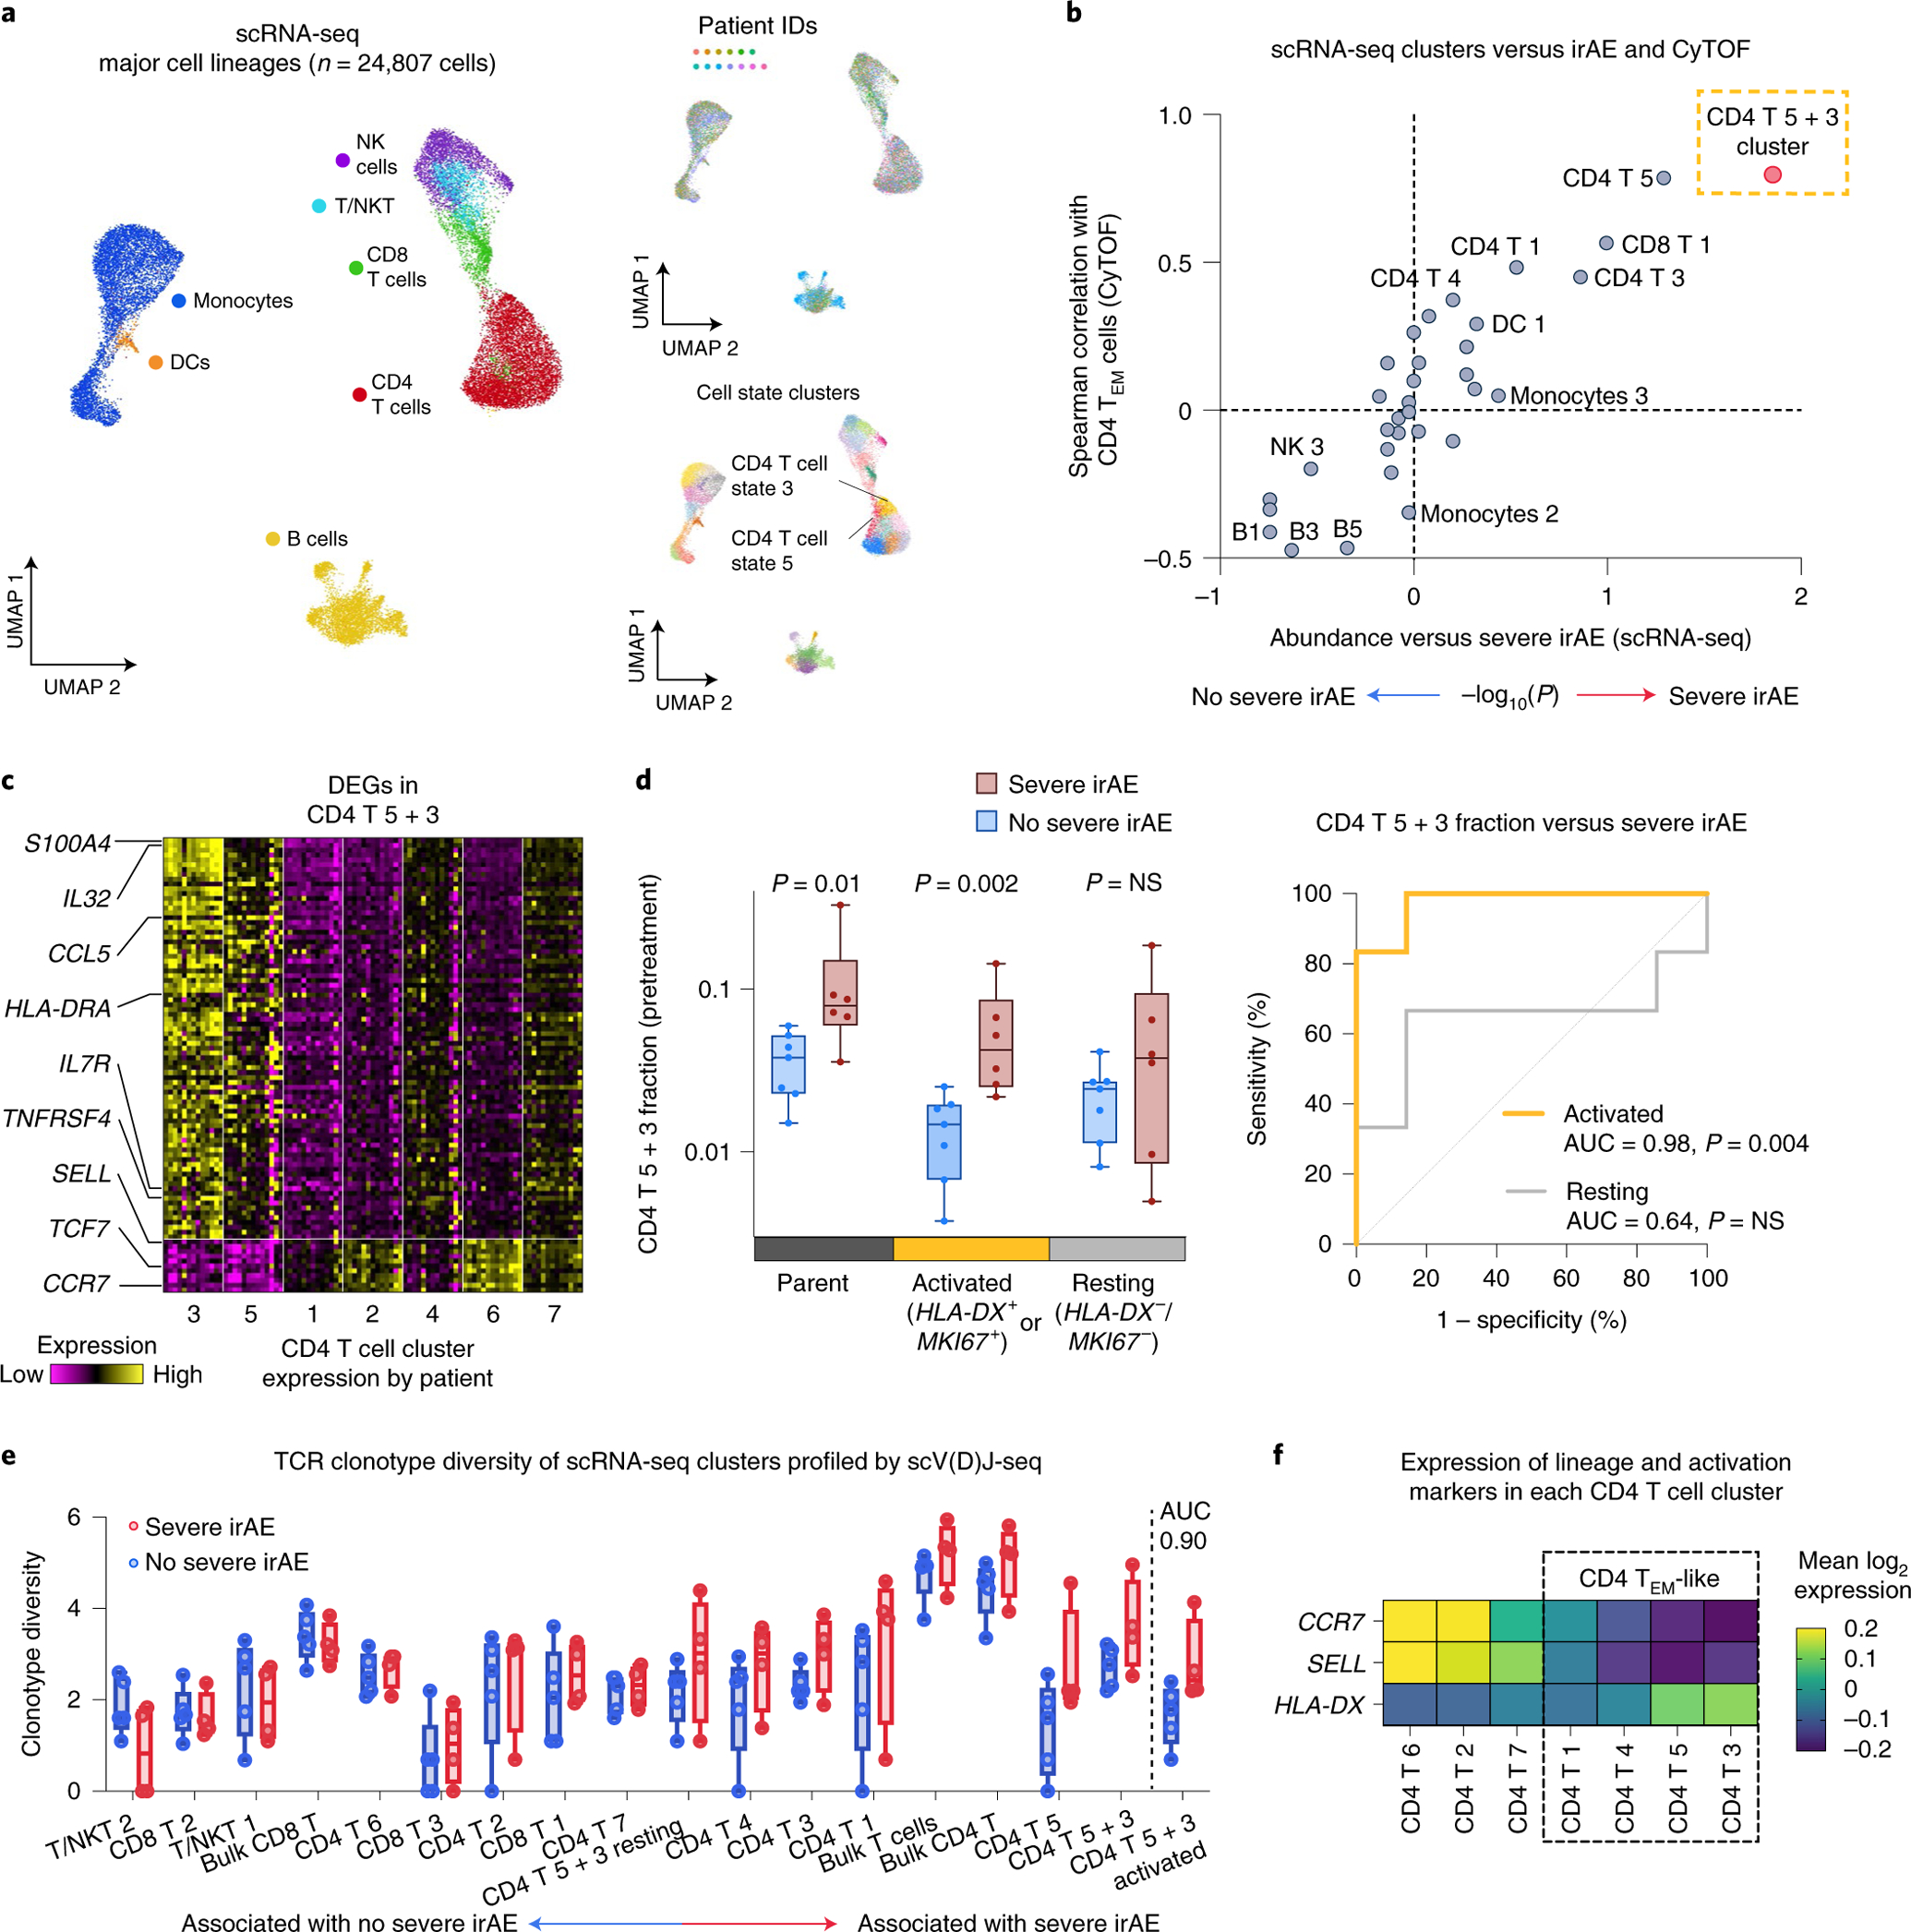
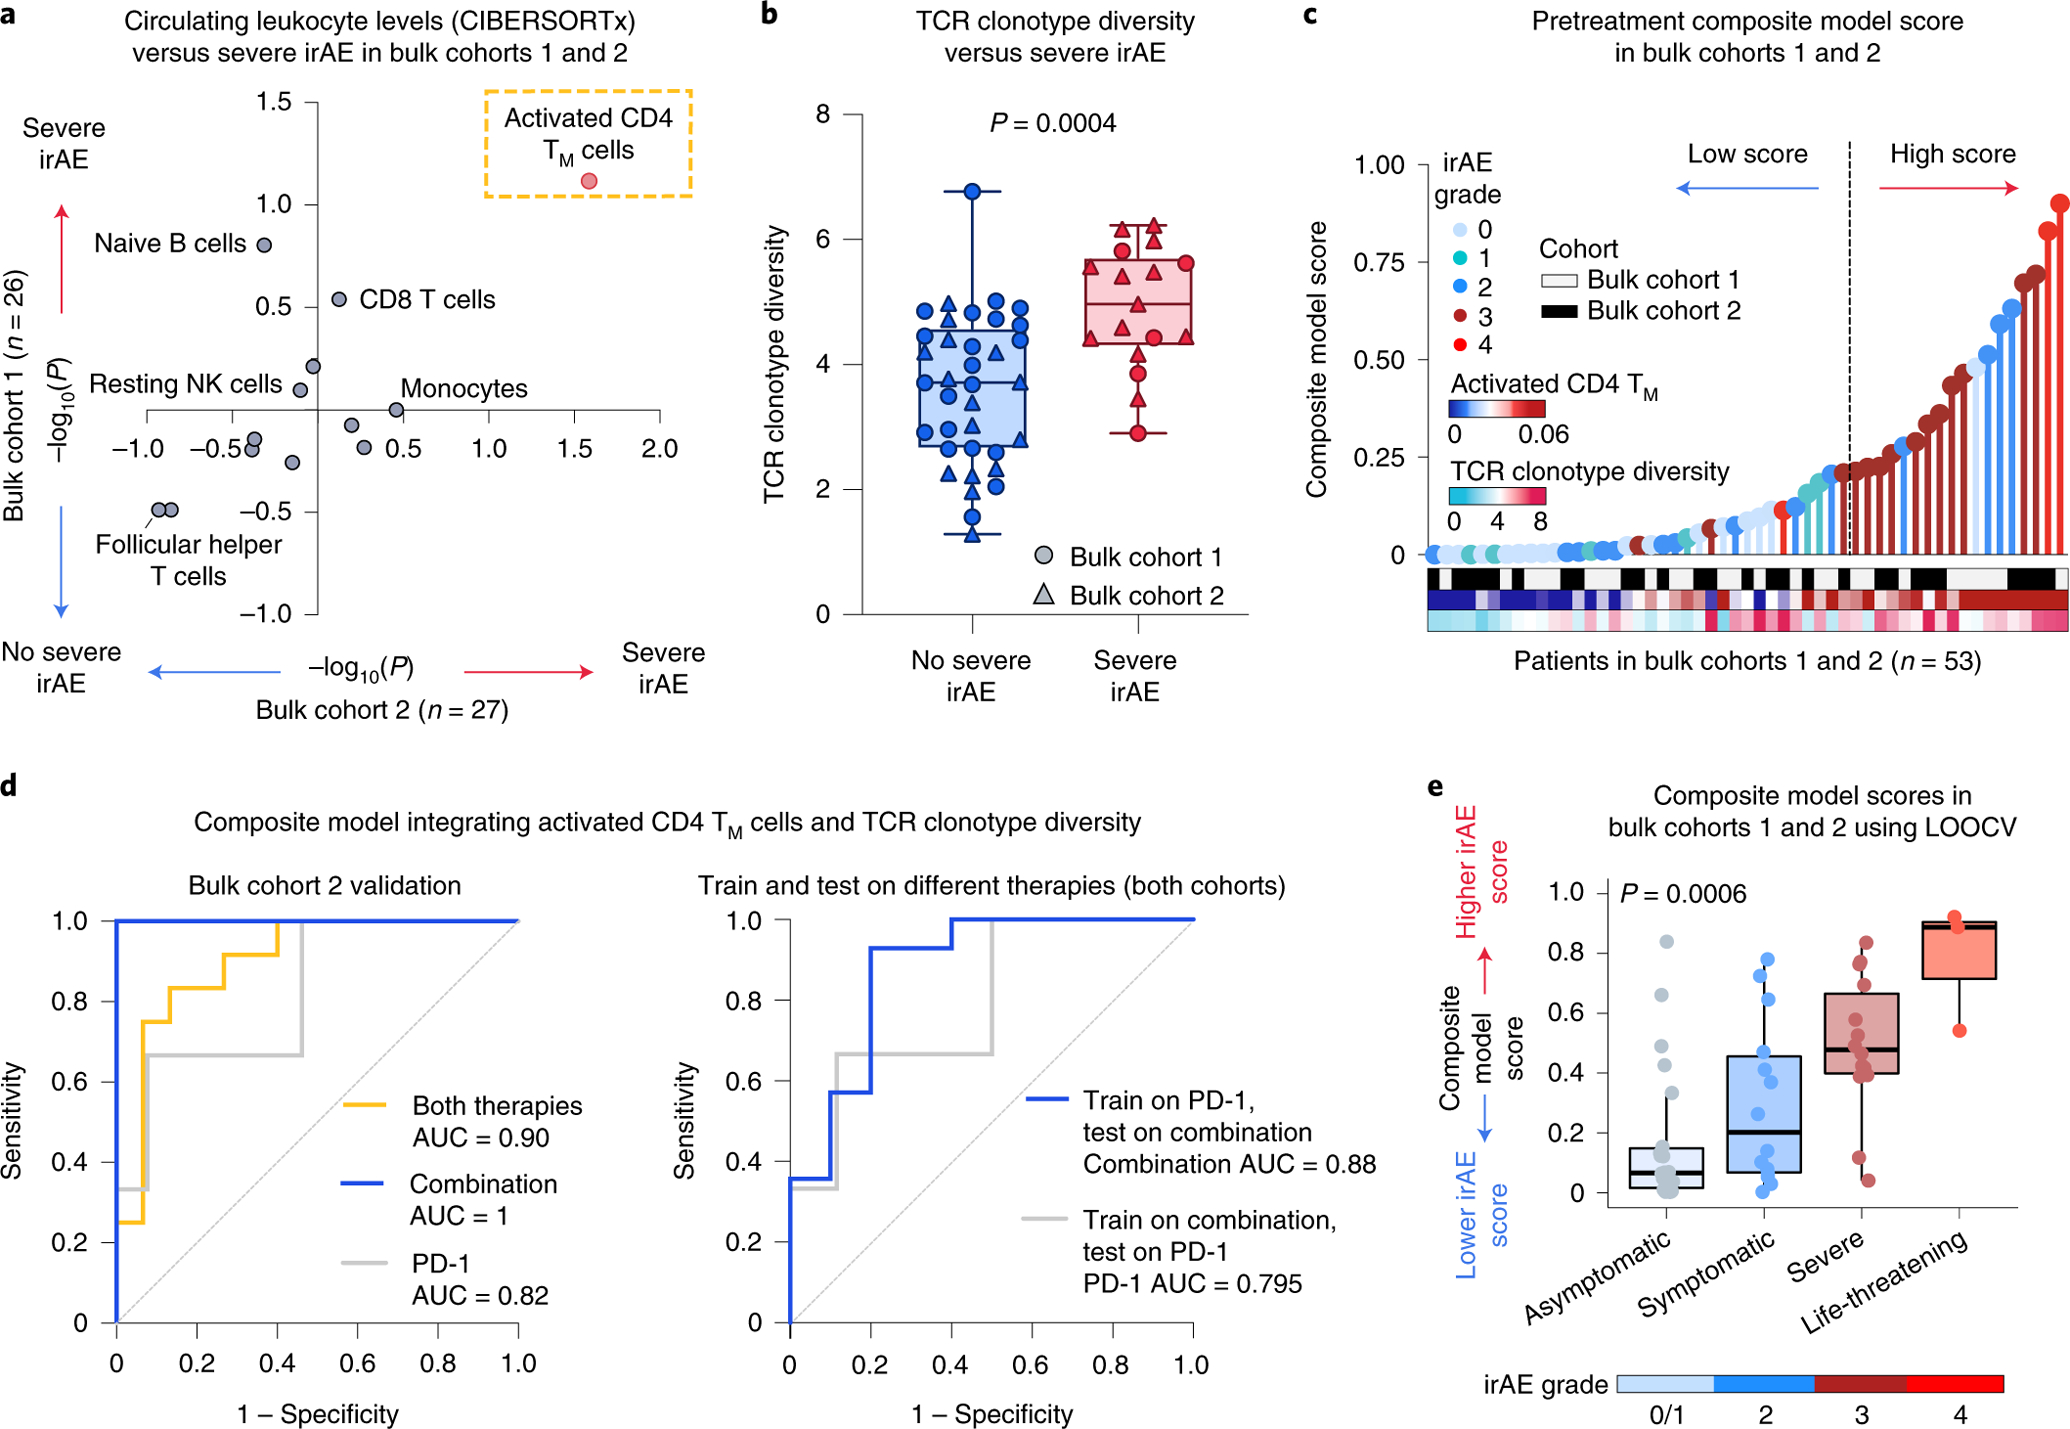
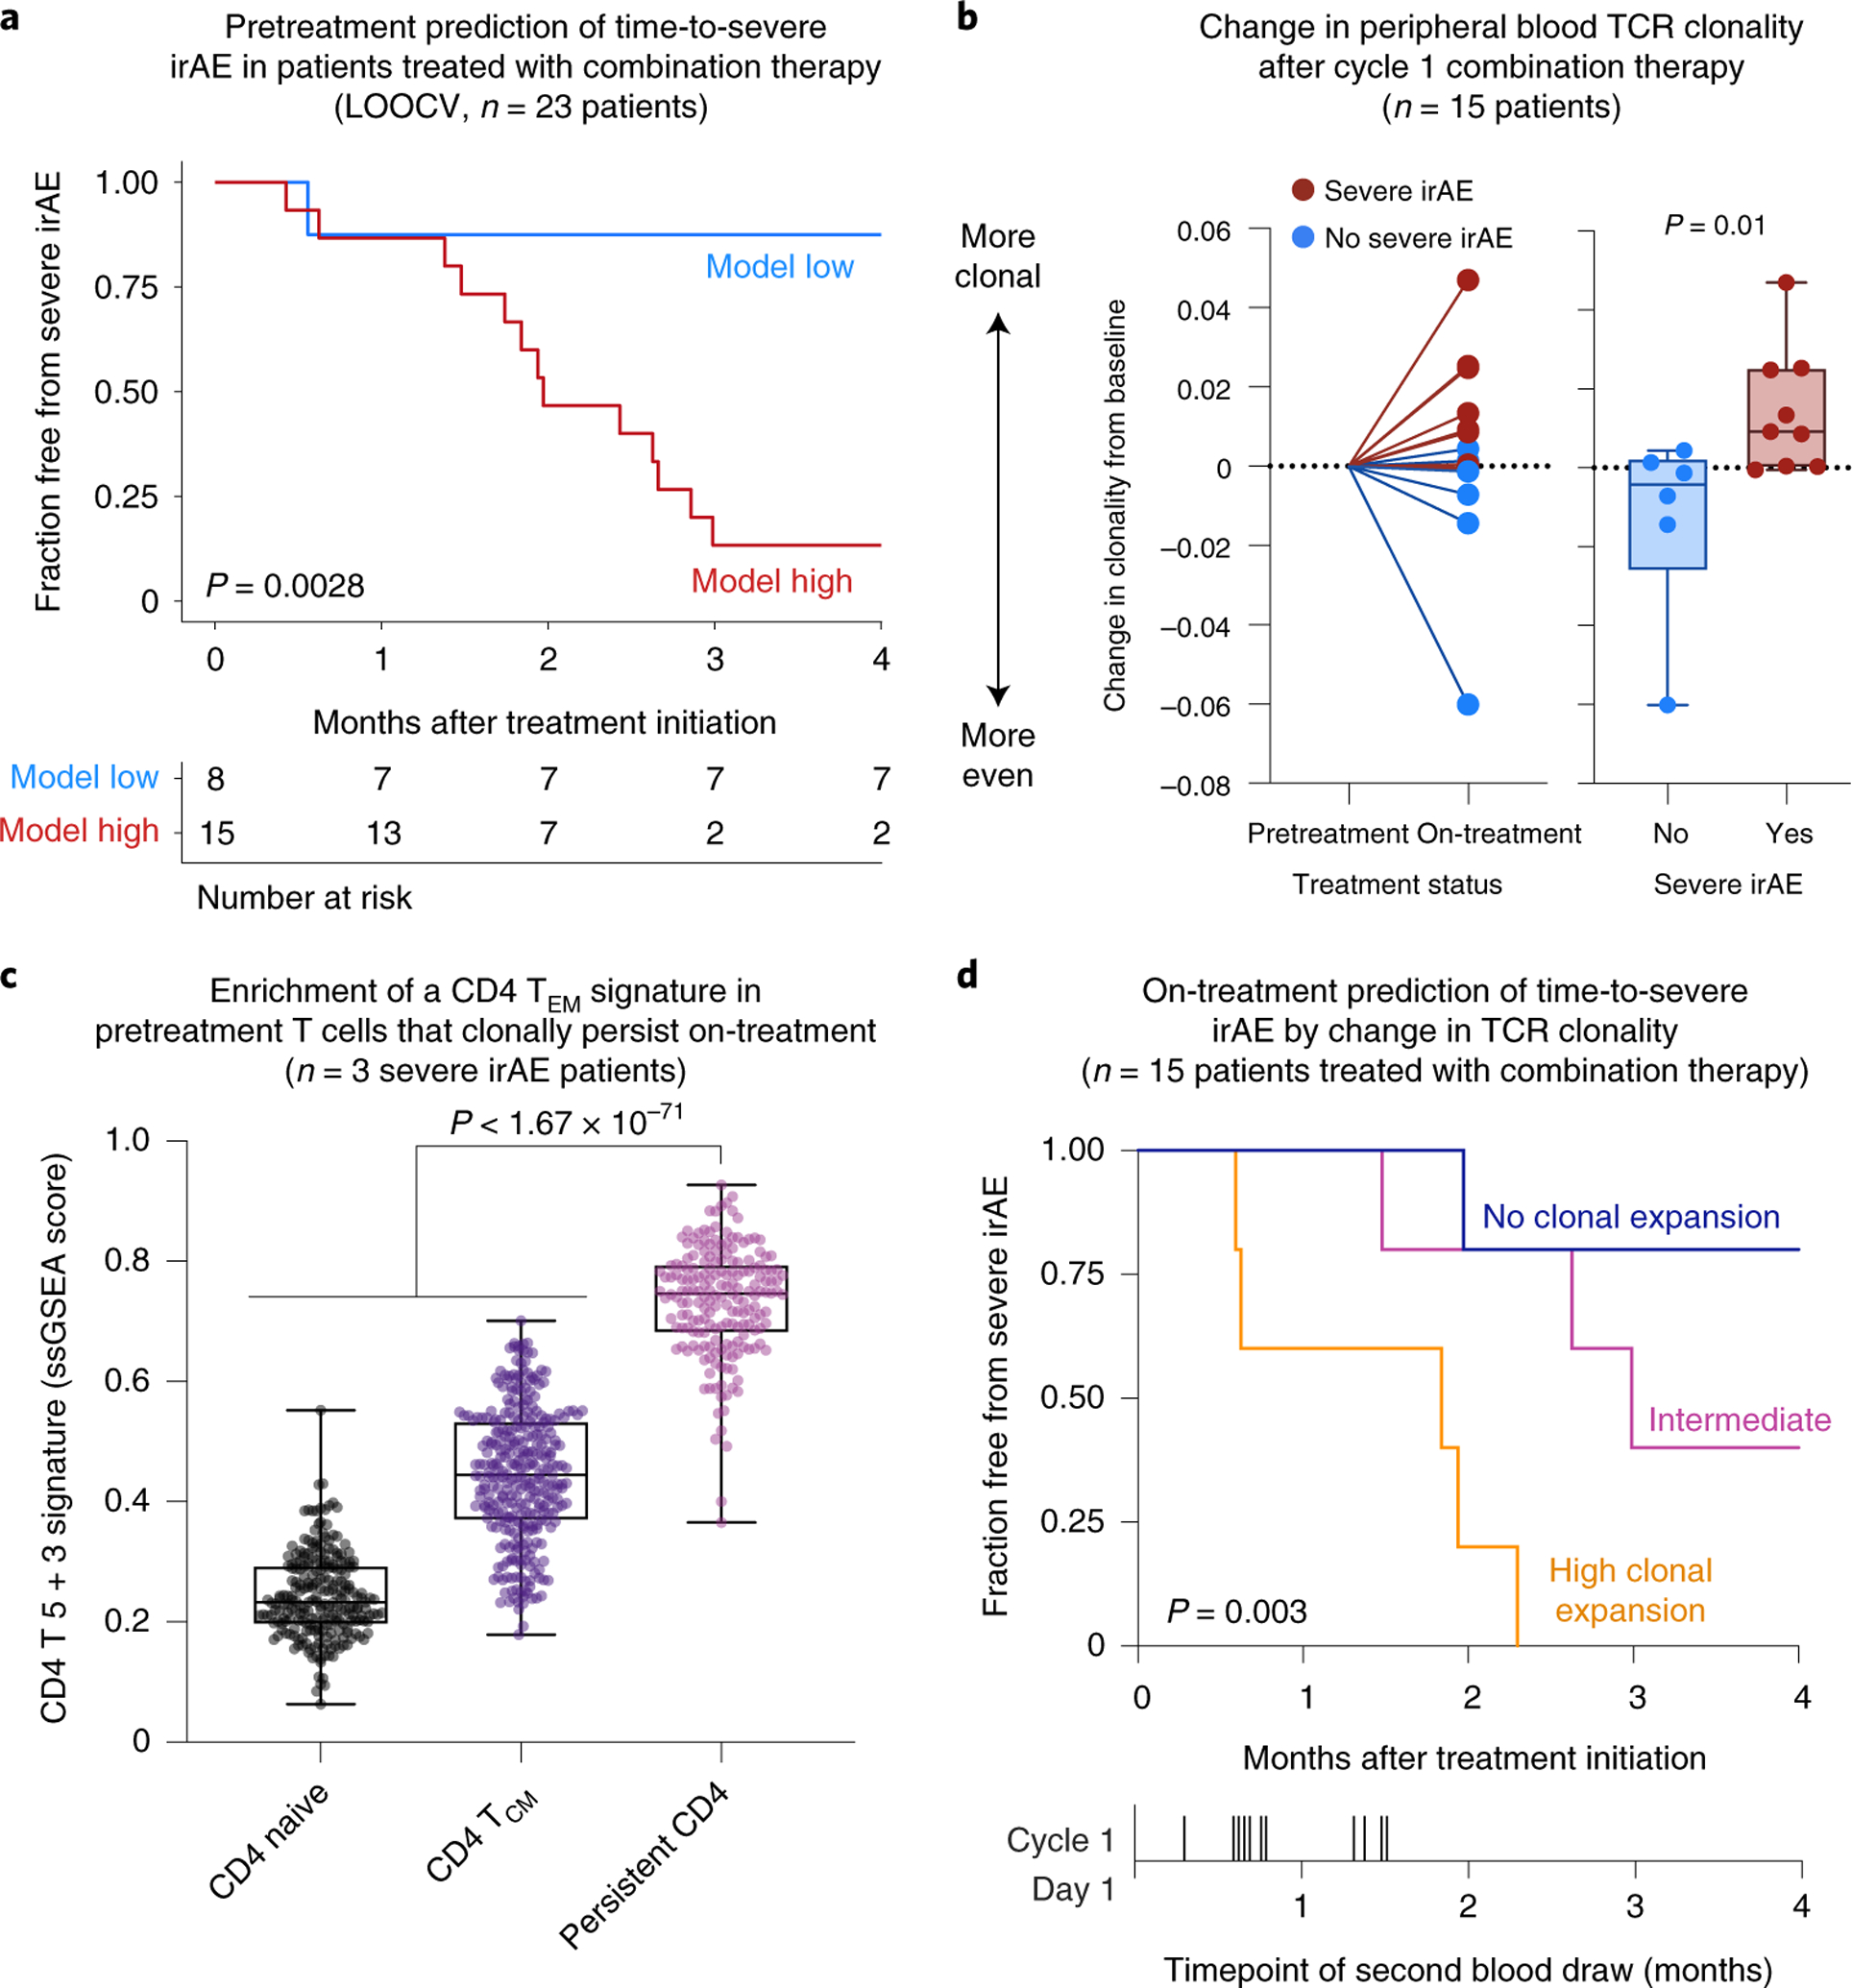
Severe immune-related adverse events (irAEs) occur in up to 60% of patients with melanoma treated with immune checkpoint inhibitors (ICIs). However, it is unknown whether a common baseline immunological state precedes irAE development. Here we applied mass cytometry by time of flight, single-cell RNA sequencing, single-cell V(D)J sequencing, bulk RNA sequencing and bulk T cell receptor (TCR) sequencing to study peripheral blood samples from patients with melanoma treated with anti-PD-1 monotherapy or anti-PD-1 and anti-CTLA-4 combination ICIs. By analyzing 93 pre- and early on-ICI blood samples and 3 patient cohorts (n = 27, 26 and 18), we found that 2 pretreatment factors in circulation-activated CD4 memory T cell abundance and TCR diversity-are associated with severe irAE development regardless of organ system involvement. We also explored on-treatment changes in TCR clonality among patients receiving combination therapy and linked our findings to the severity and timing of irAE onset. These results demonstrate circulating T cell characteristics associated with ICI-induced toxicity, with implications for improved diagnostics and clinical management.


Figures

Extended Data Fig. 1 |
Extended Data Fig. 1 |. Quality control and extended characterization of cell states identified by unsupervised clustering of scRNA-seq data.
a, UMAP representation of pretreatment peripheral blood leukocytes profiled by droplet-based scRNA-seq (10x Genomics) from 13 patients with metastatic melanoma, colored by major cell lineages, severe irAE status, TCR expression by scV(D)J-seq, and BCR expression by scV(D)J-seq (related to Fig. 3a). b, Unsupervised hierarchical clustering (average linkage) of the mean log2 transcriptome per CD4 T cell cluster identified from scRNA-seq data. c, Dot plot showing the average expression of key activation (HLA-DX, MKI67) and lineage markers (SELL, CCR7) in CD4 T cell clusters. d, Same as Fig. 3b but showing all pairwise combinations of scRNA-seq clusters within each of the major cell types analyzed (B cells, CD4 T cells, CD8 T cells, NK cells, monocytes). Across 82 possible pairwise combinations, CD4 T 5 + 3 achieved the highest Spearman correlation against CD4 TEM levels enumerated by CyTOF and the strongest association with severe irAE development. Cells annotated as ‘T/NKT’ were collapsed into CD8 T cells. e, Same as panel d but showing all pairwise combinations ranked by the mean of each feature following unit variance normalization (mean of 0 and standard deviation of 1). In this analysis, the −log10 P-value for the association with severe irAE (two-sided, unpaired Wilcoxon rank sum test) was normalized to unit variance without considering the direction of the association.
Extended Data Fig. 2 |
Extended Data Fig. 2 |. Analysis of scRNA-seq states identified by reference-guided annotation.
a, UMAP projections of scRNA-seq data generated in this work, embedded and labeled by Azimuth using a reference PBMC atlas of 162k cells profiled by scRNA-seq and 228 antibodies (Methods). b, Confusion matrix showing the agreement between phenotypic labels determined by marker genes and unsupervised clustering (rows; related to Fig. 3a and Extended Data Fig. 1a) versus reference-guided annotation with Azimuth (columns). In total, 85% of single cells assigned to a major lineage group by Azimuth (B cells, CD4 T, CD8 T, NK cells, monocytes) were assigned to the same identity by canonical marker gene assessment. Given the absence of NKT cells in the reference atlas used for Azimuth, the T/NKT cluster defined by unsupervised analysis was relabeled as CD8 T cells. c, Same analysis as in Fig. 3b but shown for all 27 phenotypic states identified by Azimuth. Among these states, CD4 TEM was most associated with severe irAE and CyTOF-enumerated CD4 TEM. A population combining CD4 TEM and CD4 Proliferating states was also strongly associated with severe irAE. The latter showed the highest expression of HLA-DX and lowest expression of SELL (panel d), consistent with an activated CD4 TEM phenotype. d, Dot plot depicting key activation and lineage markers among CD4 T cell states annotated by Azimuth. e, Violin plots showing protein expression levels imputed by Azimuth using antibody-derived tag (ADT) data, supporting the combination of CD4 TEM and CD4 Proliferating states in panels c and f. f, Performance of top-ranking cell subsets identified by Azimuth and unsupervised clustering for prediction of severe irAEs. The combined CD4 T 5 + 3 clusters (Fig. 3b) were more associated with severe irAE and CyTOF than the top-ranking reference-guided population (panel c). Statistical significance was calculated using a two-sided, unpaired Wilcoxon rank sum test. Data in all panels shown are from the 13 samples profiled by scRNA-seq in Fig. 3.
Extended Data Fig. 3 |
Extended Data Fig. 3 |. Analysis of activated, resting, and parental T cell subsets in relation to severe irAE development.
a, Association between severe irAE development and pretreatment levels of T cell states identified by unsupervised clustering (left) and memory-like T cell states identified by Azimuth (right) in 13 PBMC samples profiled by scRNA-seq (Figs. 1 and 3a). Activated cells were defined as those expressing HLA-DX or MKI67 (CPM > 0); resting cells were defined by the absence of HLA-DX and MKI67 expression (CPM = 0). b, Left: Association between severe irAE development and pretreatment levels of memory T cell subsets, total CD4 and CD8 T cells, and total T cells quantified by CyTOF, for all 18 patients analyzed in the single-cell discovery cohort (Figs. 1 and 2a). Activated phenotypes were defined as CD38+ or HLA-DR+ or Ki67+. Resting phenotypes were defined as CD38HLA-DRKi67. Right: ROC plot showing the performance of activated and resting CD4 TEM subsets (left panel) for predicting severe irAE development. Cell fractions were assessed relative to total PBMC content. Statistical significance in a, b was determined by a two-sided, unpaired Wilcoxon rank sum test and nominal −log10 P-values are displayed. −log10 P-values were further multiplied by −1 for associations with no severe irAE. See also Supplementary Table 6.
Extended Data Fig. 4 |
Extended Data Fig. 4 |. Extended characterization of immune repertoire diversity from single-cell V(D)J sequencing data.
a, Key TCR diversity measures and the impact of cell abundance, TCR richness, and distinct clonal repertoires on such measures. Hypothetical CD4 naïve and TEM cell subsets are shown as examples. Triangles depicting differences in magnitude are not drawn to scale. b, Mean Shannon entropy versus mean clonality (1 ‒ Pielou’s evenness) for each CD4 T cell state identified by unsupervised clustering of scRNA-seq data. CD4 T 5 + 3 (Fig. 3b,c), a TEM state enriched for activated cells, shows elevated clonality relative to other CD4 states, as expected for this phenotype, while also showing higher diversity (Shannon entropy), indicating elevated richness. c, Distribution of EM-like CD4 T cell states (from Fig. 3f) with available scTCR clonotype data. d, Association between severe irAE development and TCR diversity (Shannon entropy) in pseudo-bulk T cells from pretreatment blood, shown for all T cell states identified by scRNA-seq (left) and after the removal of the EM-like states indicated in panel c (no severe irAE, n = 5 patients; severe irAE, n = 4 patients). e, Same as d but shown for EM-like states alone. f, Area under the curve (AUC) for the association between pretreatment peripheral TCR diversity (Shannon entropy) and severe irAE development, shown for all combinations of the constituent cell states in e, including the combined CD4 T 5 + 3 cluster after restricting to activated cells (CPM > 0 for HLA-DX or MKI67). Of note, no other combination of activated EM-like states achieved an AUC > 0.85 in this analysis. g, BCR clonotype diversity (Shannon entropy), shown for each B cell state identified by unsupervised clustering (Fig. 3a). In b, d–f, only patients with at least 100 TCR clones were analyzed (n = 9; Methods). The same patients were analyzed in g for consistency. In panels d, e, and g, center lines, bounds of the box, and whiskers indicate medians, 1st and 3rd quartiles, and minimum and maximum values, respectively.
Extended Data Fig. 5 |
Extended Data Fig. 5 |. Validation of CiBERSORTx by single-cell analysis.
a, Expression of developmentally-regulated marker genes in major CD4 T cell subsets from the LM22 signature matrix (MAS5 normalized), showing that the LM22 reference signature for activated CD4 memory T cells has a TEM profile. b, CIBERSORTx versus mass cytometry for enumeration of activated CD4 memory T cells in the pretreatment peripheral blood of 17 metastatic melanoma patients (Supplementary Table 1). A linear regression line with 95% confidence band is shown. Concordance and significance were determined by Pearson r and a two-sided t test, respectively. While activated CD4 memory T cells quantitated by CyTOF were defined by CD38 expression in this plot, other activated CD4 TEM subsets were also significantly correlated with CIBERSORTx (panel c). c, Cross correlation plot of lymphocyte subset frequencies determined by CyTOF and CIBERSORTx. Act., Activated. d, Correlation between activated CD4 memory T cell levels inferred by CIBERSORTx and 14 memory T cell states profiled by CyTOF, including CD38+ activated subsets manually gated within each population, in PBMCs from 17 metastatic melanoma patients (Supplementary Table 1). e, Scatter plot depicting the global correlation of lymphocyte subsets enumerated by CIBERSORTx and flow cytometry in peripheral blood samples from five healthy subjects profiled by bulk RNA-seq (Supplementary Table 1). A linear regression line with 95% confidence band is shown. Concordance and significance were determined by Pearson r and a two-sided t test, respectively. As monocytes were variably underestimated by cytometry compared to complete blood counts, all results in b–e are expressed as a function of total lymphocytes. f, Distribution of activated CD4 memory T cell levels quantitated by CyTOF (CD38+, HLA-DR+ or Ki67+ CD4 TEM cells, n = 28 patients), scRNA-seq (HLA-DX+ or MKI67+ cells within CD4 T clusters 5 and 3, n = 13 patients), and CIBERSORTx (n = 60 patients) across all irAE-evaluable samples profiled by each modality in this work (Supplementary Table 1). Box center lines, bounds of the box, and whiskers indicate medians, 1st and 3rd quartiles, and minimum and maximum values, respectively. Statistical significance was determined by a Kruskal-Wallis test. n.s., not significant (P > 0.05).
Extended Data Fig. 6 |
Extended Data Fig. 6 |. Extended analysis of TCR diversity from pretreatment peripheral blood expression profiles.
a–d, Association between baseline bulk TCR diversity and the highest irAE grade observed for each patient in bulk cohorts 1 and 2 (Supplementary Tables 7 and 9), shown for two diversity measures (a and c, Shannon entropy; b and d, Gini-Simpson index) and stratified by therapy type. In a and b, patients treated with combination therapy are stratified by future irAE status: no severe irAE (n = 10) versus severe irAE (n = 14 patients) (left) and irAE grade (right): 0/1 (n = 3), 2 (n = 7), 3 (n = 12), and 4 (n = 2). In c and d, patients treated with PD1 monotherapy are stratified by future irAE status: no severe irAE (n = 26) versus severe irAE (n = 3 patients) (left) and irAE grade (right): 0/1 (n = 19), 2 (n = 7), 3 (n = 2), and 4 (n = 1). Two-group comparisons were assessed by a two-sided, unpaired Wilcoxon rank sum test. n.s., not significant (P > 0.05). Linear regression was applied to evaluate the median value of each measure grouped by irAE grade (insets). The significance of linear concordance was determined by a two-sided t test. Grades 0 and 1 reflect no toxicity and asymptomatic toxicity, respectively, and were combined. In all panels, the box center lines, bounds of the box, and whiskers denote medians, 1st and 3rd quartiles, and minimum and maximum values within 1.5 × IQR (interquartile range) of the box limits, respectively.
Extended Data Fig. 7 |
Extended Data Fig. 7 |. Composite model performance across patients, key patient subgroups, the number of symptomatic irAEs per patient, and organ system involvement.
a, Same as Fig. 4d, but applied to both bulk cohorts (n = 53 patients) using leave-one-out cross-validation (LOOCV) (Methods). b, Same as Fig. 4c, but shown for model scores determined by LOOCV. c, Performance of the composite model versus other candidate pretreatment factors for predicting severe irAE development (Methods). The composite model was trained in bulk cohort 1 (BC1) and validated in bulk cohort 2 (BC2) or vice versa, as indicated. d, Performance of the composite model trained on bulk cohort 1 for predicting severe irAEs in different patient subgroups from bulk cohort 2. DCB, durable clinical benefit; NDB, no durable clinical benefit; GI, gastrointestinal. e, Composite model scores determined by LOOCV for all bulk cohort patients treated with combination therapy (n = 24), stratified by future irAE grade: 0/1 (n = 3), 2 (n = 7), 3 (n = 12), and 4 (n = 2). f, Model performance for predicting grade 2 +, 3 +, or 4 irAE development in combination therapy patients using the scores in e. g,h, Composite model scores determined by LOOCV in both bulk cohorts (n = 53 patients) versus the number of symptomatic irAEs (grade 2 +) per patient (g) and the number of organ system toxicities per patient (h). i, Distribution of irAEs across patients and organ systems (Supplementary Table 15). Patients from bulk cohorts 1 and 2 are organized by decreasing composite model scores determined via LOOCV (Methods). The line distinguishing high/low scores was optimized using LOOCV (Methods). j, Fraction of patients in both bulk cohorts that developed irAEs in at least 2 organ systems versus those that did not, stratified by the threshold in panel i (Methods). Significance was determined by a two-sided Fisher’s exact test. In e, g, and h, center lines, bounds of the box, and whiskers indicate medians, 1st and 3rd quartiles, and minimum and maximum values within 1.5 × IQR (interquartile range) of the box limits, respectively. Statistical significance in e, g, and h was determined by a Kruskal-Wallis test.
Extended Data Fig. 8 |
Extended Data Fig. 8 |. Composite model performance for predicting time to severe irAE in validation bulk cohort 2.
a–c, Kaplan-Meier analysis for freedom from severe irAE in bulk cohort 2 for patients treated with combination or PD1 immune checkpoint blockade (a), combination therapy (b), or PD1 monotherapy (c), stratified by the composite model score (Methods). Statistical significance was calculated by a two-sided log-rank test. In all panels, training was performed in bulk cohort 1 and the cut-point predicting severe irAE was optimized for bulk cohort 1 using Youden’s J statistic (Supplementary Table 10; Methods). Notably, the analyses in a–c were landmarked between treatment initiation and three months following treatment initiation, with all severe irAEs occurring within this period. The Kaplan-Meier plots are shown out to four months given the extended follow-up of patients that did not develop any severe irAE (Supplementary Table 9).
Extended Data Fig. 9 |
Extended Data Fig. 9 |. Peripheral blood TCR-β profiling with immunoSEQ®.
a, Evenness (Pielou’s index) of TCR repertoires assembled by MiXCR (bulk RNA-seq) and immunoSEQ® (genomic DNA) from paired pretreatment PBMC samples (n = 15 combination therapy patients) (Supplementary Tables 1 and 18). Concordance and significance were determined by Spearman ρ and a two-sided t test, respectively. b, Similar to Fig. 5b but showing clonality for each pre- and on-treatment PBMC sample (Supplementary Table 18). Statistical significance was determined by a two-sided, paired Wilcoxon rank sum test. ns, not significant (P > 0.05). c, Fraction of pretreatment peripheral blood TCR clonotypes detected on-treatment in 15 combination therapy patients (Supplementary Table 18), stratified by no severe (n = 6) and severe (n = 9) irAE status. Clonotypes with matching productive CDR3 β-chain nucleotide sequences were considered identical. Center lines, bounds of the box, and whiskers indicate medians, 1st and 3rd quartiles, and minimum and maximum values, respectively. Significance was determined by a two-sided, unpaired Wilcoxon rank sum test. dg, Clonal dynamics in circulating T cells following combination therapy initiation. d, Persistent T cell clones identified by immunoSEQ® were cross-referenced with scTCR-seq and scRNA-seq data of pretreatment PBMCs from the same three patients (YUALOE, YUNANCY, YUHONEY), all of whom received combination therapy and developed severe ICI-induced toxicity (Supplementary Table 18; Methods). e, Log2 expression of key lineage and activation markers across major T cell states annotated by Azimuth along with persistent clones classified into CD4 and CD8 T cells (Methods). f, Aggregate change from baseline in the productive frequencies of persistent clonotypes, stratified by lineage (n = 2 cell types) and patient (n = 3). The sum of the difference in productive frequencies (on-treatment % – pretreatment %) was calculated from immunoSEQ® data. Bars denote mean + /− SD. g, Top: Change in bulk TCR clonality from baseline (Fig. 5b). Bottom: Same as f but showing the underlying clonotypes, where circle size is proportional to pretreatment clone frequency (immunoSEQ®). h, Same as Fig. 5d but restricted to blood draws taken cycle 1 day 1 of combination therapy and <1 month later (n = 7 patients; Supplementary Table 18).
Extended Data Fig. 10 |
Extended Data Fig. 10 |. Schema of large-scale assessment of peripheral blood leukocytes in autoimmune disorders versus healthy controls.
Schema describing the workflow and statistical meta-analysis for evaluating the enrichment of individual circulating leukocyte subsets in autoimmune disorders relative to healthy controls (Fig. 6; Methods). In brief, CIBERSORTx was applied to enumerate 15 leukocyte subsets in bulk RNA-seq or microarray profiles of peripheral blood samples from patients with either systemic lupus erythematosus (SLE; n = 239) or inflammatory bowel disease,, (IBD; n = 348) compared to healthy controls (Supplementary Table 20). For each dataset and cell subset, a two-sided, unpaired Wilcoxon rank sum test was applied to assess the difference in relative abundance between healthy and disease phenotypes. Results were subsequently combined across studies by meta-z statistics (Methods).
Fig. 1 |
Fig. 1 |. Study schema.
Overview of patients included in this study, summary of their irAE status, exclusion criteria and downstream analyses that were performed. Among 78 total eligible patients, 71 were evaluable for irAE analysis after exclusion criteria were applied. Further details are provided in the Methods and Supplementary Tables 1–3, 7–9 and 18. Created using icons from BioRender.com.
Fig. 2 |
Fig. 2 |. Analysis of pretreatment peripheral blood for cellular determinants of severe irAEs using mass cytometry.
a, Characteristics of the single-cell discovery cohort (Fig. 1), including the highest irAE grade experienced and durable clinical response status after the start of immunotherapy (related to Supplementary Tables 2 and 3). b, viSNE projection of peripheral blood cells analyzed by CyTOF. t-SNE, t-distributed stochastic neighbor embedding. c, Left: Heatmap showing the relative abundance of 20 cell states identified by CyTOF in 18 patients (Supplementary Table 5), grouped by future irAE status. Right: Association of cell state abundance with severe irAE development. Statistical significance was determined by a two-sided, unpaired Wilcoxon rank-sum test and expressed as directional −log10 P values. For associations with no severe irAE, −log10 P values were multiplied by −1. Q values were determined by the Benjamini–Hochberg method. d, Frequencies of CD4 TEM cells (CyTOF) in the pretreatment peripheral blood of patients stratified by future irAE status (no severe irAE, n = 10 patients; severe irAE, n = 8 patients). The box center lines, box bounds and whiskers denote the medians, first and third quartiles and minimum and maximum values, respectively. Statistical significance was determined by a two-sided, unpaired Wilcoxon rank-sum test.
Fig. 3 |
Fig. 3 |. Analysis of pretreatment peripheral blood for cellular determinants of severe irAEs using single-cell RNA and V(D)J sequencing.
a, UMAP of peripheral blood cells profiled by scRNA-seq from 13 patients coanalyzed by CyTOF (Fig. 2a and Supplementary Tables 1–3), colored by cell type, patient and state (n = 32). T/NKT, NK-like T cells. b, Cell state abundances (scRNA-seq) versus future irAE status and CD4 TEM cell frequencies (CyTOF). The former was quantified by a two-sided, unpaired Wilcoxon rank-sum test and expressed as −log10 P values. For associations with no severe irAE, −log10 P values were multiplied by −1. CD4 T cell states 5 and 3 are indicated together as CD4 T 5 + 3. c, Heatmap of DEGs (Padj < 0.05) between CD4 T cell states 5 and 3 and other CD4 T cell states. Within each state, the columns represent the mean expression from individual patients converted to z-scores. d, Left: Frequencies of candidate activated and resting subsets of CD4 T 5 + 3 cell states in 13 patients stratified by no severe (n = 7) and severe (n = 6) irAE status. Activation markers with counts per million (CPM) > 0 were considered expressed. Significance was determined by a two-sided, unpaired Wilcoxon rank-sum test. Right: Receiver operating characteristic curve plot showing the performance of the CD4 T 5 + 3 subsets (from the left panel) for predicting severe irAE development. NS, not significant. e, Pretreatment TCR clonotype diversity within each T cell state, total T cells, CD8 T cells, CD4 T cells and activated versus resting CD4 T 5 + 3 cells (defined as in d), grouped by future irAE status. TCR diversity was calculated for all patients with at least 100 TCR clones (n = 9; Methods). States are ordered by the AUC between TCR diversity and severe irAE status. f, Mean expression of key lineage and activation genes in CD4 T cell states. States within the box are consistent with TEM and TEM-like phenotypes. The box center lines, box bounds and whiskers indicate the medians, first and third quartiles and minimum and maximum values, respectively.
Fig. 4 |
Fig. 4 |. Integrative modeling for early irAE detection from bulk peripheral blood.
a, Association between pretreatment peripheral blood leukocyte composition (CIBERSORTx) and severe irAE development in bulk cohort 1 (n = 26 patients) and bulk cohort 2 (n = 27 patients) (Fig. 1 and Supplementary Tables 7 and 9). Significance was determined by a two-sided, unpaired Wilcoxon rank-sum test and expressed as −log10 P values. For associations with no severe irAE, −log10 P values were multiplied by −1. b, TCR clonotype diversity (Shannon entropy) in both bulk cohorts (n = 53 patients), stratified by future irAE status (no severe irAE, n = 36; severe irAE, n = 17). The box center lines, box bounds and whiskers denote the medians, first and third quartiles and minimum and maximum values, respectively. Significance was determined by a two-sided, unpaired Wilcoxon rank-sum test. c, Development of a composite model for the prediction of severe irAEs, integrating activated CD4 TM cell abundance and TCR clonotype diversity from pretreatment peripheral blood transcriptomes (Methods), with model scores trained on bulk cohort 1 and shown across both cohorts (Supplementary Table 9). The cut-point for high/low scores was optimized using Youden’s J statistic on bulk cohort 1 (Methods). d, Left: ROC plot showing composite model performance in bulk cohort 2 (held-out validation), whether applied to all patients (both therapies, n = 27), combination therapy patients (n = 11) or PD-1 monotherapy patients (n = 16). Right: ROC plot showing composite model performance in bulk cohorts 1 and 2, whether trained on PD-1 patients (n = 29) and tested on combination therapy patients (n = 24) or vice versa. The AUC is shown for each ROC curve. e, Composite model scores for all bulk cohort patients (n = 53) after model training for severe irAE development with LOOCV (Extended Data Fig. 7a and Supplementary Table 9), grouped by the highest irAE grade per patient. The box center lines, box bounds and whiskers indicate the medians, first and third quartiles and minimum and maximum values within 1.5× the interquartile range of the box limits, respectively. Statistical significance was determined by a Kruskal–Wallis test.
Fig. 5 |
Fig. 5 |. Correlates of severe irAE onset in patients treated with combined CTLA-4 and PD-1 blockade.
a, Pretreatment prediction of time-to-severe irAE onset in patients treated with combination therapy. The cut-point was optimized using composite model scores trained with LOOCV (Methods). Only patients from bulk cohorts 1 and 2 who did not experience early progression were analyzed (n = 23; Methods). b, TCR clonal dynamics in relation to severe irAE development in patients treated with combination therapy (Supplementary Table 18). Left: Change in TCR clonality from baseline after initiation of combination therapy as measured by 1 – Pielou’s evenness, with future irAE status indicated by color. Right: Same as the left but showing change in clonality according to future irAE status. Significance was determined by a two-sided, unpaired Wilcoxon rank-sum test. c, Enrichment of a CD4 T 5 + 3 gene signature in CD4 T cells from pretreatment PBMC samples obtained from 3 patients analyzed in b, all of whom developed severe irAEs and showed TCR clonal expansion after ICI initiation (Extended Data Fig. 9d). The box center lines, box bounds and whiskers indicate the medians, first and third quartiles and minimum and maximum values, respectively. The points denote cells profiled by scRNA-seq and annotated either by Azimuth (CD4 naive, n = 245 cells; CD4 TCM, n = 320 cells) or by their clonal persistence from baseline to early on-treatment time points (persistent CD4, n = 190 cells). The most persistent CD4 clonotypes in this analysis showed evidence of clonal expansion (Extended Data Fig. 9f,g). Significance was determined relative to persistent cells by a two-sided, unpaired Wilcoxon rank-sum test. ssGSEA, single-sample GSEA. d, Differences in freedom from severe irAE stratified by the degree of TCR clonal expansion after initiating combination therapy, as measured by the change in 1 – Pielou’s evenness. Patients were grouped into the following tertiles as detailed in Methods: no clonal expansion (n = 5), intermediate (n = 5) and high clonal expansion (n = 5). Statistical significance in a,d was assessed by a two-sided log-rank test.
Fig. 6 |
Fig. 6 |. Large-scale assessment of circulating leukocytes in autoimmune diseases.
Enrichment of circulating leukocyte levels in two autoimmune disorders relative to healthy controls. Leukocyte composition was determined by CIBERSORTx. Significance was determined by a two-sided, unpaired Wilcoxon rank-sum test and integrative meta z-score. Details of the analytical workflow and underlying datasets are provided in Extended Data Fig. 10 and Supplementary Table 20, respectively.

Comment in

References

    1. Kumar V et al. Current diagnosis and management of immune related adverse events (irAEs) induced by immune checkpoint inhibitor therapy. Front. Pharmacol 8, 49 (2017). - PMC - PubMed
    1. Larkin J et al. Combined nivolumab and ipilimumab or monotherapy in untreated melanoma. N. Engl. J. Med 373, 23–34 (2015). - PMC - PubMed
    1. Hodi FS et al. Nivolumab plus ipilimumab or nivolumab alone versus ipilimumab alone in advanced melanoma (CheckMate 067): 4-year outcomes of a multicentre, randomised, phase 3 trial. Lancet Oncol 19, 1480–1492 (2018). - PubMed
    1. Postow MA, Sidlow R & Hellmann MD Immune-related adverse events associated with immune checkpoint blockade. N. Engl. J. Med 378, 158–168 (2018). - PubMed
    1. Wolchok JD et al. Overall survival with combined nivolumab and ipilimumab in advanced melanoma. N. Engl. J. Med 377, 1345–1356 (2017). - PMC - PubMed

Publication types

Substances