. 2022 Feb;28(2):345-352.
doi: 10.1038/s41591-021-01621-1. Epub 2022 Jan 13.

HLA-independent T cell receptors for targeting tumors with low antigen density

Affiliations

HLA-independent T cell receptors for targeting tumors with low antigen density

Jorge Mansilla-Soto et al. Nat Med. 2022 Feb.

Abstract

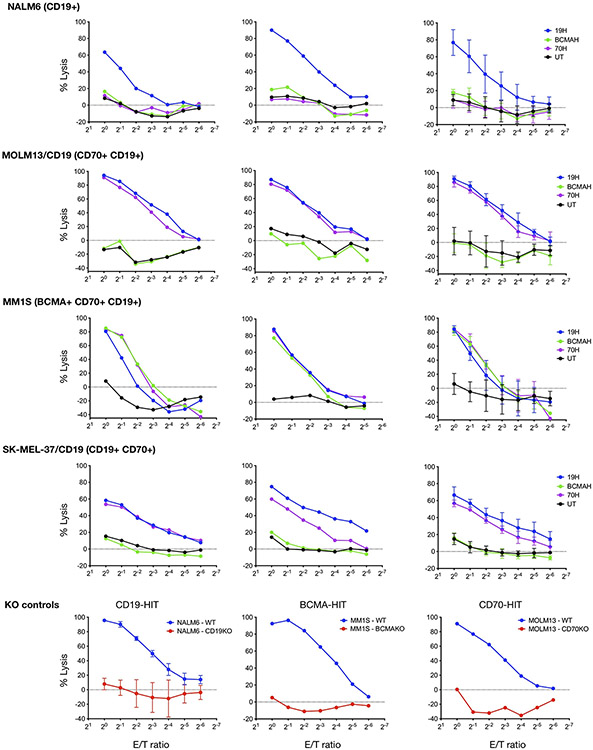
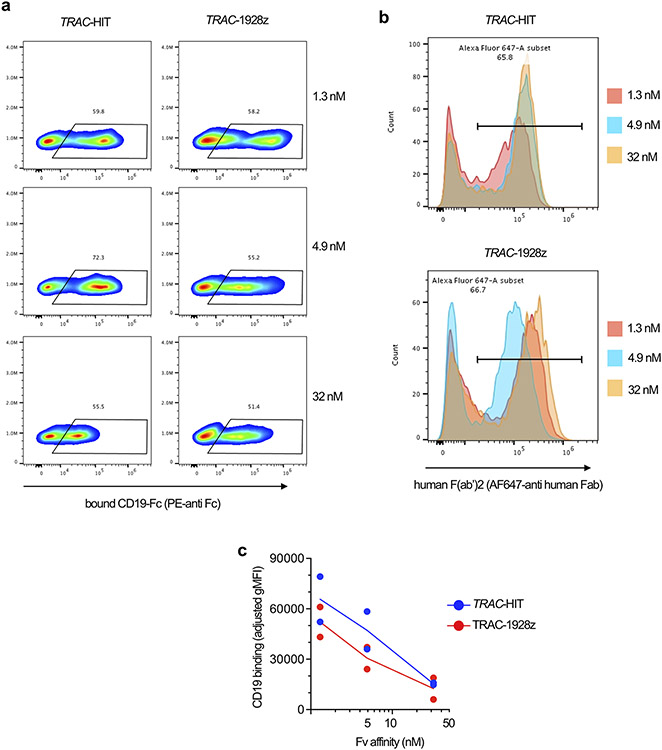
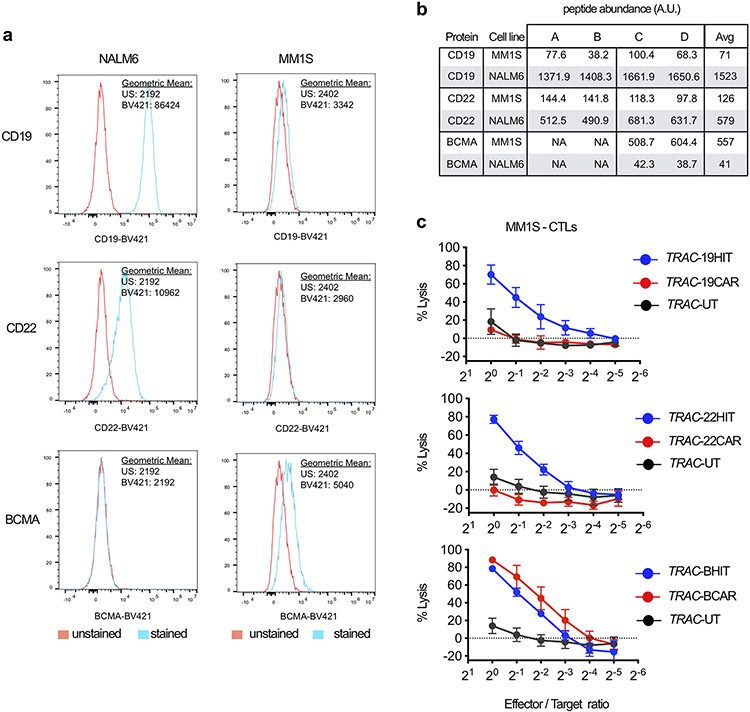
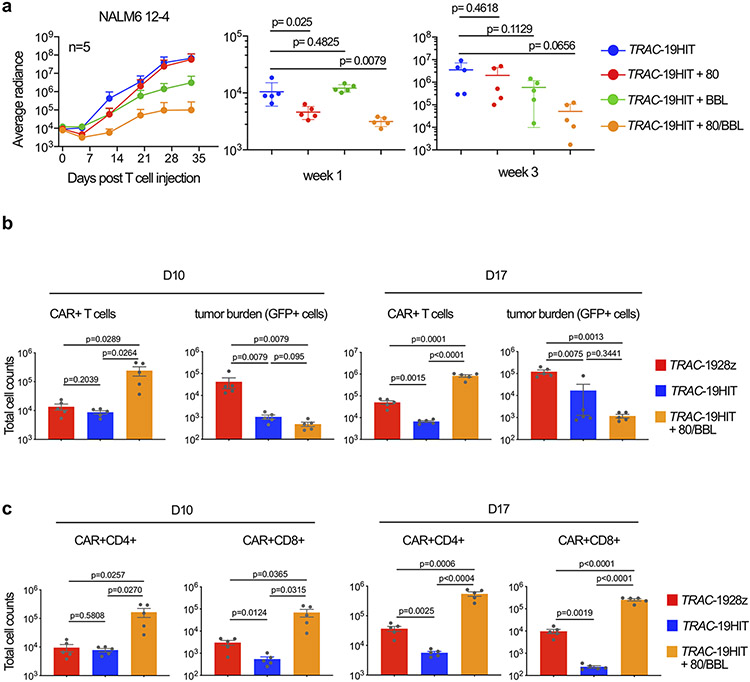
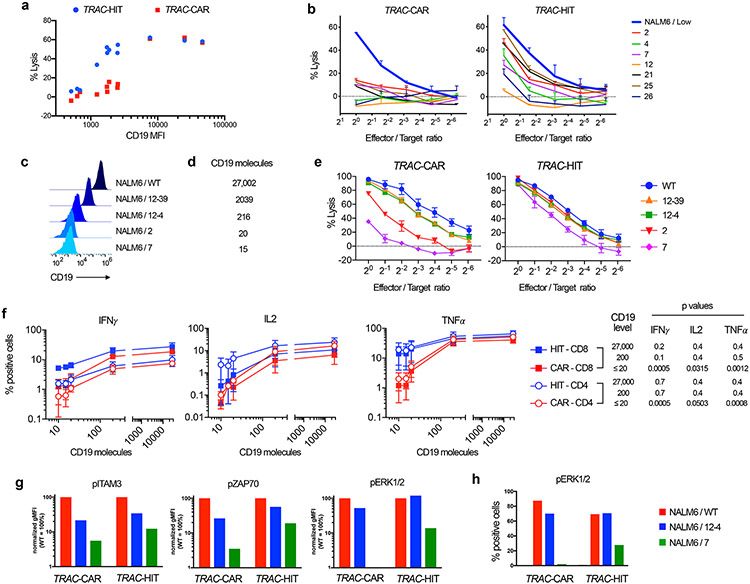
Chimeric antigen receptors (CARs) are receptors for antigen that direct potent immune responses. Tumor escape associated with low target antigen expression is emerging as one potential limitation of their efficacy. Here we edit the TRAC locus in human peripheral blood T cells to engage cell-surface targets through their T cell receptor-CD3 complex reconfigured to utilize the same immunoglobulin heavy and light chains as a matched CAR. We demonstrate that these HLA-independent T cell receptors (HIT receptors) consistently afford high antigen sensitivity and mediate tumor recognition beyond what CD28-based CARs, the most sensitive design to date, can provide. We demonstrate that the functional persistence of HIT T cells can be augmented by constitutive coexpression of CD80 and 4-1BBL. Finally, we validate the increased antigen sensitivity afforded by HIT receptors in xenograft mouse models of B cell leukemia and acute myeloid leukemia, targeting CD19 and CD70, respectively. Overall, HIT receptors are well suited for targeting cell surface antigens of low abundance.


Figures

Extended Data Fig. 1.
Extended Data Fig. 1.. HIT receptor expression driven by the TCRα promoter rescues CD3 expression and directs lysis of CD19+ target cells.
a. Representative flow cytometry analysis showing HIT, CAR, and CD3 expression. TRAC-HIT and TRAC-CAR T cells were generated as in Fig. 1b. CD3 surface expression is only observed in TRAC-HIT T cells due to the presence of Cα and Cβ in the HIT receptor. b. HIT/CAR mean fluorescence intensity (MFI) measured by FACS using AF647-GAM. (left) HIT/CAR histograms (representative experiment) and (right) HIT/CAR MFI; n = 6 independent experiments, 3 donors. c. Representative cytotoxic activity using an 18 h bioluminescence assay, using firefly luciferase (FFL)-expressing NALM6 as targets cells (n = 2 independent experiments on 3 healthy donors). CD19-specific TRAC-HIT and TRAC-CAR T cells were generated using two different CD19-specific binding domains, SJ25C1 and FMC63. All data are mean ± s.e.m.
Extended Data Fig. 2.
Extended Data Fig. 2.. HIT receptors provide antigen-specific T cell-mediated cytotoxicity.
Cytotoxic activity using an 18 h bioluminescence assay, using firefly luciferase (FFL)-expressing targets cells (n = 2 independent experiments on 2 healthy donors). CD19−, BCMA−, and CD70-specific TRAC-HIT T cells, and untransduced (UT) T cell controls were incubated with either NALM6 (CD19+), MOLM13/CD19 (CD70+, CD19+), MM1S (BCMA+, CD70+, CD19+), SK-MEL-37/CD19 (CD19+, CD70+), and knock-out (KO) control cell lines. CD19, BCMA, and CD70 genes were CRISPR/Cas9-edited in NALM6, MM1S, and MOLM13 cell lines, respectively. All data are mean ± s.e.m.
Extended Data Fig. 3.
Extended Data Fig. 3.. HIT receptor elicits cytokine response upon antigen stimulation; cell surface HIT receptor expression is modulated by exposure to antigen.
a. TRAC-Untransduced (UT), TRAC-HIT (HIT) and TRAC-CAR (CAR) T cells were stimulated on CD19+ target for 24h before supernatant were collected and analysed by flow cytometry to quantify IFNγ, IL-2, TNFα, and granzyme B (n= 3 independent experiments on 3 donors). b. TRAC-HIT and TRAC-CAR T cells stimulated on CD19+ target cells 1, 2 or 4 times over a 48h period were analysed by flow cytometry using the GAM, CD4, and CD8 antibodies. Plots indicate relative HIT or CAR MFI (1 = MFI at 0 h) of CD4 and CD8 TRAC-HIT or TRAC-CAR T cells, respectively. (n=3 independent experiments on 3 donors). c. Untransduced (UT), HIT and CAR T cells stimulated on CD19+ target cells either 0, 1, 2 or 4 times over a 48h period were analysed by flow cytometry. Plots indicate the percentage of the CAR positive T cells measured by flow cytometry analysis of CD4 and CD8 (n= 3 independent experiments on 3 donors). All data are mean ± s.e.m.
Extended Data Fig. 4.
Extended Data Fig. 4.. Antigen binding depends on HIT receptor affinity.
a. Representative flow cytometry analysis showing CD19 binding. TRAC-HIT and TRAC-CAR T cells were incubated with a recombinant human CD19-Fc fusion, which was then detected using an anti-hFc-PE antibody. b. HIT/CAR mean fluorescence intensity (MFI) measured by FACS using AF647-goat anti human (GAH) antibody (representative experiment). c. Plot of CD19 binding (adjusted gMFI) vs CD19 binder affinity (n=2 independent experiments). Geometric MFI for CD19 biding (PE signal from a.) was adjusted to the gMFI of the HIT/CAR receptor (AF647 signal from b.) All data are mean ± s.e.m.
Extended Data Fig. 5.
Extended Data Fig. 5.. HIT receptors provide greater antigen sensitivity than CARs.
a. Representative histogram of the CD19 expression in NALM6/WT, NALM6/Medium, NALM6/Low, and CRISPR-edited NALM6/Very Low (this study). b. NALM6/Very Low cells were used to generate single cell clones by limited dilution. CD19 expression was evaluated for each clone (blue histogram) along with the initial NALM6/Very Low cell population (red histogram); clone number indicated above the histogram plot. c. Schematics of the SIN lentiviral vector used to express low levels of CD19 in NALM6/12 cells. PGK100: short PGK promoter, which is a weak promoter. d. Panel of NALM6 cells expressing different CD19 levels, which is represented as a histogram. NALM6/12-4 and NALM6/12-39 are derivatives of NALM6/12, which was transduced with the lentiviral vector described in c. e. Total CD19 protein quantification using mass spectrometry. Protein levels are expressed in terms of peptide abundance (A.U.), which can be compared across all samples analysed at the same time. A-D represent 4 independent analyses. AVG, average of A-D values. f. Representative cytotoxic activity using an 18 h bioluminescence assay, using FFL-expressing NALM6 as targets cells (clone numbers as in b and d); n=2. CD19-specific TRAC-HIT and TRAC-CAR T cells were generated using two different CD19-specific binding domains, SJ25C1 and FMC63. Anova test was used to compare the CTL curves of all T cells for NALM6/2 and NALM6/7 cells. g. Representative cytotoxic activity using an 18 h bioluminescence assay, using FFL-expressing NALM6 as targets cells (same as in f); n=2. CD19-specific TRAC-1928z, TRAC-19BBz, and TRAC-19z1 T cells were prepared as described in materials and methods. Anova test was used to compare the CTL curves of all T cells for NALM6/2 cells. All data are mean ± s.e.m.
Extended Data Fig. 6.
Extended Data Fig. 6.. CD19, CD22, and BCMA HIT receptors elicit T cell-mediated lysis of multiple myeloma cells.
a. Representative flow cytometry analysis showing CD19, CD22, and BCMA expression in MM1S and NALM6/WT cells. b. Total CD19, CD22, and BCMA protein quantification using mass spectrometry. Protein levels are expressed in terms of peptide abundance (A.U.), which can be compared across all samples analysed at the same time. A-D represent 4 independent analyses. AVG, average of A-D values. c. Representative cytotoxic activity using an 18-h bioluminescence assay, using FFL-expressing MM1S as targets cells, which were incubated at the indicated E/T ratios with CD19−, CD22−, or BCMA-specific TRAC-HIT and TRAC-CAR T cells; n=3. All data are mean ± s.e.m. Additional specificity studies are shown in Extended Data Fig. 2.
Extended Data Fig. 7.
Extended Data Fig. 7.. HIT T cells show increased signalling response to low antigen levels.
a. Gating strategy used to quantify ITAM3, ZAP70, and ERK1/2 phosphorylation in TRAC-HIT/CAR T cells (histograms shown in b.). b. Representative flow cytometry analysis showing histograms for intracellular phospho-ITAM3, phospho-ZAP70, and phospho-ERK1/2 in TRAC-HIT (left) and TRAC-CAR (right) T cells when incubated with NAML6/WT, NALM6/12-4, or NALM6/7 target cells at 1:2 ratio for 15 min, or with no target (No stim.). FMO: fluorescence minus one control. Geometric MFIs were obtained for each curve, and used to generate the plots presented in Fig 2g. All data are mean ± s.e.m.
Extended Data Fig. 8.
Extended Data Fig. 8.. HIT T cells display increased degranulation upon stimulation.
a. Confocal and bright field images of conjugates of T cells expressing the CAR or HIT receptor and interacting for 30 min with NALM6/WT cells labeled for LAMP1 (red channel) and Alexa Fluor 546 phalloidin (actin staining showed in green). Quantification of the lysosome polarity assessed as the distance to the immune synapse and compared with the average lysosomal distance to the total cortex of the T cell. This distance was normalized with the maximum distance found in the T cell and expressed as a polarity index between 1 (lysosomes at the synapse) and 0 (lysosomes at the opposite of the synapse. Data from two independent experiments; n=59. Variance p-values were obtained by using unpaired t-test analysis. All data are mean ± s.e.m. Scale bar = 5μm. White arrows indicate LAMP-1 signal. b. FACS plot gates used to quantify T cell degranulation (CD107a+ cells). b. Representative (n=2 independent experiments) analyses of CD107a levels in TRAC-HIT (top) and TRAC-CAR (bottom) T cells when incubated for 1h (left) or 4h (right) without or with NALM6 targets of different CD19 levels.
Extended Data Fig. 9.
Extended Data Fig. 9.. Control of low-antigen tumours by HIT T cells is enhanced by extending T cell persistence by co-expression of CD80 and 4-1BBL.
a. NALM6/12-4-bearing mice were treated with 4x10⁵ TRAC-HIT T cells co-expressing the annotated costimulatory ligand. Tumour burden was quantified weekly over a 35-day period, at week 1 or week 3. Each line represents 5 mice. b. NALM6/12-4-bearing mice were treated with 4×10⁵ CAR T cells (n=5 per group; dot = one mouse) and euthanized at days 10 and 17 after infusion; bone marrow TRAC-HIT or TRAC-CAR T cells and NALM6 cells were analysed and counted by FACS. c. Same as in b, except that bone marrow TRAC-HIT or TRAC-CAR CD4 and CD8 T cells counted by FACS. Two-tailed unpaired Student's t-tests were used for statistical analyses. All data are mean ± s.e.m. Tumor burden of individual animals are shown in Supplementary Fig. 2.
Extended Data Fig. 10.
Extended Data Fig. 10.. Co-expression of costimulatory ligands CD80 and 4-1BBL enhances the therapeutic potential of HIT cells.
a. Tumour burden (average radiance) of NALM6/12-4-bearing mice treated with 4 × 10⁵ TRAC-HIT or TRAC-CAR T cells (n = 5), analysed through a 35-day period. b. Tumour burden (average radiance) of MM1S-bearing mice treated with 2 × 10⁵ TRAC-HIT or TRAC-CAR T cells (n = 5), analysed through a 35-day period. c. Kaplan-Meier analysis of survival of MM1S-bearing mice treated with 4 × 10⁵ BCMA-specific TRAC-HIT or TRAC-HIT+80/BBL T cells (n = 5). d. Representative FACS plots of surface CD70 expression in activated CAR-T cells 4 days after electroporation without (mock) or with CD70-specific CRISPR/Cas9 RNP. e. Tumour burden (average radiance) of MOLM13-bearing mice treated with 4 × 10⁵ TRAC-HIT or RV-CAR T cells (n = 5), analysed through a 35-day period. All data are mean ± s.e.m. Tumor burden of individual animals are shown in Supplementary Figs. 2,3.
Figure 1.
Figure 1.. TRAC locus editing to create an HLA-independent TCR (HIT receptor) directs TCR/CD3 complex-mediated antigen recognition
a. Schematic of the targeting strategy to generate a HIT receptor in situ at the TRAC locus. The targeting construct (HIT-AAV) contains a splice acceptor, followed by P2A cleaving peptide and the CD19-specifc HIT gene elements (a VH-Cβ gene followed by P2A and the VL gene), which are joined to the TRAC exon 1; all flanked by sequences homologous to the TRAC locus (left and right homology arm: LHA and RHA). Once integrated, the VH-Cβ and VL-Cα expression is driven by the endogenous TCRα promoter and polyA elements, while TCRα expression is disrupted. VH-Cβ and VL-Cα chains will associate to form the HIT heterodimer. The TCR/CD3 complex is depicted to highlight the similarities and contrast between HIT and TCR. The 19-28z CAR, utilizing the same VH and VL elements in the format of an scFv, is also depicted. TRAV: TCR alpha variable region. TRAJ: TCR alpha joining region. SA: Splice acceptor. P2A: Porcine teschovirus 2A sequence. b. Representative TCRαβ/F(ab')2 flow plot 4 days after transfection of T cells with TRAC-targeting CRISPR/Cas9 and HIT or CAR AAV6 transduction. c. Cytotoxic activity using an 18-hr bioluminescence assay. Firefly luciferase (FFL)- and CD19-expressing NALM6 (left), or FFL-expressing PC3 (CD19 negative, right) as targets cells (n=2 biological independent samples); additional specificity studies are shown in Extended Data Fig 2. d. Binding capacity of HIT and CAR T cells measured by titrating CD19-Fc fusion. TRAC-HIT and TRAC-CAR T cells from 2 different donors were incubated with a recombinant human CD19-Fc fusion, which was then detected using an anti-hFc-PE antibody. Left panel: % positive cells detected; right panel: mean fluorescent intensity (MFI) of the bound CD19-Fc. e. Representative cytotoxic activity using an 18 h bioluminescence assay, using firefly luciferase (FFL)-expressing NALM6 as targets cells (n = 4 independent experiments on 4 healthy donors). CD19-specific TRAC-HIT and TRAC-CAR T cells were generated using three different binding domains specific to a CD19 epitope but of distinct affinities (1.3, 4.9, and 32 nM). All data are mean ± s.e.m.
Figure 2.
Figure 2.. TRAC-HIT T cells exhibit increased sensitivity for tumour cells expressing low antigen levels relative to TRAC-CAR T cells.
a. Cytotoxic activity using a 4-hr bioluminescence assay at a 1:1 ratio of TRAC-HIT/TRAC-CAR T cells (effectors) and FFL+NALM6 cells expressing different CD19 surface levels (targets). (Average killing and MFI from n = 2 independent experiments on 2 donors). b. Representative cytotoxic activity using an 18 h bioluminescence assay, using FFL-expressing NALM6 clones as targets cells (clone numbers as in Extended Data Fig. 5b); NALM6/Low was used as positive control; n=2 biological independent samples. c. CD19 flow histograms for WT and NALM6 clones expressing decreasing levels of CD19. d. Quantification of surface CD19 levels using FACS and PE-calibration beads. NALM6 cells were stained PE-anti CD19 antibody. CD19 geometric MFIs (gMFIs) for NALM6/WT, NALM6/12-39, and NALM6/12-4 were used to determine the number of CD19 molecules per cells using the standard curve obtained with the calibration beads. CD19 gMFIs for NALM6/2, NALM6/7, NALM6/12 were used to establish a ratio with NALM6/12-4 since their values were outside the linear range of the standard curve. e. Cytotoxic activity using an 18-h bioluminescence assay at different effector:target ratios for TRAC-HIT/TRAC-CAR T cells and FFL+NALM6 cells expressing different CD19 surface levels (panel c); n=2 biological independent samples. f. Percentage of TRAC-HIT or TRAC-CAR T cells (both CD4 and CD8 cells) with positive expression of IFNγ, IL-2 or TNFα after intracellular staining after co-culture with NALM6 clones expressing the indicated levels of CD19. Right, Mann-Whitney p values when using NALM6 WT (27,000), NALM6 12-4 (200), and NALM6 12, 7, and 2 (≤20) target cells. n= 3 independent experiments on 3 different T cell donors. g. and h. Levels of phospho-ITAM3, phospho-ZAP70, or phospho-ERK1/2 in TRAC-HIT or TRAC-CAR T cells when incubated with NALM6 WT, 12-4 or 7 targets at a 1:2 ratio. g. Levels are presented as a percentage of the signal detected in T cells incubated with NALM6 WT target. h. Percentage of TRAC-HIT or TRAC-CAR T cells containing phospho-ERK1/2. g. and h. The data presented are representative of 2 independent experiments using 2 different T cell healthy donors. Except for g. and h. all data are mean ± s.e.m.
Figure 3.
Figure 3.. TRAC-HIT T cells exhibit increased degranulation and rapid killing activity upon exposure to low antigen levels.
a. Summary of the quantitative phospho-proteomic analysis. Heavy amino acid-labelled NALM6/7 cells were incubated with either TRAC-HIT or TRAC-CAR T cells for 10 min. Purified phospho (P)-peptides were analysed by mass spectrometry. Volcano plot shows total and enriched P-peptides in TRAC-HIT (blue square) and TRAC-CAR (red square) T cells. b. P-peptides (two independent experiments; two different healthy T cell donors) with a p<0.05 (−log10>1.3) are plotted as log2 HIT/CAR (experiment 1 vs experiment 2); p-values were calculated by paired t-test analysis (integrated in Proteome Discoverer software). P-peptides enriched in TRAC-HIT (blue square) T cells are shown at the right. c. Representative confocal and bright field images of conjugates of CAR or HIT T cells interacting for 30 min with NALM6/7 or NALM6/WT cells (blue) labeled with goat anti-mouse (red) and phalloidin (green). Quantification of actin (upper panel) and CAR/HIT (lower panel) mean fluorescence intensity at the immune synapse region, divided by the mean intensity measured in the total T cell cortex. Each dot represents one cell; horizontal lines=median. Scale bars=5μm. Data from two independent experiments; n=60. **P<0.01, ns: non-significant (Mann-Withney test). d. Confocal and bright field images of CAR or HIT T cell conjugates interacting for 30 min with NALM6/7 cells labeled for LAMP1 (red) and actin (green). Quantification of lysosome polarity (distance to the immune synapse compared to average lysosomal distance to the total T cell cortex). This distance was normalized with the maximum distance found in the T cell and expressed as a polarity index between 1 (lysosomes at the synapse) and 0 (lysosomes at the opposite of the synapse). Data from two independent experiments; n=59. P-values obtained by unpaired t-test analysis. Scale bars=5μm. White arrows indicate LAMP-1 signal. e. Degranulation measured by CD107a staining upon incubating HIT/CAR T cells for 1h and 4h with NALM6 cells of different CD19 levels. P-values obtained by unpaired t-test analysis; n=2 biological independent samples, and data is representative of 2 independent experiments. Asterisk (*) represents a p value of <0.05. f. Single-cell time-lapse imaging cytotoxicity assay. Time from conjugate formation to propidium iodide (PI) influx in target cells; left: NALM6/WT (HIT, n=93; CAR, n=78), middle NALM6/12-4 (HIT, n=53; CAR, n=57), right NALM6/7 (HIT, n=104; CAR, n=94). For each target cell: 2 independent experiments with 2 T cell donors. P-values obtained by unpaired t-test analysis; asterisk (*) means p<0.05; ns: not significant. All data are mean ± s.e.m.
Figure 4.
Figure 4.. TRAC-HIT T cells outperform TRAC-CAR T cells in controlling low-antigen tumour cells in vivo.
a. Tumour burden (average radiance) of NALM6 WT-bearing mice treated with 5 × 10⁵ TRAC-HIT or TRAC-CAR T cells (n = 5), analysed through a 35-day period, at week 1 or week 3. Quantification is the average photon count of ventral and dorsal acquisitions per animal at all given time points. A two-tailed unpaired t-test was used to compare each group pair. b. Tumour burden (average radiance) of NALM6/12-4-bearing treated with 4 × 10⁵ TRAC-HIT or TRAC-CAR T cells (n = 15), analysed through a 35-day period, at week 1 or week 3. A two-tailed unpaired t-test was used to compare each group pair. c. Kaplan-Meier analysis of survival of NALM6/12-4-bearing mice treated with 4 × 10⁵ TRAC-HIT or TRAC-CAR T cells (n = 15). d. Kaplan-Meier analysis of survival of MM1S-bearing mice treated with 2 × 10⁵ TRAC-HIT or TRAC-CAR T cells (n = 5). e. CD70 flow histograms for MOLM13 cells in vitro and ex-vivo (from mouse bone marrow samples), and non-activated T cells (negative control). f. Cytotoxic activity using an 18-h bioluminescence assay at different effector:target ratios for TRAC-70HIT/RV-CAR T cells (7028z and 7028z1xx) and FFL+ MOLM13 cells; n=3. Additional specificity studies are shown in Extended Data Fig. 2. g. Kaplan-Meier analysis of survival of MOLM13-bearing mice treated with 4 × 10⁵ TRAC-HIT or TRAC-CAR T cells (n = 5). c, d, and g. P values were determined by a log-rank Mantel-Cox test (survival). All data are mean ± s.e.m. Tumor burden of individual animals are shown in Supplementary Figs. 1-3.

References

    1. Sadelain M, Riviere I & Riddell S Therapeutic T cell engineering. Nature 545, 423–431, doi:10.1038/nature22395 (2017). - DOI - PMC - PubMed
    1. Eshhar Z et al. The T-body approach: potential for cancer immunotherapy. Springer seminars in immunopathology 18, 199–209, doi:10.1007/BF00820666 (1996). - DOI - PubMed
    1. Sadelain M, Riviere I & Brentjens R Targeting tumours with genetically enhanced T lymphocytes. Nature reviews. Cancer 3, 35–45, doi:10.1038/nrc971 (2003). - DOI - PubMed
    1. Maher J, Brentjens RJ, Gunset G, Riviere I & Sadelain M Human T-lymphocyte cytotoxicity and proliferation directed by a single chimeric TCRzeta /CD28 receptor. Nature biotechnology 20, 70–75, doi:10.1038/nbt0102-70 (2002). - DOI - PubMed
    1. van der Stegen SJ, Hamieh M & Sadelain M The pharmacology of second-generation chimeric antigen receptors. Nature reviews. Drug discovery 14, 499–509, doi:10.1038/nrd4597 (2015). - DOI - PMC - PubMed

Methods-Only References

    1. Hendel A et al. Chemically modified guide RNAs enhance CRISPR-Cas genome editing in human primary cells. Nature biotechnology 33, 985–989, doi:10.1038/nbt.3290 (2015). - DOI - PMC - PubMed
    1. Papapetrou EP et al. Genomic safe harbors permit high beta-globin transgene expression in thalassemia induced pluripotent stem cells. Nature biotechnology 29, 73–78, doi:10.1038/nbt.1717 (2011). - DOI - PMC - PubMed
    1. Rivière I, Brose K & Mulligan RC Effects of retroviral vector design on expression of human adenosine deaminase in murine bone marrow transplant recipients engrafted with genetically modified cells. Proc. Natl Acad. Sci. USA 92, 6733–6737 (1995). - PMC - PubMed
    1. Navarrete-Perea J, Yu Q, Gygi SP & Paulo JA Streamlined Tandem Mass Tag (SL-TMT) Protocol: An Efficient Strategy for Quantitative (Phospho)proteome Profiling Using Tandem Mass Tag-Synchronous Precursor Selection-MS3. Journal of proteome research 17, 2226–2236, doi:10.1021/acs.jproteome.8b00217 (2018). - DOI - PMC - PubMed
    1. Zucchetti AE, Bataille L, Carpier JM, Dogniaux S, San Roman-Jouve M, Maurin M, Stuck MW, Rios RM, Baldari CT, Pazour GJ, Hivroz C Tethering of vesicles to the Golgi by GMAP210 controls LAT delivery to the immune synapse. Nat Commun. 10, 2864. doi:10.1038/s41467-019-10891-w (2019). - DOI - PMC - PubMed

Publication types