. 2022 Feb;25(2):191-200.
doi: 10.1038/s41593-021-00982-7. Epub 2022 Jan 13.

The preference for sugar over sweetener depends on a gut sensor cell

Affiliations

The preference for sugar over sweetener depends on a gut sensor cell

Kelly L Buchanan et al. Nat Neurosci. 2022 Feb.

Abstract

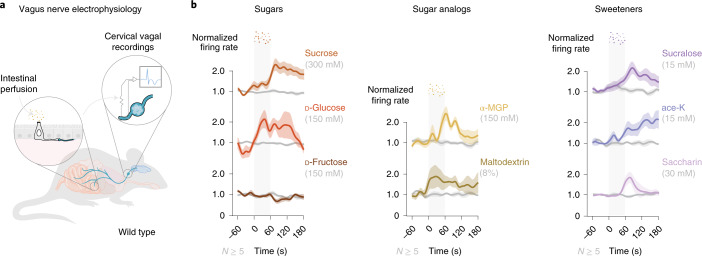
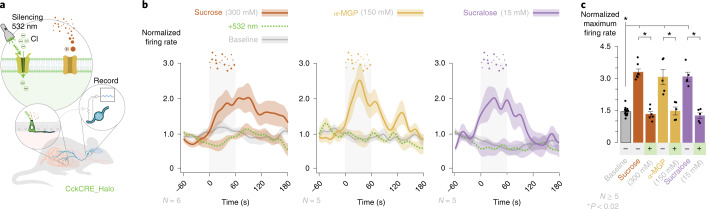
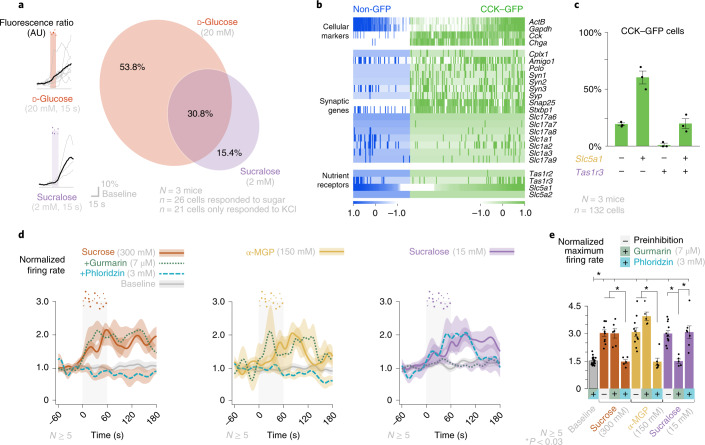
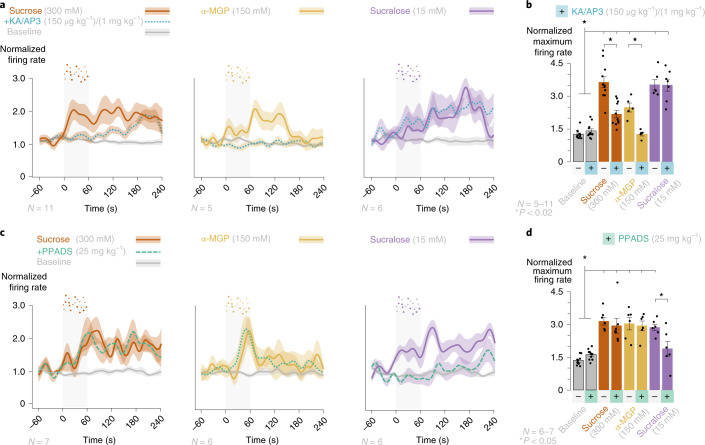
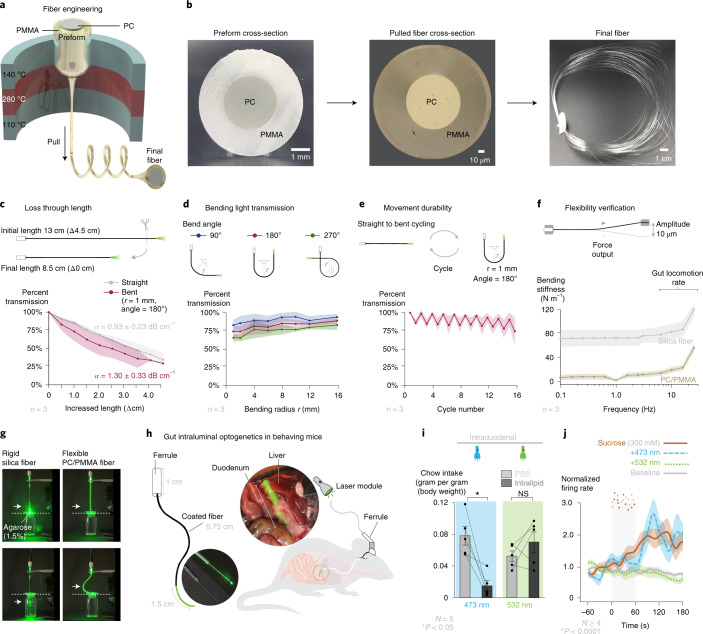
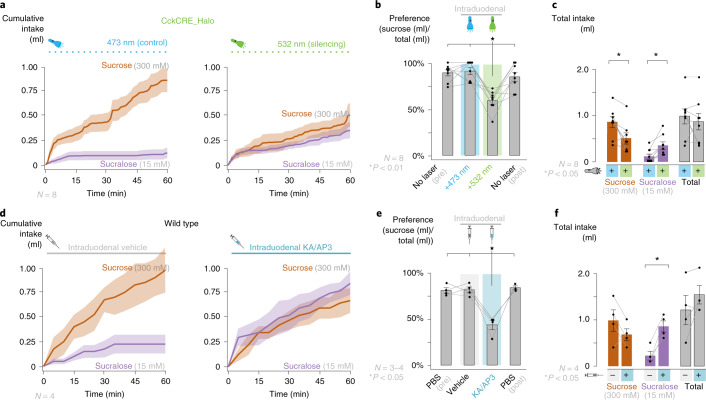
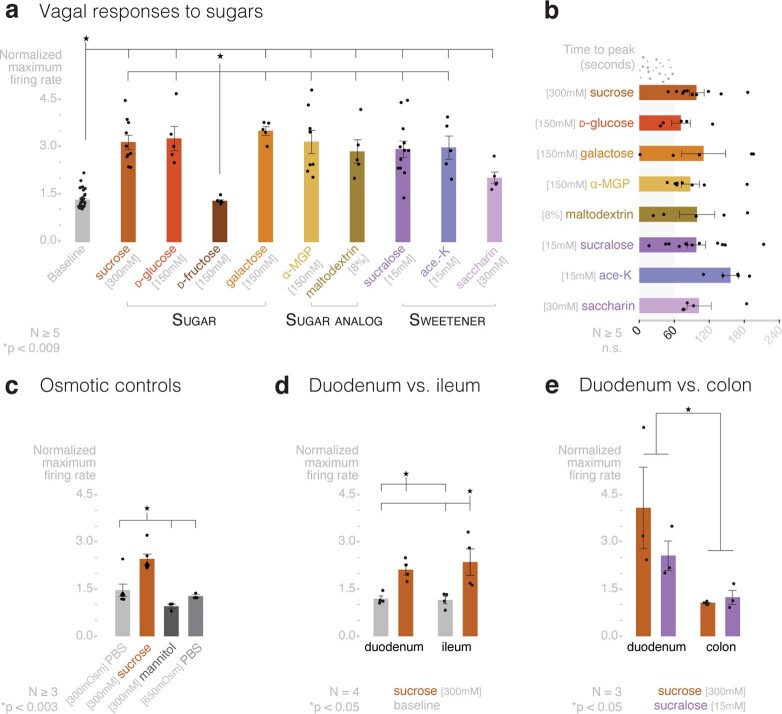
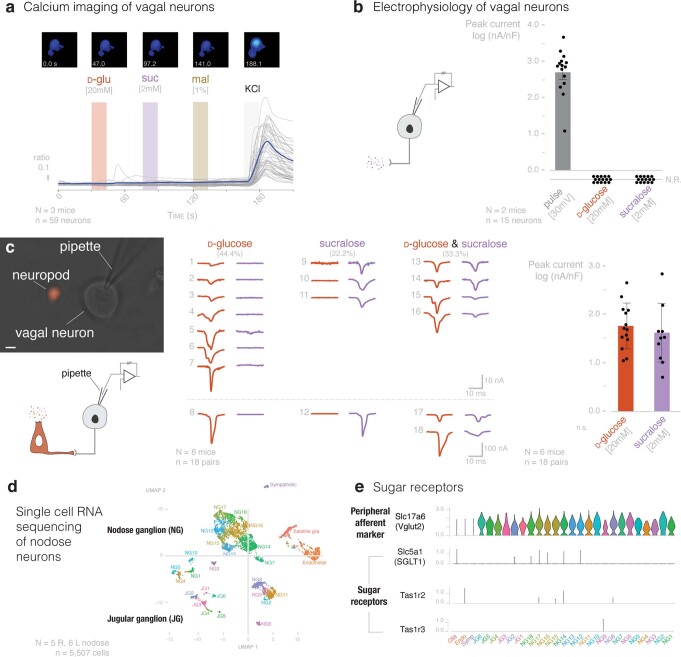
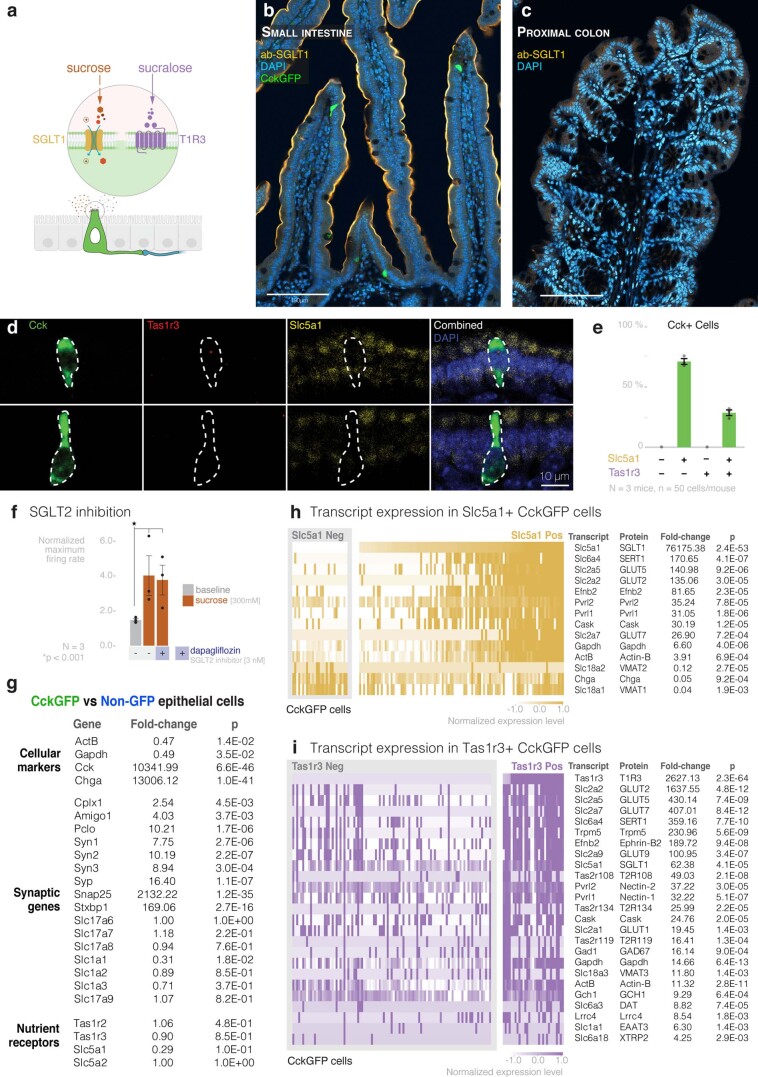
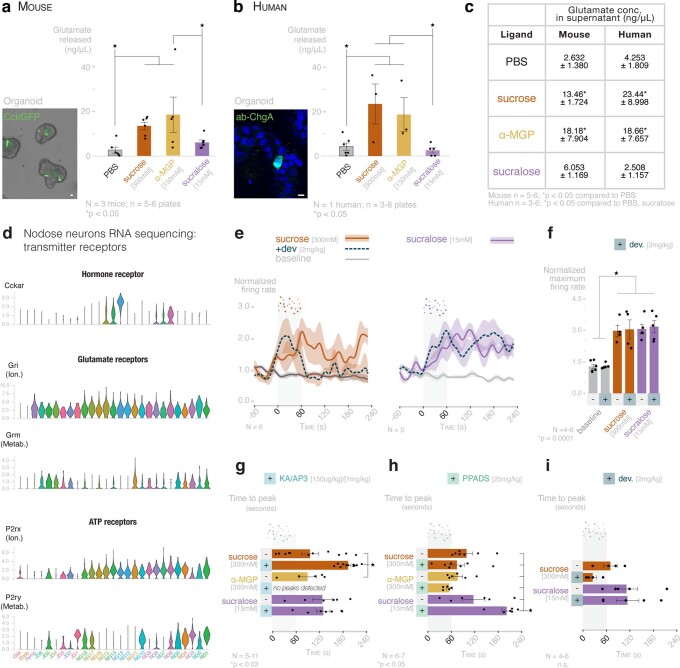
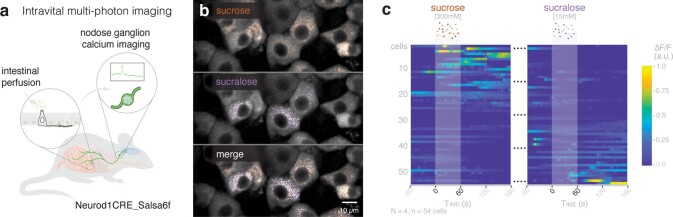
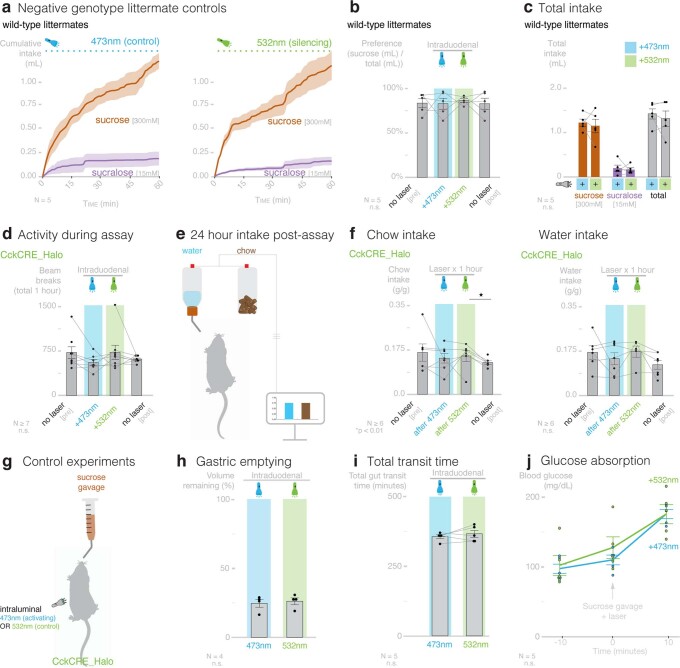
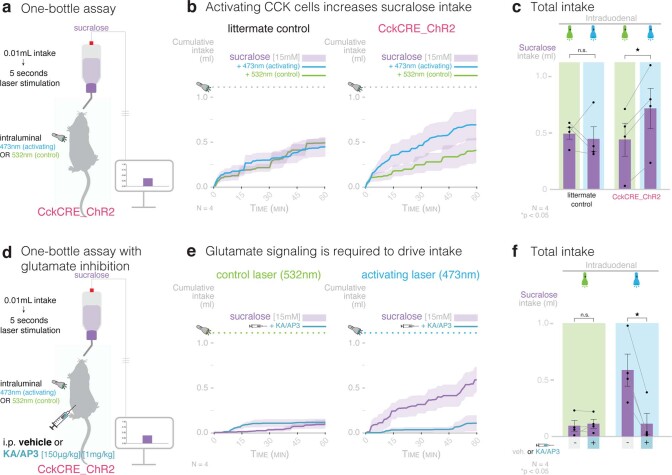
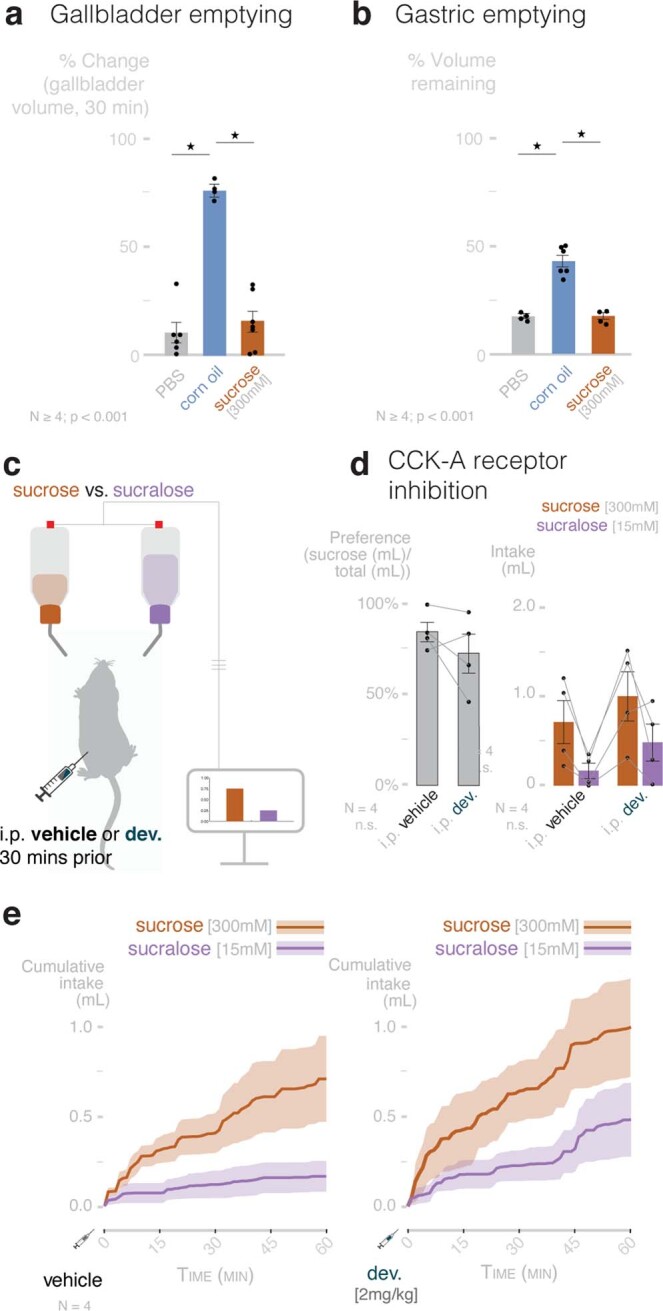
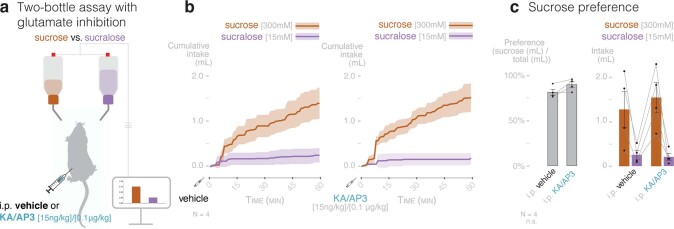
Guided by gut sensory cues, humans and animals prefer nutritive sugars over non-caloric sweeteners, but how the gut steers such preferences remains unknown. In the intestine, neuropod cells synapse with vagal neurons to convey sugar stimuli to the brain within seconds. Here, we found that cholecystokinin (CCK)-labeled duodenal neuropod cells differentiate and transduce luminal stimuli from sweeteners and sugars to the vagus nerve using sweet taste receptors and sodium glucose transporters. The two stimulus types elicited distinct neural pathways: while sweetener stimulated purinergic neurotransmission, sugar stimulated glutamatergic neurotransmission. To probe the contribution of these cells to behavior, we developed optogenetics for the gut lumen by engineering a flexible fiberoptic. We showed that preference for sugar over sweetener in mice depends on neuropod cell glutamatergic signaling. By swiftly discerning the precise identity of nutrient stimuli, gut neuropod cells serve as the entry point to guide nutritive choices.


Conflict of interest statement

Some of the findings have been filed by D.V.B. as a provisional patent application (MBF reference number 028193-9344-US01). All other authors declare no competing interests.

Figures

Fig. 1
Fig. 1. The vagus nerve responds to sugars and sweeteners.
a, In anesthetized wild-type mice, stimuli were perfused through the duodenum from the pylorus to the ligament of Treitz, while electrical activity was recorded from the cervical vagus nerve. b, Vagal responses to intraduodenal stimuli, including baseline (PBS, gray traces), sucrose (300 mM) (N = 10), d-glucose (150 mM) (N = 5), d-fructose (150 mM) (N = 5), α-MGP (150 mM) (N = 8), maltodextrin (8%) (N = 5), sucralose (15 mM) (N = 11), acesulfame K (ace-K) (15 mM) (N = 5) and saccharin (30 mM) (N = 5), are shown. Peak responses and time to peak are quantified in Extended Data Fig. 1a,b. All peak responses except d-fructose were significant compared to baseline using a Kruskal–Wallis test with non-parametric comparisons using the Wilcoxon method. Gray vertical bars indicate infusion, the bold line indicates the mean, and shaded regions indicate s.e.m.
Fig. 2
Fig. 2. The vagal response to sugars, sugar analogs and non-caloric sweeteners depends on duodenal CCK-labeled neuropod cells.
a, In CckCRE_Halo mice, vagal responses to intraduodenal stimuli were recorded, while CCK-labeled neuropod cells were simultaneously silenced with 532-nm light. b, Vagal responses to baseline (PBS), sucrose (300 mM) (N = 6), α-MGP (150 mM) (N = 5) and sucralose (15 mM) (N = 5) with and without intraluminal optical inhibition with 532-nm light. c, Quantification of peak responses (*P < 0.02 by Kruskal–Wallis test with non-parametric comparisons using Wilcoxon methods). Inhibition with 532-nm light significantly suppressed peak responses when delivered with intraluminal infusion of sucrose (P = 0.0034), α-MGP (P = 0.0122) and sucralose (P = 0.0122). In vitro coculture electrophysiology confirmed the dependence of vagal nodose neuron response to sugars on neuropod cells; see Extended Data Fig. 2c. Gray vertical bars indicate infusion, the bold line indicates the mean, and the shaded regions/error bars indicate s.e.m.
Fig. 3
Fig. 3. Duodenal neuropod cells discern sugar from sweetener.
a, In CckCRE_tdTomato cells loaded with Fluo-4/Fura Red dye, calcium activity was imaged in response to d-glucose (20 mM) and sucralose (2 mM). Individual traces (left) and a Venn diagram illustrating overlap (right) are shown (N = 3 mice; n = 26 cells responded to d-glucose or sucralose, n = 21 cells responded to only KCl). No vagal neurons responded to stimuli, as shown in Extended Data Fig. 2a,b; F-Ratio, fluorescence intensity ratio of Fluo-4 divided by Fura Red. AU, arbitrary units. b, Heat map of gene expression in CCK–GFP and non-GFP intestinal epithelial cells by single-cell real time quantitative PCR (single cell RT–qPCR). Compared to non-GFP cells (n = 66), CCK–GFP cells (n = 132) overexpress genes associated with synapse formation (Amigo1, Pclo, Syn1Syn3) and genes associated with vesicular function/release (Cplx1, Syp, Snap25, Stxbp1) (N = 3 mice; fold changes and P values are shown in Extended Data Fig. 3d). c, Of 132 CCK–GFP cells, 19.1 ± 1.2% express transcripts for neither Slc5a1 (SGLT1) nor Tas1r3 (T1R3), 60.1 ± 5.7% for only Slc5a1, 1.2 ± 1.2% for only Tas1r3 and 19.6 ± 4.3% for both (N = 3 mice). d, Vagal responses to baseline (PBS) and stimuli perfused with and without the SGLT1 inhibitor phloridzin (3 mM) (sucrose (300 mM) N = 5, α-MGP (150 mM) N = 6, sucralose (15 mM) N = 7) or sweet taste inhibitor gurmarin (7 μM) (sucrose (300 mM) N = 6, α-MGP (150 mM) N = 5, sucralose (15 mM) N = 5). e, Quantification of peak vagal responses (*P < 0.03 by Kruskal–Wallis test with non-parametric comparisons using the Wilcoxon method). Phloridzin suppressed peak responses to sucrose (P = 0.0122) and α-MGP (P = 0.0131) but not sucralose (P = 0.5229). Gurmarin suppressed peak responses to sucralose only (P = 0.0122). Gray vertical bars indicate the infusion period, the bold line indicates the mean, and shaded regions/error bars indicate s.e.m.
Fig. 4
Fig. 4. Sucrose and sucralose are transmitted to the vagus nerve by distinct neurotransmitters.
a, Vagal responses to baseline (PBS), sucrose (300 mM), α-MGP (150 mM) and sucralose (15 mM) before and after inhibition of ionotropic/metabotropic glutamate receptors by KA (150 μg kg–1) with AP3 (1 mg kg–1). b, Quantification of peak responses to sucrose (N = 11), α-MGP (N = 5) and sucralose (N = 6) before and after glutamate receptor inhibition (*P < 0.02 by Kruskal–Wallis test with non-parametric comparisons using the Wilcoxon method). Glutamate receptor inhibitors significantly suppressed peak responses to sucrose (P = 0.0002) and α-MGP (P = 0.0122) but not sucralose (P = 0.9278). Time to peak vagal response is quantified in Extended Data Fig. 4g. c, Vagal responses to baseline, sucrose, α-MGP and sucralose before and after inhibition of P2 purinergic receptors with pyridoxalphosphate-6-azophenyl-2′,4′-disulfonic acid (PPADS; 25 mg kg–1). d, Quantification of peak responses to sucrose (N = 7), α-MGP (N = 6) and sucralose (N = 6) before and after purinergic receptor inhibition (*P < 0.05 by by Kruskal–Wallis test with non-parametric comparisons using the Wilcoxon method). PPADS significantly suppressed peak responses to sucralose (P = 0.0453) but not to sucrose (P = 0.1252) or α-MGP (P = 0.6889). Time to peak vagal response is quantified in Extended Data Fig. 4h. Gray vertical bars indicate infusion, the bold line indicates the mean, and shaded regions/error bars indicate s.e.m.
Fig. 5
Fig. 5. Development of a flexible fiberoptic device for optogenetic targeting of gut neuropod cells.
a, Model of the thermal drawing process to obtain a flexible PC/PMMA fiber. b, Cross-section of the PC/PMMA preform (left), pulled PC/PMMA fiber (middle) and ~50-m fiber bundle (right). c, Light transmission for straight and bent flexible fibers using the cut-back method plotted as percentage of light output (y axis) from shortest length (∆0 cm). Loss coefficients (α) were determined as 0.93 dB cm–1 and 1.30 dB cm–1 for straight and bent fibers, respectively; r, radius. d, Light transmission for fibers bent at 90°, 180° and 270° at different radii of curvature (x axis) plotted as percentage of light output from a straight fiber (y axis). e, Light transmission for fibers during cyclic bending at 180° (odd cycles, straight; even, bent) plotted as percentage of light output from initial position (cycle = 0). f, The flexibility of silica and PC/PMMA fiber was measured by a dynamic mechanical analyzer at physiologic frequencies. For cf, n = 3 fibers, the bold line indicates the mean, and the shaded regions indicate s.d. g, A conventional silica fiber pierces an agarose (1.5%) membrane, while the PC/PMMA flexible fiber bends and does not pierce the membrane. h, The flexible fiber was implanted into mice to target the lumen of the proximal duodenum. i, To validate the device in a known function of CCK-labeled neuropod cells, CckCRE_Halo mice received intragastric gavage of intralipid (7%, 0.1 ml per 10 g) with control 473-nm light, which reduced chow intake. This effect was reversed when CCK-labeled neuropod cells were silenced with 532-nm light (N = 5 mice; *P = 0.0193 by analysis of variance (ANOVA) with post hoc two-tailed paired Student’s t-test; error bars indicate s.e.m.); NS, not significant. j, To validate device longevity, vagal responses to baseline (PBS), sucrose without light, sucrose with control 473-nm light and sucrose with silencing 532-nm light were recorded in CckCRE_Halo mice 4 weeks after fiber implantation (N ≥ 4 mice per group; the bold line indicates the mean, and the shaded region indicates s.e.m.).
Fig. 6
Fig. 6. Sugar preference depends on duodenal neuropod cells.
Mice with a stable preference for sucrose over sucralose chose between the two solutions during optogenetic (ac) or pharmacologic (df) inhibition in a 1-h two-bottle choice assay. a, In CckCRE_Halo mice implanted with a flexible fiberoptic, average traces show sucrose and sucralose consumption in the presence of intraduodenal control 473-nm (left) or silencing 532-nm (right) light. For littermate controls, see Extended Data Fig. 6a–c. b, Quantification of preference at 1 h with no laser (pretest/posttest) and with control 473-nm light and silencing 532-nm light. Silencing 532-nm light significantly reduced sucrose preference compared to pretest (P = 0.0012), posttest (P = 0.0057) and control 473-nm light (P = 0.0003). c, Quantification of total intake during optogenetic silencing at 1 h. Silencing 532-nm light significantly decreased sucrose intake (P = 0.0224) and increased sucralose intake (P = 0.048) with no change in total intake (P = 0.4347). For ac, N = 8 CckCRE_Halo mice; *P < 0.05 by repeated measures ANOVA with post hoc two-tailed paired t-test. d, In wild-type mice with intraduodenal catheters, average traces show sucrose and sucralose consumption in the presence of vehicle (PBS + NaOH, pH 7.4; left) or local dose of ionotropic/metabotropic glutamate receptor inhibitors KA/AP3 (15 ng per 0.1 μg in 0.4 ml delivered over 1 h; right). For control of the local effect in duodenum, see Extended Data Fig. 9. e, Quantification of preference at 1 h with PBS (pretest/posttest), vehicle and glutamate receptor inhibitors KA/AP3. KA/AP3 significantly reduced sucrose preference compared to pretest (P = 0.0294), posttest (P = 0.0497) and vehicle (P = 0.0294). f, Quantification of total intake during glutamatergic inhibition at 1 h. KA/AP3 significantly reduced sucralose intake (P = 0.0090). For df, N = 4 wild-type mice; *P < 0.05 by Kruskal–Wallis test with non-parametric comparisons using the Wilcoxon method. Shaded regions/error bars indicate s.e.m.
Extended Data Fig. 1
Extended Data Fig. 1. Vagal responses to sugars, sugar analogs, and sweeteners are not due to osmolarity and are specific to the small intestine, related to Fig. 1.
a, Normalized maximum vagal firing rate to baseline (PBS), sugars (sucrose [300 mM] (N = 10), d-glucose [150 mM] (N = 5), d-fructose [150 mM] (N = 5), d-galactose [150 mM] (N = 5)), sugar analogs (alpha-methylglucopyranoside (α-MGP) [150 mM] (N = 8), and maltodextrin [8%] (N = 5)), and sweeteners (sucralose [15 mM] (N = 11), acesulfame K (ace-K) [15 mM] (N = 5), and saccharin [30 mM] (N = 5)). *p < 0.009 by Kruskal-Wallis test with non-parametric comparisons using Wilcoxon Method. P-values comparing baseline to each stimulus: sucrose, p < 0.0001; d-glucose, p = 0.0004; d-frucrose, p = 0.6868; d-galactose, p = 0.0004; α-MGP, p < 0.0001; maltodextrin, p = 0.0005; sucralose, p < 0.0001; ace-K, p = 0.0005; saccharin, p = 0.0008. b, Time-to-peak vagal firing rate for sugar stimuli (N as in a; n.s.). c, Normalized maximum vagal firing rate to intraduodenal sucrose [300 mM, ~650mOsm] (N = 6), mannitol [300 mM, ~650mOsm] (N = 3), and 2X PBS [650 mOsm] (N = 3). *p < 0.04 by Kruskal-Wallis test with non-parametric comparisons using Wilcoxon Method. d, Normalized maximum vagal firing rate to sucrose [300 mM] compared to baseline (PBS) infused into the duodenum (p = 0.0173) or ileum (p = 0.0036) (N = 4 mice per group; *p < 0.004, ANOVA with post hoc Tukey’s HSD test). e, Normalized maximum vagal firing rate to sucrose [300 mM] and sucralose [15 mM] infused intraluminally into the duodenum or proximal colon (N = 3 mice per group; *p = 0.0280, ANOVA with post hoc Tukey’s HSD test). Data are presented as mean values. Error bars = S.E.M.
Extended Data Fig. 2
Extended Data Fig. 2. Vagal neuron response to sugars depends on intestinal Cck-labeled neuropod cells, related to Figs. 2 and 3.
a, In wild-type vagal nodose neurons loaded with Fluo-4 and Fura Red, calcium activity was imaged in response to d-glucose [20 mM], sucralose [2 mM], maltodextrin [1%], and positive control KCl [50 mM] (N = 3 mice; n = 59 neurons). b, In CckCRE_tdTomato vagal nodose neurons cultured alone, current was recorded to a+40mV pulse, d-glucose [20 mM] stimulus, or sucralose [2 mM] stimulus (N = 2 mice; n = 15 neurons). No current response was observed to d-glucose or sucralose. Data are presented as mean values. Error bars = S.E.M. c, Left- Electrophysiology in co-cultures of vagal nodose neurons and CckCRE_tdTomato intestinal cells (bar = 10 μm). Center- Of 18 pairs of co-cultured neurons, excitatory post-synaptic potentials were recorded to d-glucose [20 mM] (44.4%), sucralose [2 mM] (22.2%), and both (33.3%) (N = 3 mice, n = 18 pairs). Right - Peak excitatory post-synaptic currents to d-glucose [20 mM] and sucralose [2 mM] (N = 3 mice; n = 18 pairs). Data are presented as mean values. Error bars = S.E.M. d, Single cell transcriptomic data projected onto the vagal nodose atlas showing 18 nodose ganglia (NG) and 6 jugular ganglia (JG) clusters (N = 5R, 6L nodose ganglia; n = 5,507 cells). e, Violin plots from single cell transcriptomic data showing transcripts for Slc5a1 (SGLT1), Tas1r2, Tas1r3, and control Slc17a6 (VGLUT2)—a peripheral afferent marker found ubiquitously in nodose and jugular ganglion neurons.
Extended Data Fig. 3
Extended Data Fig. 3. Cck-labeled neuropod cells express SGLT1 in the small intestine, related to Fig. 3.
a, Cck-labeled neuropod cells express SGLT1 and T1R3. b, Immunofluorescent image of small intestine tissue stained with SGLT1 (yellow). Most small intestinal epithelial cells, that is absorptive enterocytes and Cck-labeled neuropod cells (green), express SGLT1. c, Immunofluorescent image of proximal colonic tissue stained with SGLT1 (yellow). Minimal SGLT1 staining was observed in the colon. d, Fluorescent in situ hybridization (FISH) images of Cck-labeled neuropod cells in duodenal tissue. Top row–cell with expression of Cck, Tas1r3, and Slc5a1. Bottom row–cell with expression of Cck and Slc5a1, but not Tas1r3. e, Quantification of FISH results. In accordance with the single-cell qPCR results (Figs. 3b,c), 71.3 ± 0.04% of CCK+ cells only expressed transcripts for Slc5a1 while 28.7 ± 0.04% expressed transcripts for both Slc5a1 and Tas1r3 (N = 3 mice, n = 50 cells/mouse). Data are presented as mean values. Error bars = S.E.M. f, Normalized maximum vagal firing rate to baseline (PBS) and sucrose [300 mM] with and without SGLT2 inhibitor dapagliflozin [3 nM]. SGLT2 inhibition did not affect vagal firing in response to sucrose (N = 3 mice per group; *p = 0.0405 by ANOVA with post hoc Tukey’s HSD test). Data are presented as mean values. Error bars = S.E.M. g, Fold-change and p-values for genes shown in single cell qPCR heat map in Fig. 3b (N = 3 mice; n = 132 CckGFP + cells, n = 66 CckGFP- cells). h-i, Heat map of gene expression in CckGFP cells by single cell qRT-PCR. h, Genes significantly different between CckGFP cells positive and negative for Slc5a1 (SGLT1) (N = 3 mice, n = 132 CckGFP cells, 104/132 Slc5a1+). i, Genes significantly different between CckGFP cells positive and negative for Tas1r3 (T1R3) (N = 3 mice, n = 132 CckGFP cells, 31/132 Tas1r3+).
Extended Data Fig. 4
Extended Data Fig. 4. Cck-labeled neuropod cells use different neurotransmitters to distinguish sucrose from sucralose in both mouse and human, related to Fig. 4.
a-c, Organoids cultured from mouse or human small intestinal tissue were stimulated with PBS, sucrose [300 mM], α-MGP [150 mM], and sucralose [15mM]. Glutamate in the supernatant was detected using a colorimetric assay. a, In CckGFP (green) intestinal organoids, sucrose and α-MGP elicited significant glutamate release compared to PBS control, while sucralose did not. b, Human duodenal organoids contain Chromogranin-A+ cells (ChgA, green)—a validated marker for enteroendocrine cells in human tissue that co-localizes with cholecystokinin71. Human duodenal organoids release glutamate to sucrose and α-MGP, but not to sucralose or PBS control. Bars=10 μm. c, Quantification of supernatant glutamate concentration from mouse and human organoids (mouse: N = 3 mice, n = 5-6 plates, *p < 0.05; human: N = 1 human sample, n = 3-6 plates, *p < 0.05). d, Violin plots from single cell transcriptomic data of nodose ganglia and jugular ganglia for Cckar, glutamate receptors (ionotropic (Ion.) and metabotropic (Metab.)), and ATP receptors (P2rx (ion.) and P2ry (metab.)) (N = 5 right, and 6 left murine nodose ganglia, n = 5,507 cells). e, Normalized vagal responses to baseline (PBS) and sucrose (left; N = 4) or sucralose (right; N = 6) before and after cholecystokinin-A receptor inhibition with devazepide [2mg/kg]. f, Quantification of peak vagal response from (e) *p < 0.0001. g-i, Time-to-peak vagal firing before and after inhibition of (g) glutamate receptors with KA/AP3 from Fig. 4b (*p < 0.03. p = 0.0031 comparing sucrose before and after KA/AP3); (h) P2 purinergic receptors with PPADS from Fig. 4d (*p < 0.05. p= 0.0369 comparing sucralose before and after PPADS); and (i) cholecystokinin-A receptors with devazepide from (e). Gray vertical bars = infusion. Bold lines = mean, shaded regions/error bars = S.E.M. For vagal recordings, statistics by (g) Kruskal-Wallis test with non-parametric comparisons using Wilcoxon Method or (f, h, i) ANOVA with post hoc Tukey’s HSD test.
Extended Data Fig. 5
Extended Data Fig. 5. Distinct neuronal pathways transmit luminal sucrose and sucralose from gut to brain.
a, In anesthetized Neurod1CRE_Salsa6f mice, right nodose ganglion neurons were imaged in vivo by intravital multi-photon calcium imaging while sugars were delivered from the pylorus to the ligament of Treitz. In these mice, nodose neurons express the calcium indicator GCaMP6f. b, Representative images of nodose ganglion neurons colored by response to sucrose (top) and sucralose (middle). Merged image (bottom) shows non-overlapping populations. c, Calcium activity was imaged in response to intraduodenal sucrose [300mM] then sucralose [15mM], or vice versa. Each row indicates one neuron’s response to both sucrose and sucralose (N = 4 mice, n = 54 cells).
Extended Data Fig. 6
Extended Data Fig. 6. Laser inhibition of duodenal Cck-labeled neuropod cells does not cause malaise or off-target effects, related to Fig. 6.
a, In CRE-negative littermate controls of CckCRE_Halo mice, average traces showing sucrose [300mM] and sucralose [15mM] consumption during control 473 nm light (left) and silencing 532 nm light (right). b, Preference quantified at one hour with no laser (pre/post), control 473 nm light, and silencing 532 nm light. c, Quantification of total intake at one hour (N = 5 littermate controls; n.s. by repeated measures ANOVA). d, Activity was measured as total beam breaks in x-y plane during one-hour choice assay with control 473 nm (N = 7) or silencing 532 nm light (N = 8; n.s. by repeated measures ANOVA). e, Water and chow intake were measured during the 23 hours following the choice assay. f, Total chow and water intake in 23 hours following the one-hour choice assay with no laser (pre, post), with control 473 nm light (N = 7), or with silencing 532 nm light (N = 6). Silencing 532 nm light did not affect subsequent intake of chow or water compared to control 473 nm light (CckCRE_Halo mice, *p = 0.0030 by repeated measures ANOVA with two-tailed paired t-test post-hoc analysis). g-j, CckCRE_Halo mice underwent gavage with 300 μL of sucrose [300mM] and were tested for off-target effects of laser inhibition. Laser inhibition with silencing 532 nm light, compared to control 473 nm light, did not affect (h) gastric emptying (N = 4), (i) total gut transit time (N = 5) or (j) glucose absorption (N = 5) after sucrose gavage (CckCRE_Halo mice, n.s.). Bold line = mean, shaded regions/error bars = S.E.M.
Extended Data Fig. 7
Extended Data Fig. 7. Glutamatergic signaling from Cck-labeled neuropod cells drives intake.
a, CckCRE_Channelrhodopsin (CckCRE_ChR2) mice and littermate controls were given a one-bottle intake test of sucralose [15mM] for 1 hour with control 532 nm or activating 473 nm light. Laser stimulation was paired to solution consumption: for every 0.01 mL intake, mice received 5 seconds of intraluminal stimulation at 40Hz. b, In littermate controls (left) or CckCRE_Chr2 mice (right), average traces show intake of sucralose plus control 532 nm light or activating 473 nm light. c, Stimulation of duodenal Cck-labeled neuropod cells with 473 nm light increased intake of sucralose [15mM] (N = 4 mice; *p = 0.0062, repeated-measures ANOVA with post-hoc two-tailed paired t-test). d, In CckCRE_ChR2 mice, ionotropic/metabotropic glutamate receptor inhibitors KA/AP3 (150 μg/kg] /[1mg/kg] in 10 μL/g mouse in 1M NaOH in PBS, pH=7.4) or vehicle (1M NaOH in PBS, pH=7.4) were administered intraperitoneally 25 minutes prior to the one-bottle assay as in (a). e, In CckCRE_ChR2 mice, average traces show intake of sucralose with vehicle (purple) or glutamate receptor inhibitor (blue) and control 532 nm light (left) or activating 473 nm light (right). f, Glutamate receptor inhibition reverses the increase in sucralose intake caused by optogenetic stimulation of Cck-labeled neuropod cells (N = 4 mice; *p = 0.0054, repeated-measures ANOVA with post-hoc two-tailed paired t-test). Bold line = mean, shaded regions/error bars = S.E.M.
Extended Data Fig. 8
Extended Data Fig. 8. Cholecystokinin signaling does not mediate sucrose preference, related to Fig. 6.
Circulating cholecystokinin is known to promote gallbladder emptying and slow gastric emptying in response to fat. a, Wild-type mice were anesthetized and PBS (negative control, N = 6), corn oil (positive control, N = 4), or sucrose ([300 mM], N = 7) was perfused into the duodenum and change in gallbladder volume was measured. Corn oil stimulated gallbladder emptying, while sucrose and PBS had no effect. p < 0.0001 by ANOVA. b, Wild-type mice were gavaged with 300 μL of PBS (negative control, N = 4), corn oil (positive control, N = 6), or sucrose ([300mM], N = 4) and gastric emptying was measured. Corn oil reduced gastric emptying (increased volume remaining), while sucrose and PBS had no effect. p < 0.0001 by ANOVA. c, Wild-type mice were given a two-bottle preference test between sucrose [300mM] and sucralose [15mM] for one hour. Cholecystokinin-A receptor inhibitor devazepide [2mg/kg] or vehicle (5% DMSO in PBS) was administered intraperitoneally (10 μL/g mouse) 30 minutes prior to assay. d, Preference for sucrose over sucralose (left) and sugar intake (right) during the one-hour assay with vehicle or devazepide. Preference was unchanged by devazepide compared to vehicle. Sucrose intake trended towards increasing with devazepide (N = 4 mice per group, n.s.). e, Average traces show sucrose and sucralose intake with intraperitoneal injection of vehicle (left) or cholecystokinin-A receptor inhibitor devazepide (right). Bold line = mean, shaded regions/error bars = S.E.M.
Extended Data Fig. 9
Extended Data Fig. 9. Duodenal local dose of glutamate receptor inhibitors does not impact sucrose preference when delivered systemically.
a, Wild-type mice were given a two-bottle preference test between sucrose [300mM] and sucralose [15mM] for one hour. Local dose ionotropic/metabotropic glutamate receptor inhibitors KA/AP3 ([15ng/kg]/[0.1 μg/kg] in 10 μL/g mouse in 1M NaOH in PBS, pH=7.4) or vehicle (1M NaOH in PBS, pH=7.4) was administered intraperitoneally 10 minutes prior to assay. b, Average traces show sucrose and sucralose consumption with intraperitoneal injection of vehicle (left) or local dose glutamate receptor inhibitors KA/AP3 (right). c, Preference for sucrose over sucralose (left) and sugar intake (right) during the one-hour assay with vehicle or KA/AP3. Preference and intake was unchanged by systemic administration of local dose glutamate receptor inhibition compared to vehicle (N = 4 mice per group, n.s.). Bold line = mean, shaded regions/error bars = S.E.M.

Comment in

Similar articles

Cited by

References

    1. Damak S, et al. Detection of sweet and umami taste in the absence of taste receptor T1r3. Science. 2003;301:850–853. - PubMed
    1. de Araujo, I. E. et al. Food reward in the absence of taste receptor signaling. Neuron57, 930–941 (2008). - PubMed
    1. Ren X, et al. Nutrient selection in the absence of taste receptor signaling. J. Neurosci. 2010;30:8012–8023. - PMC - PubMed
    1. Booth DA. Satiety and behavioral caloric compensation following intragastric glucose loads in the rat. J. Comp. Physiol. Psychol. 1972;78:412–432. - PubMed
    1. Dus, M., Min, S. H., Keene, A. C., Lee, G. Y. & Suh, G. S. B. Taste-independent detection of the caloric content of sugar in Drosophila. Proc. Natl Acad. Sci. USA108, 11644–11649 (2011). - PMC - PubMed

Publication types