. 2022 Jan;4(1):90-105.
doi: 10.1038/s42255-021-00509-1. Epub 2022 Jan 13.

Identification of a regulatory pathway inhibiting adipogenesis via RSPO2

Affiliations

Identification of a regulatory pathway inhibiting adipogenesis via RSPO2

Hua Dong et al. Nat Metab. 2022 Jan.

Abstract

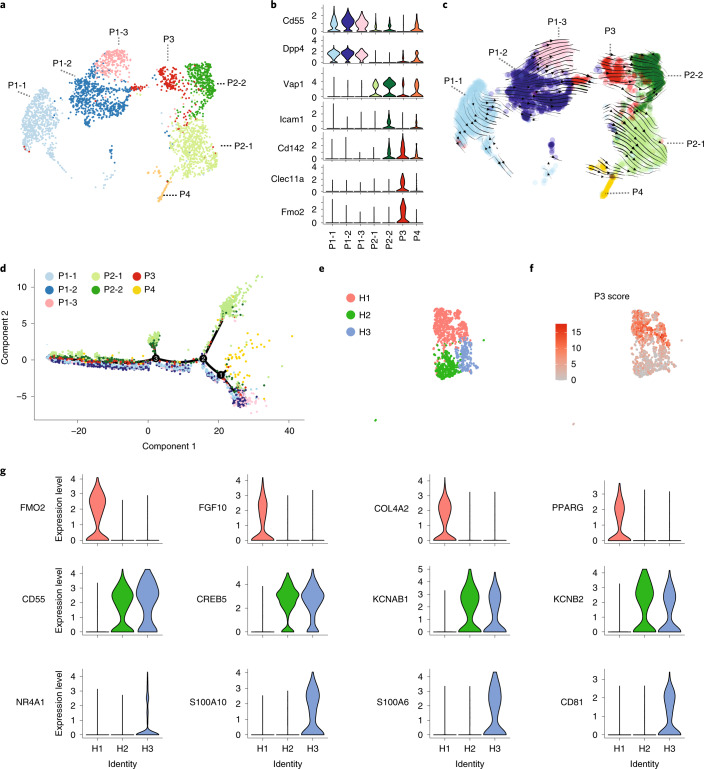
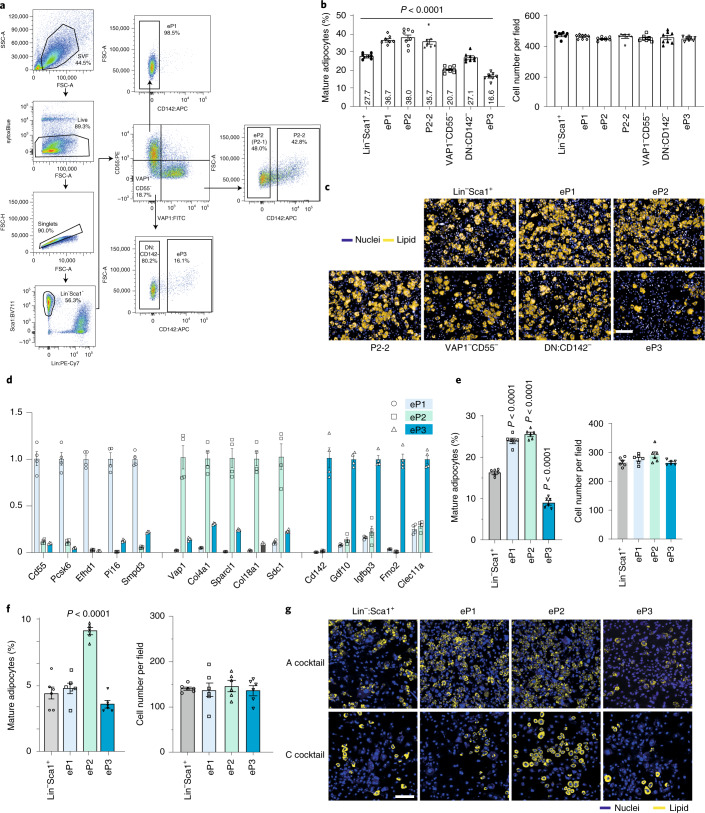
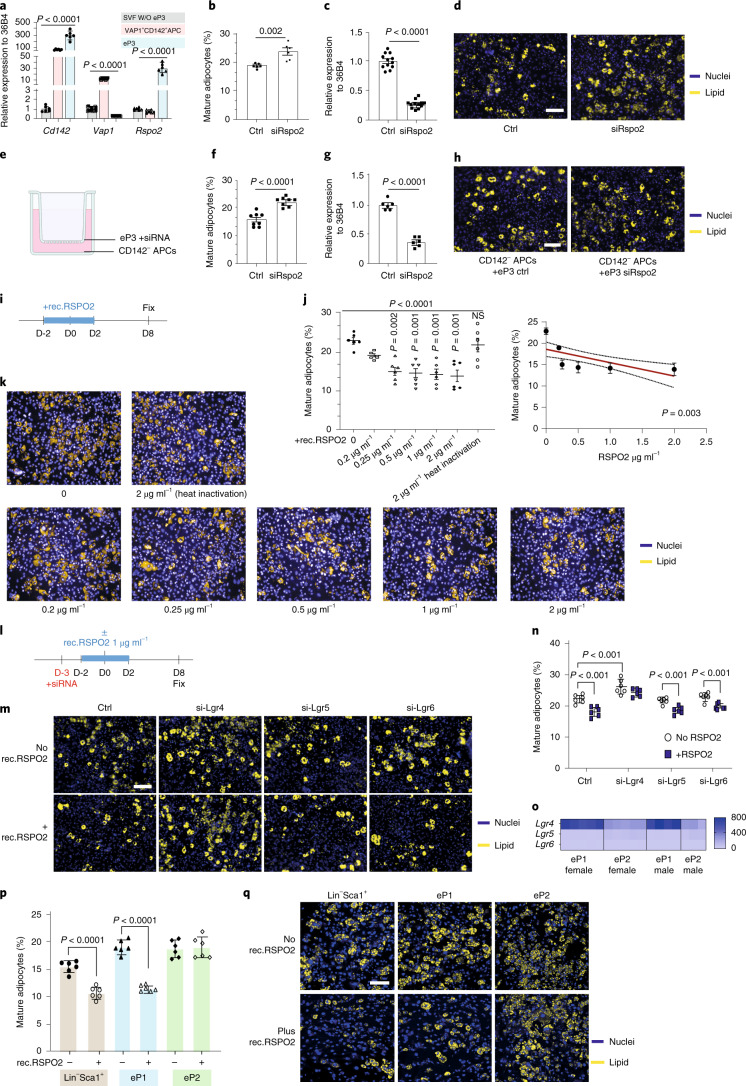
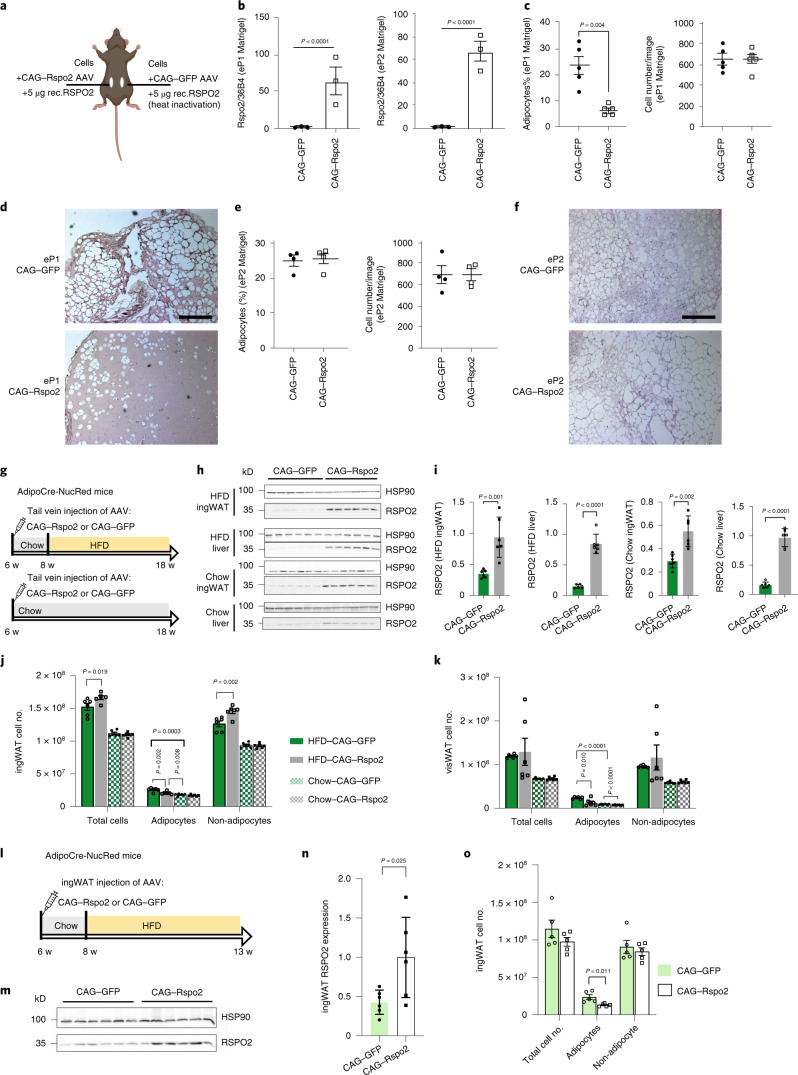
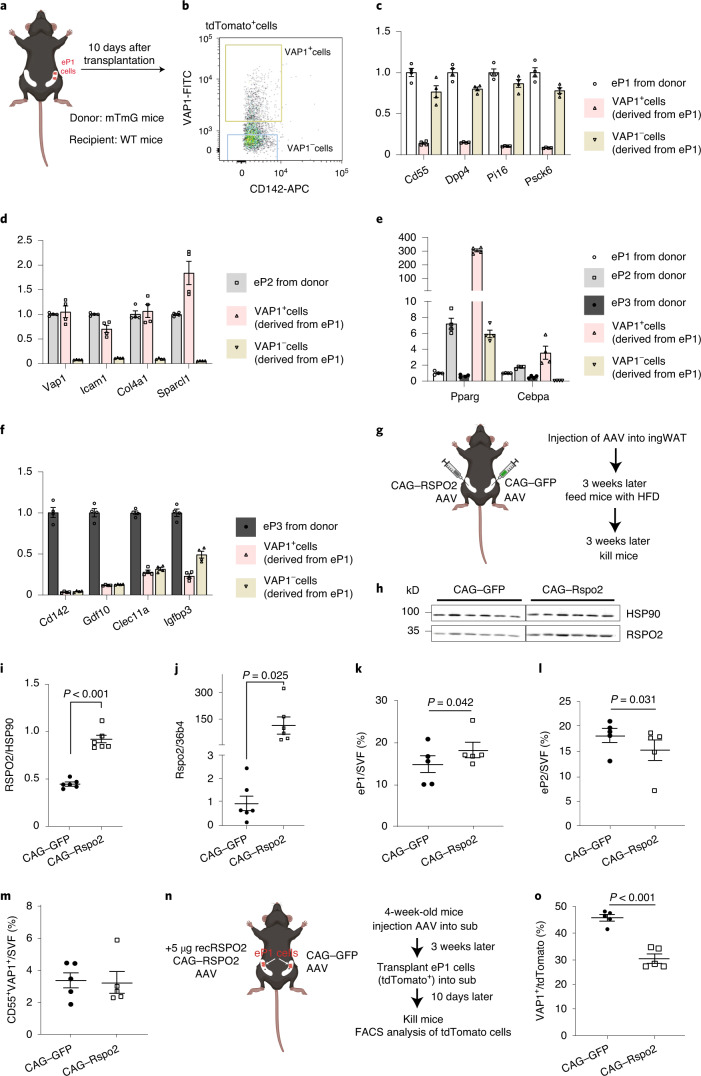
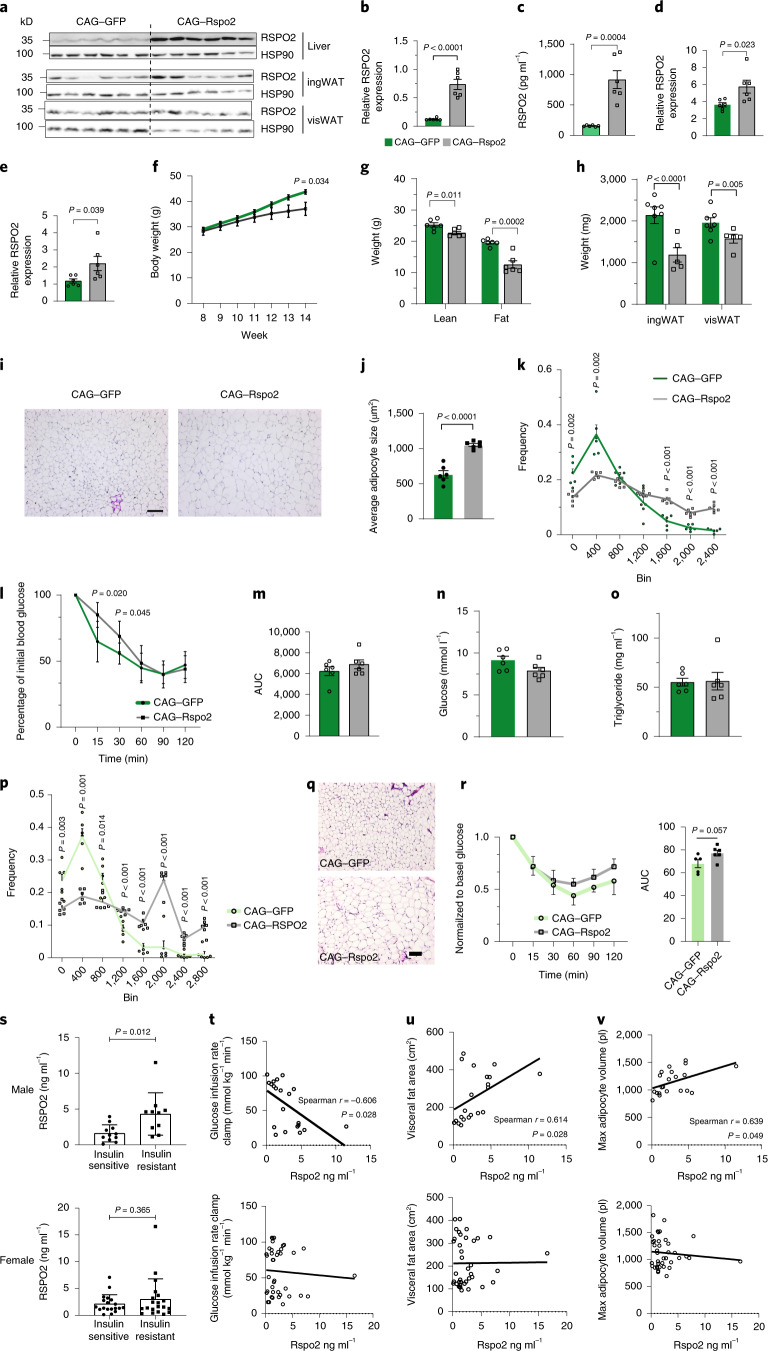
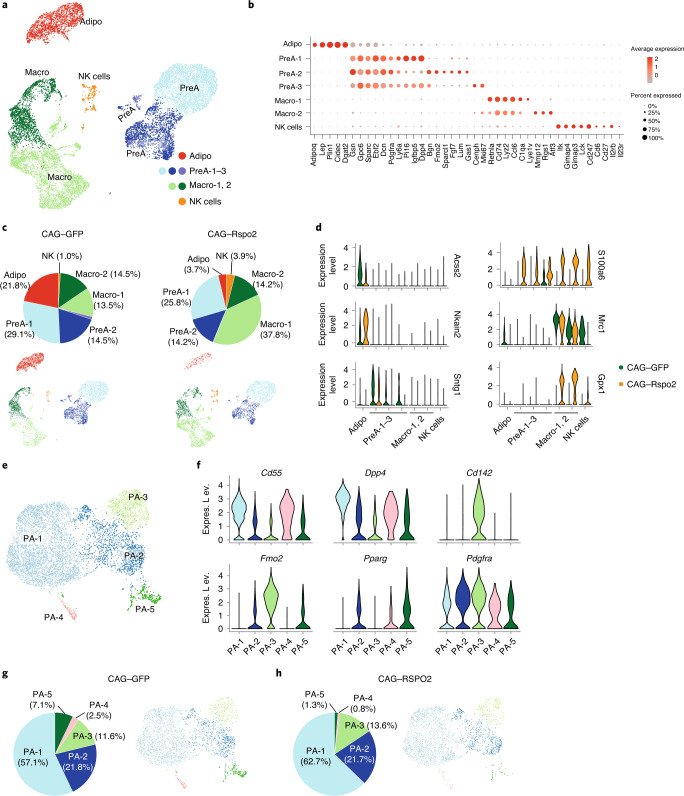
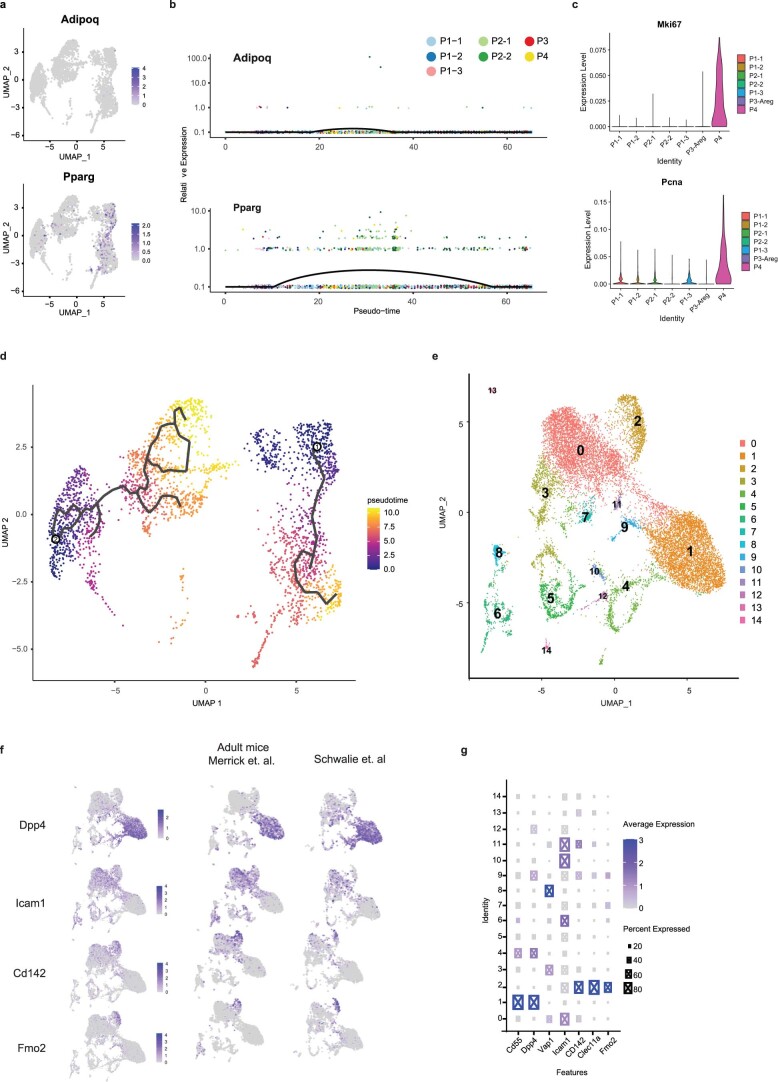
Healthy adipose tissue remodeling depends on the balance between de novo adipogenesis from adipogenic progenitor cells and the hypertrophy of adipocytes. De novo adipogenesis has been shown to promote healthy adipose tissue expansion, which confers protection from obesity-associated insulin resistance. Here, we define the role and trajectory of different adipogenic precursor subpopulations and further delineate the mechanism and cellular trajectory of adipogenesis, using single-cell RNA-sequencing datasets of murine adipogenic precursors. We identify Rspo2 as a functional regulator of adipogenesis, which is secreted by a subset of CD142+ cells to inhibit maturation of early progenitors through the receptor Lgr4. Increased circulating RSPO2 in mice leads to adipose tissue hypertrophy and insulin resistance and increased RSPO2 levels in male obese individuals correlate with impaired glucose homeostasis. Taken together, these findings identify a complex cellular crosstalk that inhibits adipogenesis and impairs adipose tissue homeostasis.


Conflict of interest statement

The authors declare no competing interests.

Figures

Fig. 1
Fig. 1. Integration of different scRNA-seq data further reveal the heterogeneity of adipocyte progenitors.
a, Uniform Manifold Approximation and Projection (UMAP) two-dimensional map of cells derived from 10X dataset in our previous study shows several distinct clusters, including Cd55+ progenitor cells (P1-1, P1-2 and P1-3), two subpopulations of committed pre-adipocytes (P2-1 and P2-2), P3 cells and dividing cells expressing cell-cycle genes of S phase (P4). b, Violin plots showing the expression of marker genes. Cd55 and Dpp4 (marker of cluster P1-1–P1-3); Vap1 and Icam1 (marker of cluster P2-1–P2-2); and Cd142, Clec11a and Fmo2 (marker of cluster P3). c,d, Cell trajectory analysis of Lin cells by Velocyto and scVELO (c) and Monocle 3 (d). e,f, Single-nucleus RNA-seq (snRNA-seq) of human deep neck adipose tissue. Unsupervised clustering of pre-adipocyte populations shown as UMAP plot (e). P3 score (f) calculated as the sum of F3, CLEC11A, FMO2, GAS6, CYGB, PPL and STEAP4 for each cell. g, Feature plots of H1 (FMO2, FGF10, COL4A2 and PPARG), H2 (CD55, KCNAB1, KCNB2 and CREB5) and H3 (NR4A1, S100A10, S100A6 and CD81) markers in preadipocyte nuclei of human deep neck adipose tissue.
Fig. 2
Fig. 2. Classification of different cell populations within the adipose tissue.
a, Flow cytometry dot plots show the new gating strategy used to sort eP1, eP2 and eP3. b, Quantification of adipogenesis (left) and cell number (right) of LinSca1+ cells, eP1 cells, eP2 cells, VAP1+CD142+ APCs, VAP1CD55 cells, DN:CD142 cells and eP3 induced by A Cocktail (1 μM dexamethasone, 0.5 mM isobutylmethylxanthine and 1 μM insulin). Data are shown as mean ± s.e.m., n = 8 independent wells. Data were analyzed with one-way analysis of variance (ANOVA); F(6,49) = 69.7002, P < 0.0001. c, Microscopy images of different cell populations shown in b on differentiation day 6. Experiment was repeated twice. d, Relative mRNA levels of P1 marker (Cd55, Pcsk6, Efhd1, Pi16 and Smpd3), P2 markers (Vap1, Col4a1, Sparcl1 and Sdc1) and Areg cell-specific marker (Cd142, Gdf10, Igfbp3, Fmo2 and Clec11a) genes in different cell populations; n = 3 biological replicates. Data show mean ± s.e.m. e, Quantification of adipogenesis (left) and cell number (right) of LinSca1+ cells, eP1 cells, eP2 cells and eP3 induced by A Cocktail. Data show mean ± s.e.m.; n = 6 independent wells. Data were analyzed with one-way ANOVA; F(3,20) = 280.8, P < 0.0001 (left); multicomparison with LinSca1+ group was performed by two-stage step-up method with false discovery rate (FDR) = 0.05. F(3,20) = 2.838, P = 0.064 (right). f, Quantification of adipogenesis (left) and cell numbers (right) of LinSca1+ cells, eP1 cells, eP2 cells and eP3 induced by C Cocktail (1 μM insulin). Data are shown as mean ± s.e.m., n = 6 independent wells. Data were analyzed with one-way ANOVA. F(3,20) = 48.27, P < 0.0001 (left), multicomparison with LinSca1+ group was performed by two-stage step-up method with FDR = 0.05. F(3,20) = 0.189, P = 0.903 (right). g, Microscopy images of different cell populations shown in e and f on differentiation day 6. In all panels, nuclei were stained with Hoechst 33342 (blue) and lipids were stained with LD540 (yellow). Scale bars, 100 μm. Source data
Fig. 3
Fig. 3. Identification of Rspo2 as a new marker of P3.
a, Cd142 Vap1 and Rspo2 expression in eP3-depleted SVF, VAP1+CD142+ APCs and eP3. Data show the mean ± s.e.m., n = 6 biological replicates. Cd142: F(2,15) = 88.9; Vap1: F(2,15) = 686.4; Rspo2: F(2,15) = 79.5 using one-way ANOVA. bd, The ratio (b) and representative images (d) of adipocytes after knocking down of Rspo2 in ingWAT SVF. Rspo2 mRNA expression (c) 48 h after transfection. Data show mean ± s.e.m., analyzed by two-tailed Student’s t-test. n = 2 biological replicates (b), n = 4 biological replicates (c). Ctrl, control. eh, Scheme of Transwell co-culture experiments (e). The ratio (f) and representative images (h) of CD142 cells on differentiation day 8. Rspo2 mRNA levels (g) in siRNA-transfected eP3. Data show mean ± s.e.m., analyzed with two-tailed Student’s t-test, n = 2 biological replicates (f,g). ik, Experimental scheme (i) for rec.RSPO2 treatment experiment. The ratio (j) and microscopy images (k) of adipocytes in SVF-treated ± rec.SPO2. Data shown as mean ± s.e.m., n = 6 independent wells. Data were analyzed with one-way ANOVA followed by Tukey’s multiple comparisons test. F(6,35) = 10.18. Spearman r correlation between RSPO2 level in medium and adipocyte ratio (j right). NS, not significant. ln, Experimental scheme (l) for knocking down of Lgr4, Lgr5 and Lgr6 in ingWAT SVF treated with or without rec.RSPO2. Representative images (m) and the ratio (n) of mature adipocytes per well. Data shown as mean ± s.e.m., n = 6 independent wells. F(3,30) = 1.07, P = 0.377 using two-way ANOVA. Multicomparsion between groups was performed by two-stage step-up method with FDR = 0.05. o, Heat map of Lgr4, Lgr5 and Lgr6 expression in eP1 and eP2 cells, n = 3–5 biological replicates. pq, Ratio (p) and representative images (q) of adipocytes in cells treated ± rec.RSPO2. Data shown as mean ± s.e.m., n = 6 independent wells. F(2,20) = 26.22, P < 0.0001 using two-way ANOVA. Multicomparison between groups was performed by two-stage step-up method with FDR = 0.05. In all panels, nuclei were stained with Hoechst 33342 (blue) and lipids were stained with LD540 (yellow). Scale bars, 100 μm. Source data
Fig. 4
Fig. 4. Rspo2 inhibits adipogenesis of eP1 cells in vivo.
af, Experimental scheme (a) for cell transplantation in Matrigel. Rspo2 expression in eP1 Matrigel plugs and in eP2 Matrigel plugs (b). Quantification of adipocytes and cell number in eP1 Matrigel plugs (c) and eP2 Matrigel plugs (e). Representative hematoxylin and eosin (H&E) staining of eP1 Matrigel plugs (d) and eP2 Matrigel plugs (f). Data show mean ± s.e.m., n = 3 biological replicates (b), n = 5 biological replicates (c,e). Data analysis was performed using a two-tailed Student’s t-test. Scale bar, 100 μm. gk, Experimental scheme for overexpression of RSPO2 in AdipoCre-NucRed mice fed with HFD or chow diet. Western blot images (h) and quantification (i) of RSPO2 protein in liver and ingWAT; HSP90 bands were used as loading control. Quantification of adipocyte numbers in ingWAT (j) and visWAT (k) of mice shown in g. Data are shown as mean ± s.d., n = 6 mice. Data analysis was performed by two-tailed Student’s t-test (i) and one-way ANOVA (j,k). In j, Total cell number, F(3,20) = 14.4, P < 0.0001; adipocyte, F(3,20) = 15.50, P < 0.0001; non-adipocyte, F(3,20) = 14.1, P < 0.0001. In k, total cell number, F(3,20) = 14.4, P < 0.0001; adipocyte, F(3,20) = 15.50, P < 0.0001; non-adipocyte, F(3,20) = 14.1, P < 0.0001. lo, Experimental scheme (l) for overexpression of RSPO2 in ingWAT by injection of AAV into ingWAT of AdipoCre-NucRed mice. Western blot images (m) and quantification (n) of RSPO2 protein in ingWAT of mice shown in l. HSP90 bands were used as loading control. Quantification of cell numbers by quantitative PCR in ingWAT (o). Data shows mean ± s.d., n = 5–6 mice. Data were analyzed using a two-tailed Student’s t-test. Source data
Fig. 5
Fig. 5. Rspo2 inhibits transition of eP1 cells to eP2 cells.
af, Experimental scheme (a) for transplantation of tdTomato+ eP1 cells into inguinal adipose tissue of wild-type (WT) mice. FACS analysis (b) of VAP1 and CD142 expression in tdTomato+ eP1 cells 10 d after transplantation. Expression of P1 marker genes (c) (Cd55, Dpp4, Pi16 and Psck6), P2 marker genes (d) (Vap1, Icam1, Col4a1 and Sparcl1), Pparg and Cebpa (e) and P3 marker genes (f) (Cd142, Gdf10, Clec11a and Igfbp3) in eP1 cells (from donor mice), eP2 cells (from donor mice), eP3 cells (from donor mice), VAP1+ cells (derived from implanted eP1 cells) and VAP1 cells (derived from implanted eP1 cells). Data are shown as mean ± s.e.m., n = 4 biological replicates. gm, Experimental scheme (g) for injection of AAVs into ingWAT for overexpression of RSPO2. Western blot images (h) and quantification (i) of RSPO2 protein and Rspo2 mRNA (j) in ingWAT. FACS analysis of eP1/SVF (k), eP2/SVF (l), CD55+VAP1+ (m) in ingWAT. Data are shown as mean ± s.e.m., n = 6 mice (h,i), n = 5–6 mice (j), n = 5 mice (km). Data were analyzed using two-tailed Student’s t-test. n,o, Experimental scheme (n) for transplantation of tdTomato+ eP1 cells into RSPO2 overexpression mice. FACS analysis of (VAP1+:tdTomato+) cells in tdTomato+ eP1 cells (o). Data are shown as mean ± s.e.m., n = 5 biological replicates. Data were analyzed using a two-tailed paired Student’s t-test. Source data
Fig. 6
Fig. 6. Circulating RSPO2 leads to unhealthy expansion of adipose tissue and insulin resistance in vivo.
ao, RSPO2 overexpression in mice by tail-vein delivery of pAAV–CAG–Rspo2. Representative immunoblots (a) and quantification of RSPO2 and HSP90 in liver (b), circulation (c), ingWAT (d) and visWAT (e) in RSPO2-overexpression mice. Body weight curve (f), lean mass and fat mass (g) and ingWAT and visWAT tissue weight (h) of AAV-infected mice. Representative H&E staining images (i), average of adipocytes size (μm2) and adipocyte size frequency distribution of ingWAT. Blood glucose normalized to initial blood glucose after insulin injection (l) in ITT and area under the curve (AUC) was quantified as shown in m. Fasting blood glucose (n) and triglycerides (o) in AAV-injected mice. Data are shown as mean ± s.e.m., n = 6 mice. Data were analyzed using a two-tailed Student’s t-test. Scale bar, 100 μm. pr, RSPO2 overexpression by injection into ingWAT. Adipocyte size frequency distribution (p) and representative H&E staining of ingWAT. Data are shown as mean ± s.e.m. Glucose levels in blood in ITT and glucose was normalized to time point 0 (r). Data are shown as mean ± s.d. Comparison of AUC (r, right) in ITT. Data are shown as mean ± s.e.m., n = 5 mice (CAG–GFP), n = 6 mice (CAG–Rspo2). Data analysis was performed using a two-tailed Student’s t-test. s, Circulating RSPO2 levels in insulin-sensitive and insulin-resistant individuals. Data are shown as mean ± s.d., n = 11 (male, insulin sensitive), n = 10 (male, insulin resistant), n = 18 (female, insulin sensitive), n = 21 (male, insulin resistant). Data analysis was performed using a two-tailed Student’s t-test. tv, Spearman correlation coefficient analysis of circulating RSPO2 and glucose infusion rate (t), visceral fat area (u) and max adipocyte volume (v). P values are corrected by two-stage step-up method of Benjamini, Krieger and Yekutieli with an FDR = 0.05. Source data
Fig. 7
Fig. 7. snRNA-seq reveals Rspo2 reducing adipocytes number in vivo.
a, Integrated analysis of snRNA-seq, including 14,303 nuclei from ingWAT in mice fed on HFD with chronic expression of GFP or RSPO2 by AAV, yielding 2,218 genes (median). Unsupervised clustering shown as a UMAP plot, seven populations were identified, including adipocytes (adipo) (red), pre-adipocytes (PreA) (blue), macrophages (macro) (green) and natural killer (NK) cells (orange). b, Dot plots for representative markers of each cluster. Expression level (indicated by red color) refers to the log normalized ratio of gene expression reads, normalized to the sum of all reads within each nucleus. Percent expressed refers to the ratio of cells within each cluster that express the genes listed in x axis. c, Cluster compositions in CAG–GFP (n = 7,190 nuclei) and CAG–Rspo2 (n = 7,143 nuclei) conditions. d, Violin plots for Acss2, Nkain2, Sntg1, S100a6, Mrc1 and Gpx1, which are differentially expressed between CAG–GFP and CAG–Rspo2 conditions. e, Subclustering analysis of preadipocyte populations. Unsupervised subclustering of 6,411 preadipocyte nuclei from ingWAT, yielding 2,577 (median) genes. Five subpopulations of preadipocytes (PA-1–PA-5) were identified. f, Feature plots for Dpp4, Pparg and Fmo2, shown as separated plots by conditions. g,h, Pre-adipocyte cluster compositions in CAG–GFP (n = 3,539 nuclei) and CAG–Rspo2 (n = 2,872 nuclei) conditions.
Extended Data Fig. 1
Extended Data Fig. 1. Integration of two scRNAseq of mouse Lin- cells from ingWAT and delineation of the heterogeneity of preadipocytes in human adipose tissue by single-nuclei sequencing.
a) Feature plots of Pparg and Adipoq in mouse preadipocytes clusters. b) Adipoq and Pparg relative expression along the pseudo trajectory. c) Cell cycle related genes expression of mouse preadipocytes clusters. d) Cell trajectories reconstruction. e) UMAP of aligned cells derived from study Schwalie et. al and Merrick et. al. Cluster 0: Cd142+ committed preadipocytes; Cluster 1: Cd55+ progenitors; Cluster 2: Aregs; Cluster 3: Vap1+ committed preadipocytes. f) Feature plots of gene expression (log2 CPM) of marker genes for progenitor cells: Cd55, Dpp4; for committed preadipocyte: Vap1, Icam1; and for Aregs: Cd142, Clec11a and Fmo2. g) Integrated dot plots of gene expression (log2 CPM) of marker genes for progenitor cells: Cd55, Dpp4; for committed preadipocyte: Vap1, Icam1; and for Aregs: Cd142, Clec11a, and Fmo2. h) Violin plots of number of genes and reads detected in the unsupervised clustering of mouse SVF cells (Methods). i) Heatmap of signature genes expression across mouse preadipocytes clusters. j) Unsupervised clusters of preadipocytes from human deep neck adipose tissue. k) Feature plots of PDGFRA in nuclei isolated from human deep neck adipose tissue. l) Violin plots showing the expression of DPP4, VAP1, ICAM1, CD142, CLEC11A in the clusters colored in Fig. 1a. m) Cell type analysis was performed by Enrichr on significant genes of H3 cluster. Bars were sorted by p-value ranking. P-value was computed using the Fisher exact test. n) WikiPathway (WikiPathway 2021 human database) enrichment analysis was performed by Enrichr on significant genes of H3 cluster. Bars were sorted by p-value ranking. P-value was computed using the Fisher exact test. o) Heatmap of signature genes expression across human preadipocytes clusters H1-H3. This figure is related to Fig. 1. Source data
Extended Data Fig. 2
Extended Data Fig. 2. Discrepancies of the two studies, regarding the sorting and culture of Aregs.
a) Representative flow cytometry dots plots showing the gating strategy used to identify CD142-, CD142 + , and CD142 + + cells. b) Relative mRNA levels of P3 specific marker genes (Cd142, Gdf10, Igfbp3, Clec11a) in different cell populations. n = 4 biological replicates. Data show the mean ± SEM. c) Histogram plots shows expression level of CD142, CD55, and VAP1 in CD142- cells, CD142 + cells and CD142 + + cells. d) Relative mRNA levels of P1 specific marker genes (Cd55, Pcsk6, Efhd1, Pi16, Smpd3) in different cell populations. n = 4 biological replicates. Data shown as mean ± SEM. e) Relative mRNA levels of P2 specific marker genes (Vap1, Col4a1, Sparcl1, Col18a1, Sdc1) in different cell populations. n = 4 biological replicates. Data shown as mean ± SEM. f) Cells were sorted from ingWAT. Adipogenesis was induced by A Cocktail (1 μM dexamethasone, 0.5 mM isobutylmethylxanthine, 1 μM insulin) or B Cocktail (1 μM dexamethasone, 0.5 mM isobutylmethylxanthine, 125 nM Indomethacin, 1 nM T3, and 20 nM insulin). Quantification of adipogenesis (top) and cell numbers (below) in culture well on differentiation day 6. Data shown as mean ± SEM. F(3,30)= 14.78, P < 0.0001 by two-way ANOVA. For Cocktail difference, F(1,10)=290.5, P < 0.0001. For cell type difference, F(1.929,19.29)=148.8, P < 0.0001. g) Microscopy images of different cell populations shown on differentiation day 6 in f. In all panels, nuclei were stained with Hoechst 33342 (blue) and lipids were stained with LD540 (yellow). Scale bars, 100μm. This figure is related to Fig. 2. Source data
Extended Data Fig. 3
Extended Data Fig. 3. Selection and identification of Aregs’ effectors.
ac.) Scheme of identification of Aregs marker genes candidates (a), and their expression in eP1 and eP2 cells bulk RNAseq data, n = 3-5 biological replicates (b). mRNA expression in eP3 and eP3-depleted SVF (c). n = 6 biological replicates, data show the mean ± SEM., and analyzed by two-tailed Student’s t-test. d) Adipocyte ratio in ingWAT SVF after knocking down eP3 marker genes by siRNA. n = 3 biological replicates; data shown as mean ± SEM. and analyzed by two-tailed Student’s t-test (compared to Ctrl group). e) Adipocyte ratio in CD142- cells co-cultured with eP3. n = 3 biological replicates; data shown as mean ± SEM. and analyzed by two-tailed Student’s t-test (compared to Ctrl group). f) Comparison of adipogenesis of CD142- cells after knocking down of Spink2, Rspo2, Cgref1 and Serpinb6c in eP3 cells in transwell co-culture experiments. Adipocyte ratio normalized to ctrl group. n = 3 biological replicates; data is presented as mean ± SEM and analyzed by one way-ANOVA test. F(3,20)=2.025, P = 0.143. g) Adipocyte ratio in eP3 after knocking down Rspo2 by siRNA, n = 3 biological replicates. Representative images of adipocytes on differentiation day 7. h) RSPO2 conc. in cell culture medium, n = 4 biological replicates. Data is presented as mean + /- SEM and was analyzed by one way-ANOVA test. F(3,12)=75; P < 0.0001. i) Quantification of cell number in Fig. 3j. n = 6 independent wells; data show the mean ± SEM, analyzed by one way-ANOVA test. j) Feature plots of Lgr4 in 10xscRNAseq of ingWAT Lin- cells. k) Pathway enriched in eP1 cells by Enrichr analysis. P-value is computed using the Fisher exact test. l) Heatmap of log2 fold changes of Wnt signaling related genes in eP1 and eP2 cells. Each row represents 1 gene; each column represents one replicate. m) Pathway enriched in eP2 cells by Enrichr analysis. P-value was computed using the Fisher exact test. n) Heatmap of log2 fold changes of adipogenesis related genes in eP1 and eP2 cells. Each row represents 1 gene; each column represents one replicate. o) Quantification of cell number per field in Fig. 3n. Data show the mean ± SEM, n = 6 independent wells. p) Lgr4-6 mRNA level in cells in Fig. 3n. Data shown as mean ± SEM, n = 6 independent wells. Statistical analysis was performed by two-tailed Student’s t-test. q) Quantification of cell numbers per field in Fig. 3p. Data shown as mean ± SEM, n = 6 independent wells. r) Experimental scheme of treatment cells with rec.RSPO2 during adipogenesis day3 to day6. s) Quantification of adipocytes per well (left) and cell number (right) ± rec.RSPO2 during day3 to day6. Data shown as mean ± SEM, n = 6 independent wells. tw) SVF cells treated with 0.5ug/ml rec.RSPO2 for 0-24 h. Western blot images (t) and quantification (u) of beta-Catenin and beta-Actin in SVF. Data shown as mean ± SEM, n = 3 biological replicates. F(3,8)=3.85, P = 0.057 by one way ANOVA. Multiple comparison between groups was performed using Tukey test with FDR = 0.05. Quantification of cells number/field (v) and microscopy images (w) in each well treated with rec.RSPO2. Data shown as mean ± SEM, n = 3 biological replicates. Data was analyzed by one way-ANOVA. Experiment was repeated twice. xz) After knocking down Lgr4 by siRNA, eP1 cells were treated with rec.RSPO2 (0.5ug/ml) for 24 h. Western blot images (x) and quantification (y) of Beta-Catenin protein in eP1 cells. Beta-actin protein levels were used as loading control. F(3,10)=52.68, P < 0.0001 by one way ANOVA test. Multiple comparison between groups was performed with Tukey FDR = 0.05. Lgr4 mRNA level (z) in eP1 cells 48 h post siRNA transfection. Data shown as mean ± SEM, n = 3-4 biological replicates (x, y), n = 6 independent wells (z). Data analysis was performed using two-tailed Student’s t-test (z). Nuclei were stained with Hoechst 33342 (blue). Scale bars, 100μm. This figure is related to Fig. 3. Source data
Extended Data Fig. 4
Extended Data Fig. 4. Rspo2 inhibits adipogenesis of eP1 cells in vivo.
a, b) Microscopy images of H&E staining of matrigel plugs with eP1 cells (a) and eP2 cells (b) without RSPO2 overexpression (top) and with RSPO2 overexpression (lower). Scale bar, 100 μm. Experiment was performed once. c, d) pUC57 plasmid insertion with ApoB and recombined tdTomato sequence. ApoB and recombined tdTomato standard curve generated with plasmid (d). e) Plasma RSPO2 level in CAG-GFP and CAG-Rspo2 ingWAT infection mice, n = 6 mice. Data are presented as mean values + /- SEM. Data analysis was performed using two-tailed Student’s t-test. f) Western blot images of RSPO2 in liver of ingWAT AAV infection mice. HSP90 served as a loading control. g) Immunohistochemistry staining of cleaved caspase-3 in ingWAT. Data are presented as mean values + /- SEM, n = 6 mice. This figure is related to Fig. 4. Source data
Extended Data Fig. 5
Extended Data Fig. 5. pAAV–CAG-GFP and pAAV-CAG-Rspo2 infection mice on HFD.
aj) Overexpression of RSPO2 by tail vein delivery of AAVs in mice (a). Images of ingWAT and visWAT (b), food intake per day (c), Time-resolved oxygen consumption (d), quantification of triglyceride per gram of liver (e), representative images of H&E staining of liver (f) from pAAV-CAG-GFP and pAAV-CAG-Rspo2 infection mice. Blood glucose (g) and area under curve (AUC) (h) shown by intraperitoneal pyruvate tolerance test. Triglyceride levels in blood (i) and hepatic triglyceride secretion rate (j) after tyloxapol injection. Data shown as mean ± SD (i, j), n = 6 mice. Data analysis was performed using two-tailed Student’s t-test. kp) Experimental scheme (k) for overexpression of RSPO2 in ingWAT by injection AAV into ingWAT. Quantification of RSPO2 in ingWAT by western blot (l) and in circulation (m). Body weight (n), tissue weight (o), and time-resolved oxygen consumption (p) of pAAV-CAG-GFP and pAAV-CAG-Rspo2 ingWAT infection mice. Data shown as mean ± SD, n = 5 mice (CAG-GFP); n = 6 mice (CAG-Rspo2). Data analysis was performed using two-tailed Student’s t-test. qr) Spearman correlation of serum RSPO2 level with HOMA-IR (q), mean adipocyte volume (r) in male and female subjects. The correlation coefficient was calculated using a Spearman’s Correlation Test. This figure is related to Fig. 6. Source data
Extended Data Fig. 6
Extended Data Fig. 6. snRNA-seq of ingWAT in mice with HFD and pAAV-CAG-GFP or pAAV-CAG-Rspo2 AAV.
a) Feature plot for the origin of pAAV-CAG-GFP or pAAV-CAG-Rspo2 conditions. b) Feature plot for the number of genes expressed in each nucleus. c) Feature plots for adipocyte markers Adipoq, Lep, Plin1, and Adrb3. d) Heat map of signature genes for each population. eg) Scatter plots for gene expression analysis between pAAV-CAG-GFP and pAAV-CAG-Rspo2 within adipocytes (e), macrophages-1 (f), and macrophages-2 (g). h) Heat map of signature genes for preadipocytes population PA-2-PA-5. i) Feature plots for Ctnnb1 in preadipocytes clusters in pAAV-CAG-GFP and pAAV-CAG-Rspo2 ingWAT, separated by conditions. j) Feature plots for Dpp4, Pparg, Fmo2 in preadipocytes clusters in pAAV-CAG-GFP and pAAV-CAG-Rspo2 ingWAT. k) Dot plots for representative markers of each cluster PA1-PA-5, separated by conditions. l) Scatter plots for gene expression analysis between pAAV-CAG-GFP and pAAV-CAG-Rspo2 within PA-1-PA-5. This figure is related to Fig. 7.
Extended Data Fig. 7
Extended Data Fig. 7. other markers expression in subpopulations of adipogenitors.
a) Scheme for HFD induced obesity. b) eP3 percentage in ingWAT quantified by FACS. Data show as mean ± SD, n = 6 biological replicates. Data was analyzed using two-tailed Student’s t-test. c) Circulating RSPO2 levels in chow and HFD fed mice. Data shown as mean ± SD, n = 6 biological replicates. Data was analyzed using two-tailed Student’s t-test. d) RSPO2 expression quantified by western blot in ingWAT, visWAT and liver. HSP90 served as loading control. Data show the mean ± SD, n = 6 biological replicates. Data was analyzed by two-tailed Student’s t-test. e) Rspo1-4 mRNA levels in Lin-Sca1+ cells and eP3 cells of ingWAT. Data are presented as mean + /- SEM, n = 4 biological replicates. Data was analyzed by one-way ANOVA, in Lin-Sca1+ group, F(3,12)=602, P < 0.0001; in eP3 group, F(3,12)=326, P < 0.0001. Source data

References

    1. Gesta S, Tseng YH, Kahn CR. Developmental origin of fat: tracking obesity to its source. Cell. 2007;131:242–256. - PubMed
    1. Muller S, Kulenkampff E, Wolfrum C. Adipose tissue stem cells. Handb. Exp. Pharmacol. 2016;233:251–263. - PubMed
    1. Ghaben AL, Scherer PE. Adipogenesis and metabolic health. Nat. Rev. Mol. Cell Biol. 2019;20:242–258. - PubMed
    1. Merrick, D. et al. Identification of a mesenchymal progenitor cell hierarchy in adipose tissue. Science10.1126/science.aav2501 (2019). - PMC - PubMed
    1. Kim JI, et al. Lipid-overloaded enlarged adipocytes provoke insulin resistance independent of inflammation. Mol. Cell. Biol. 2015;35:1686–1699. - PMC - PubMed

Publication types

MeSH terms