. 2020:216:122.
doi: 10.1007/s11214-020-00751-1. Epub 2020 Oct 26.

Cassini Exploration of the Planet Saturn: A Comprehensive Review

Affiliations

Cassini Exploration of the Planet Saturn: A Comprehensive Review

Andrew P Ingersoll. Space Sci Rev. 2020.

Abstract

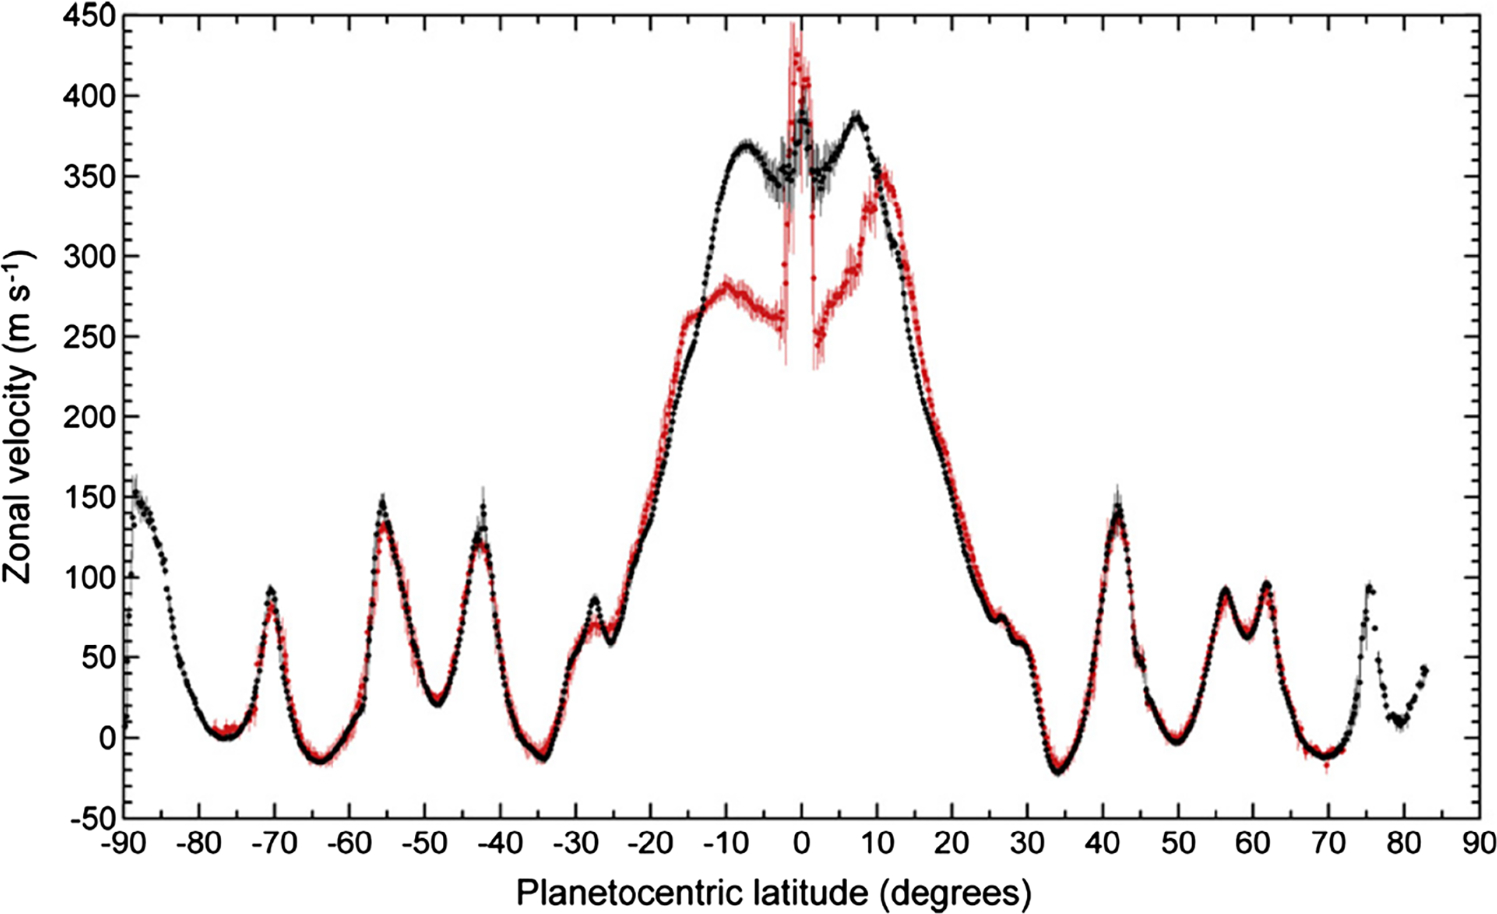
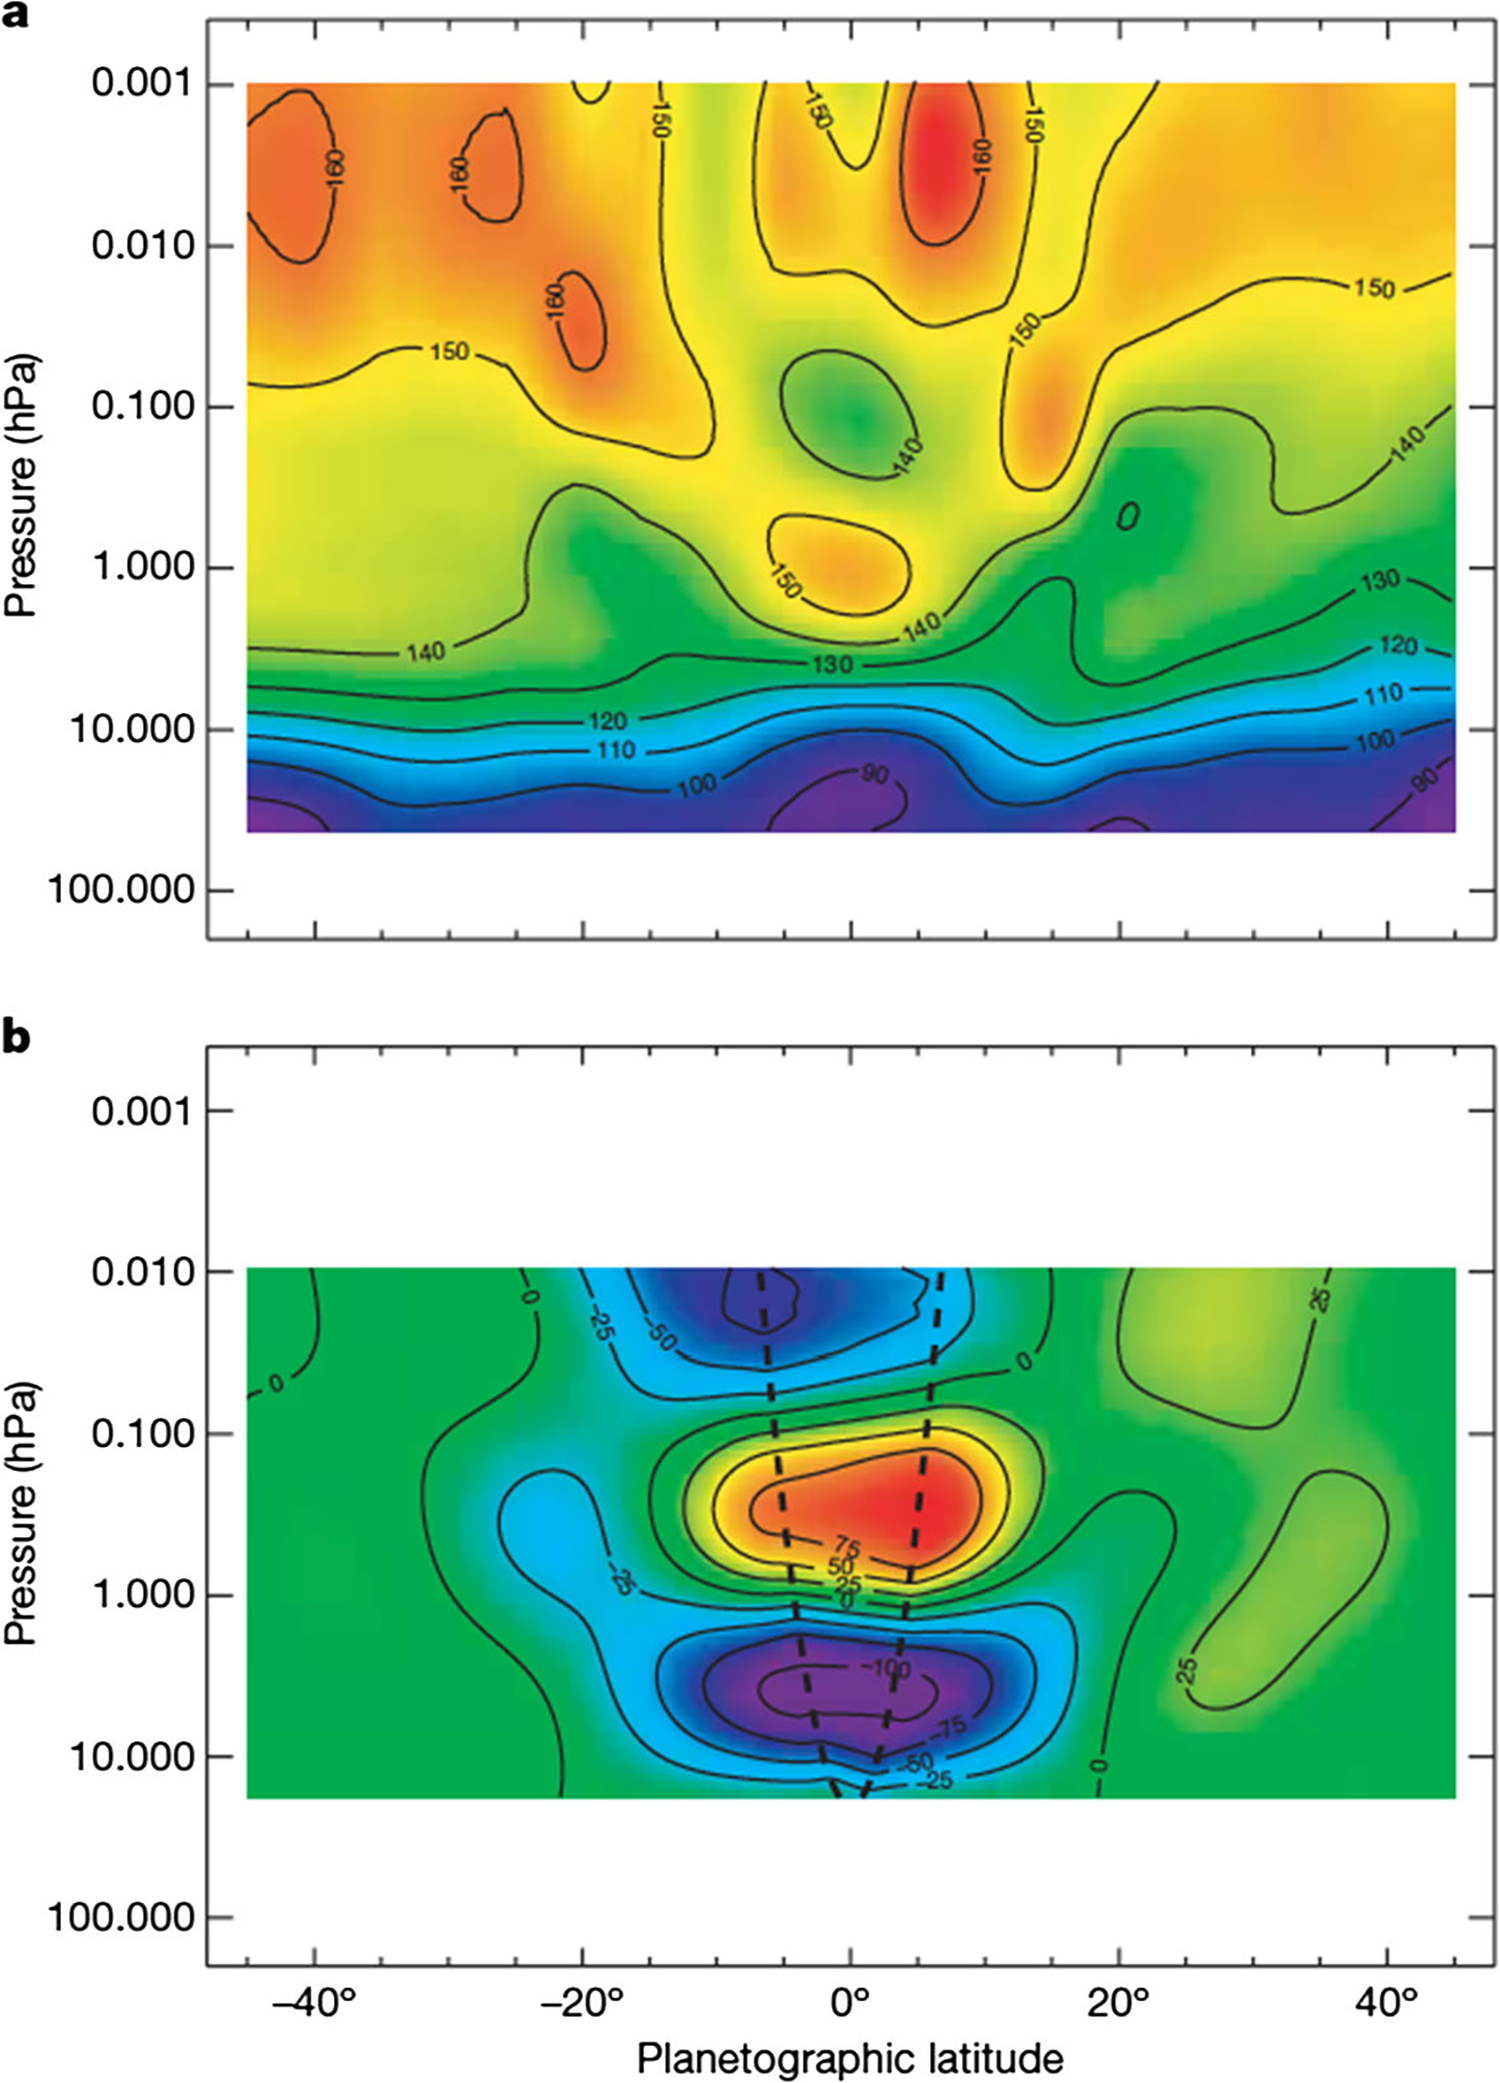
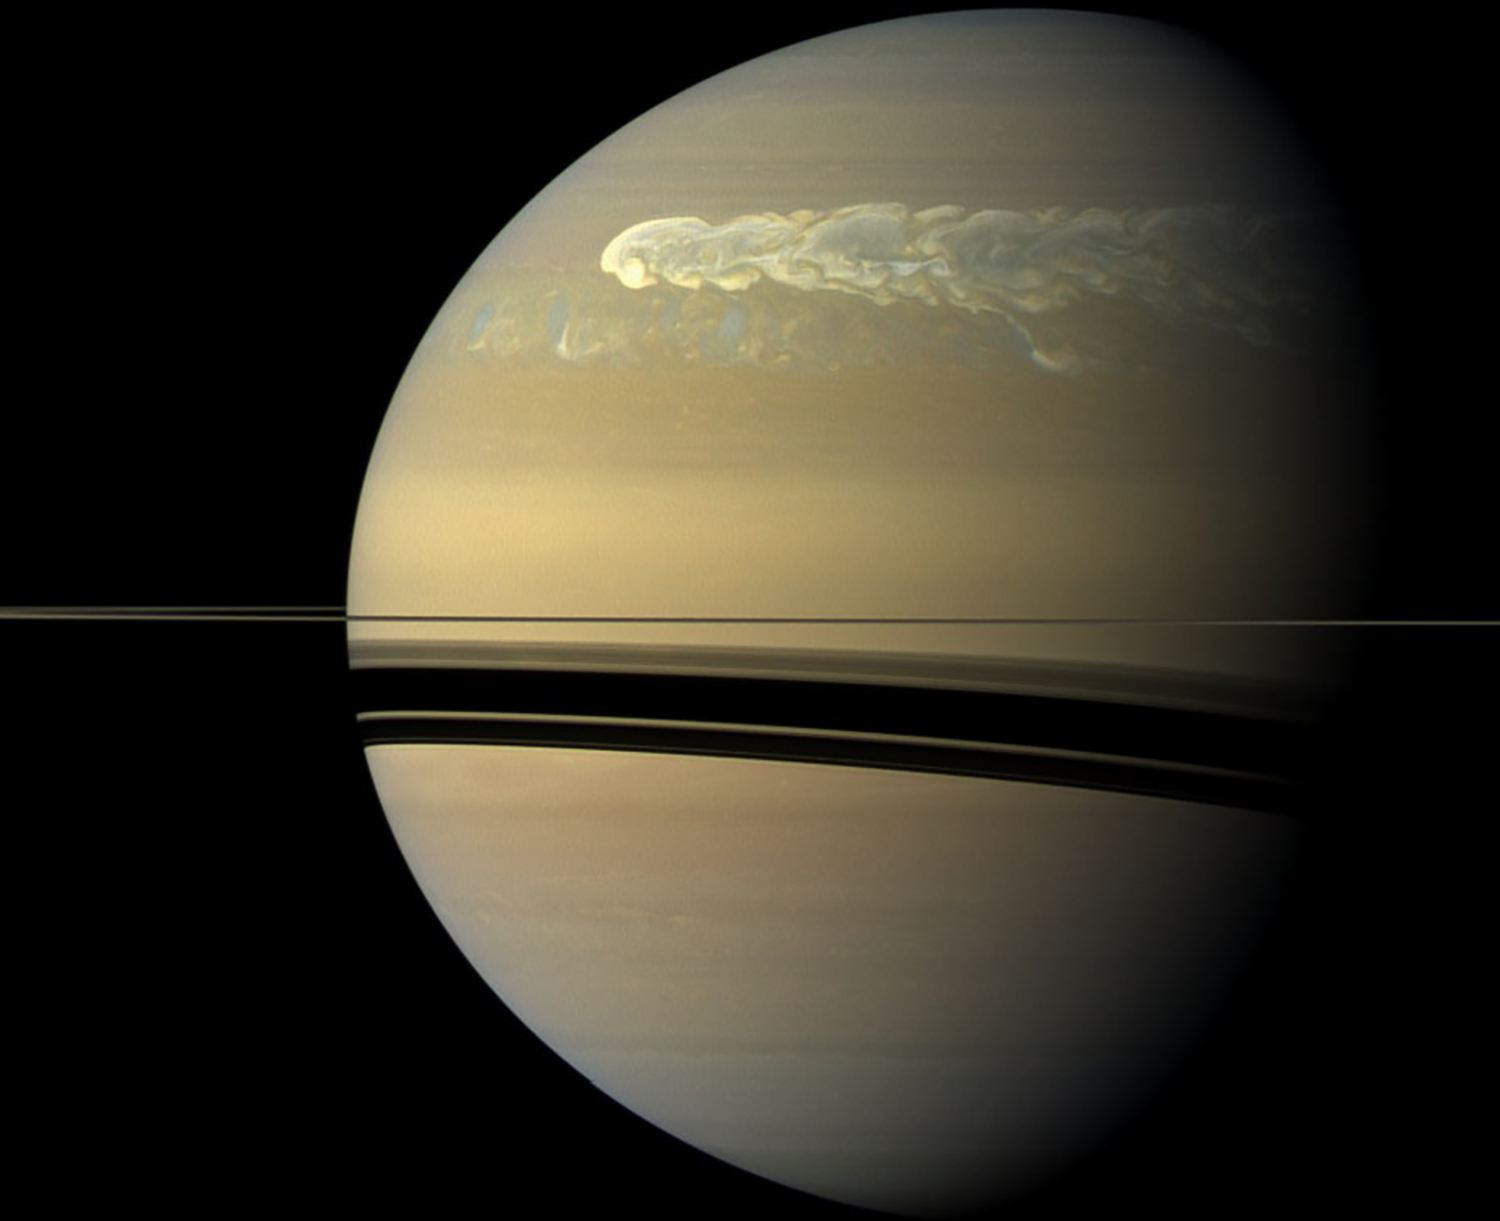
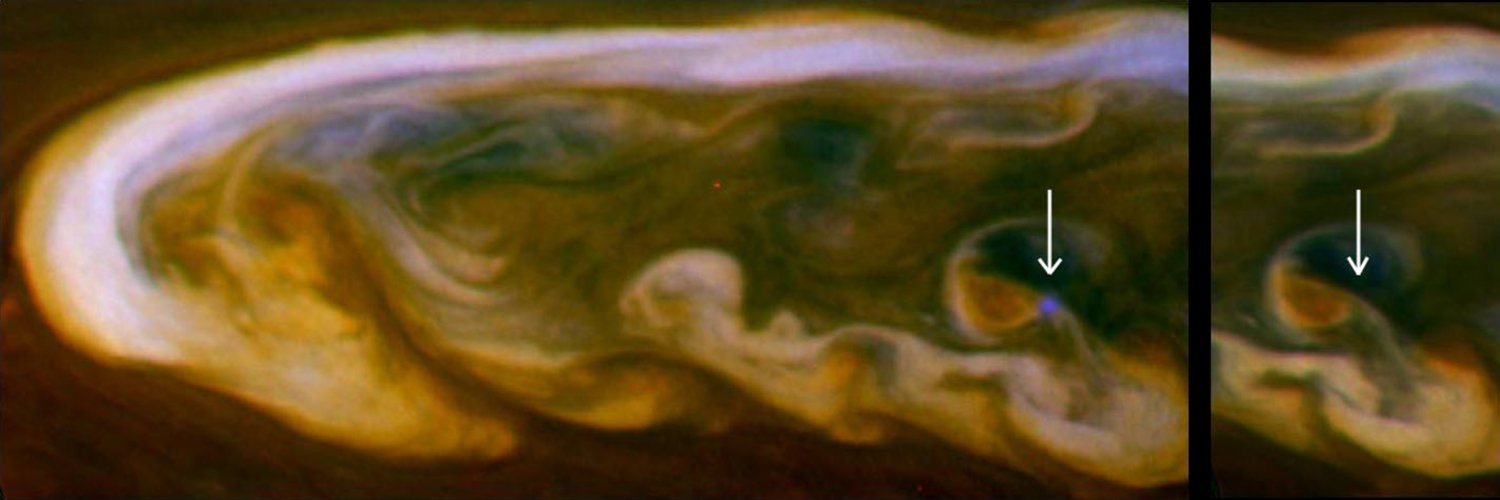
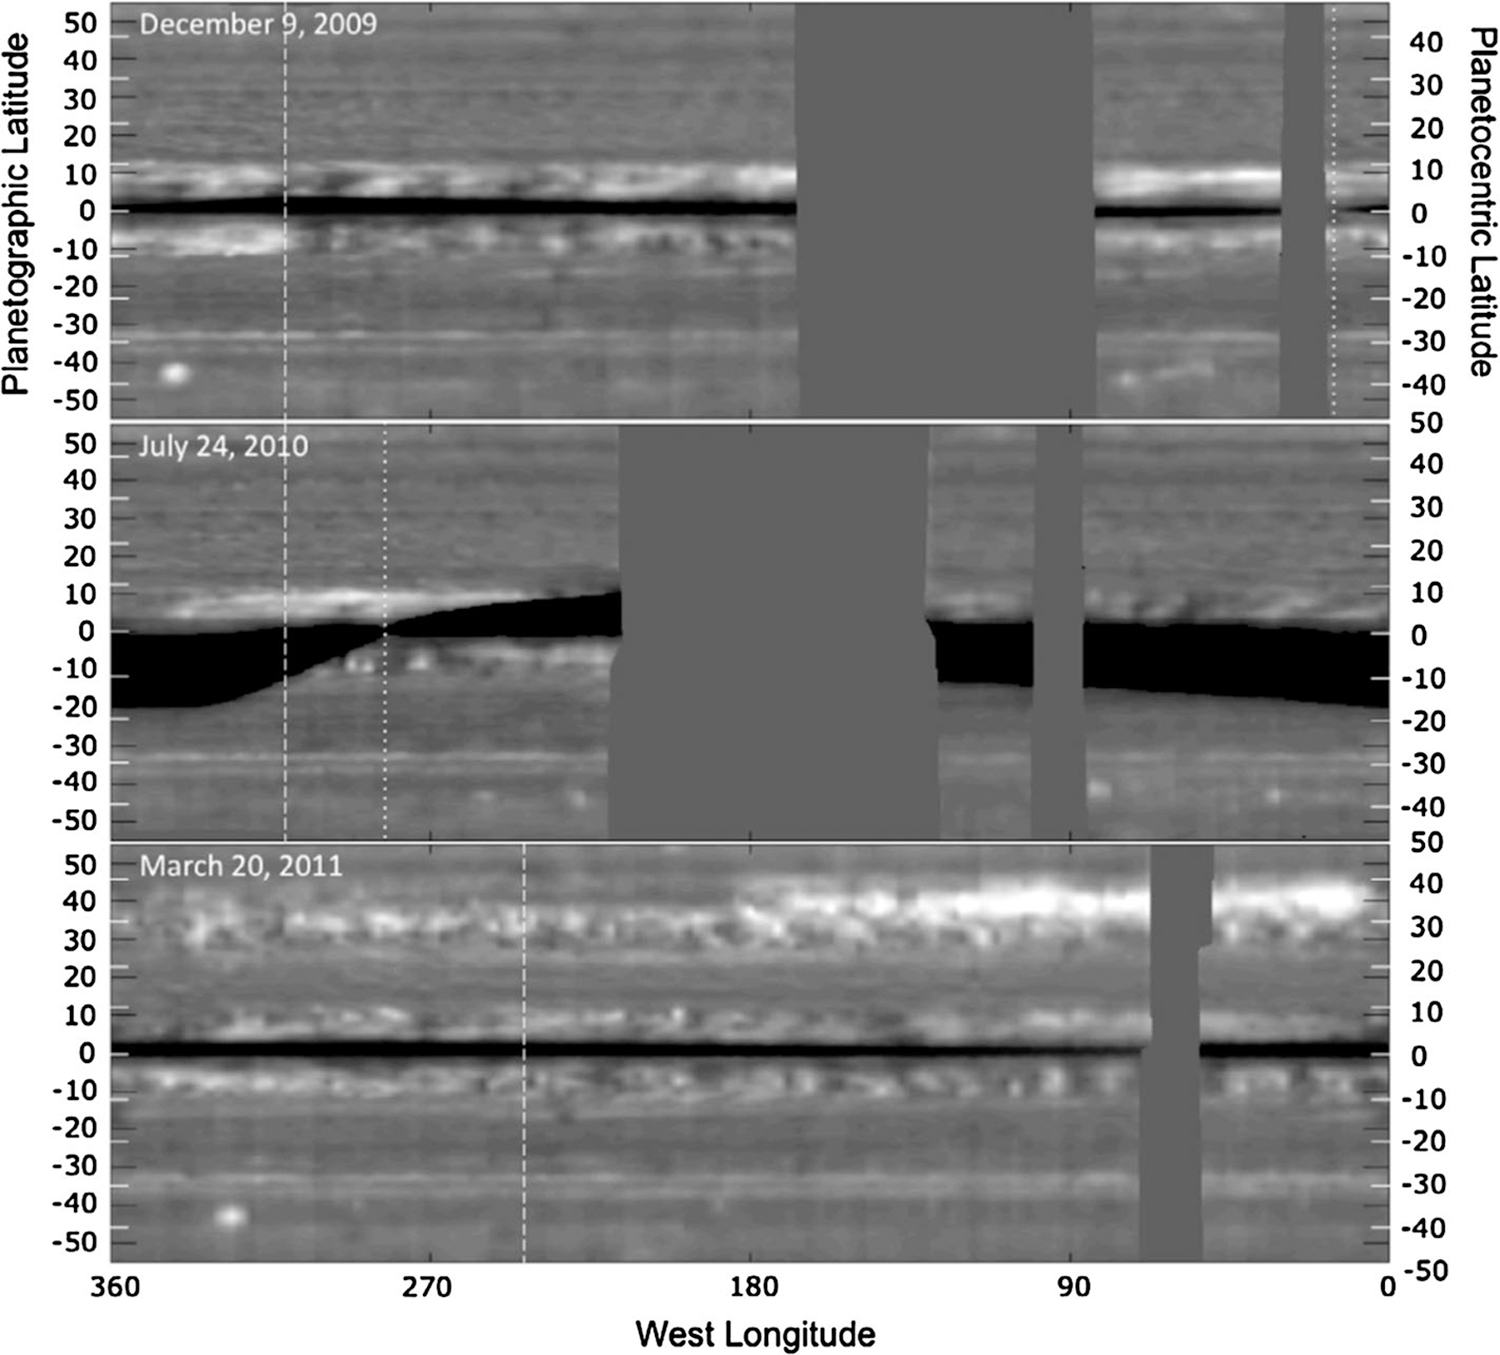
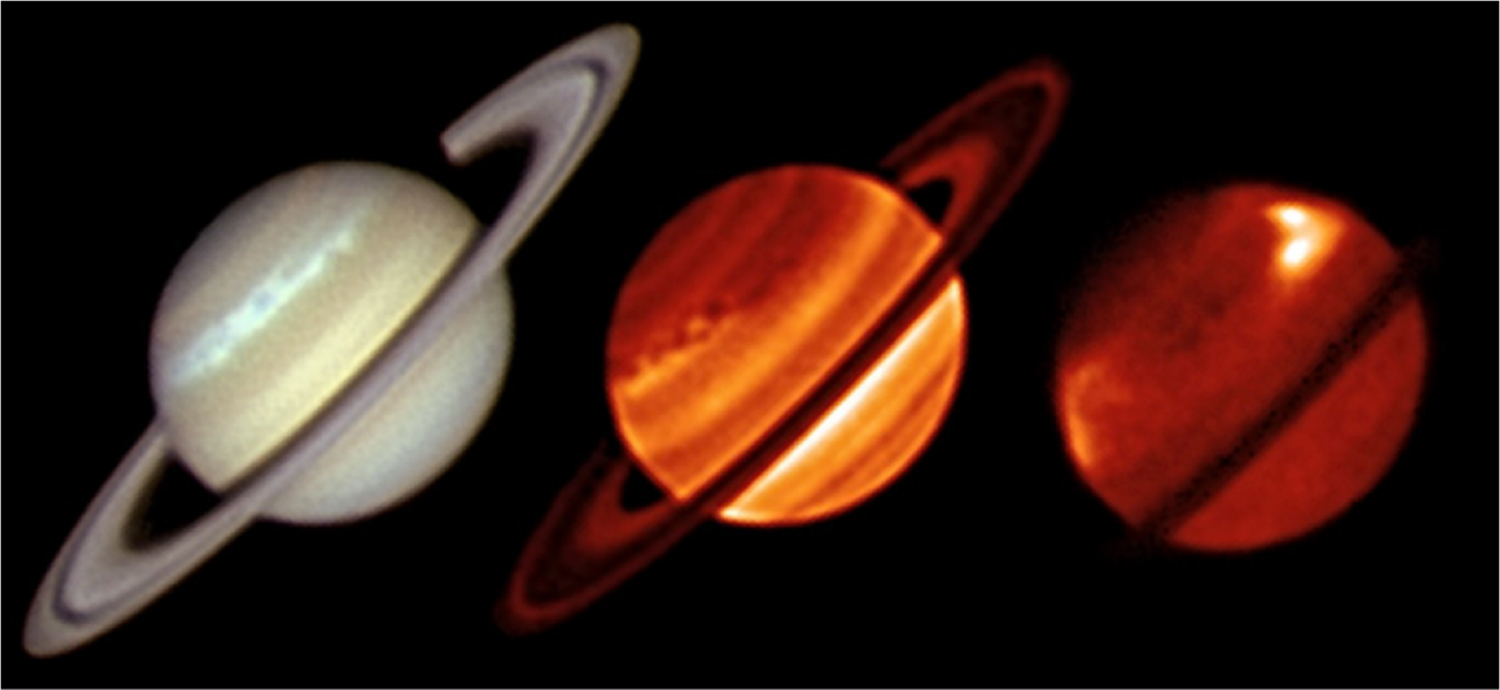
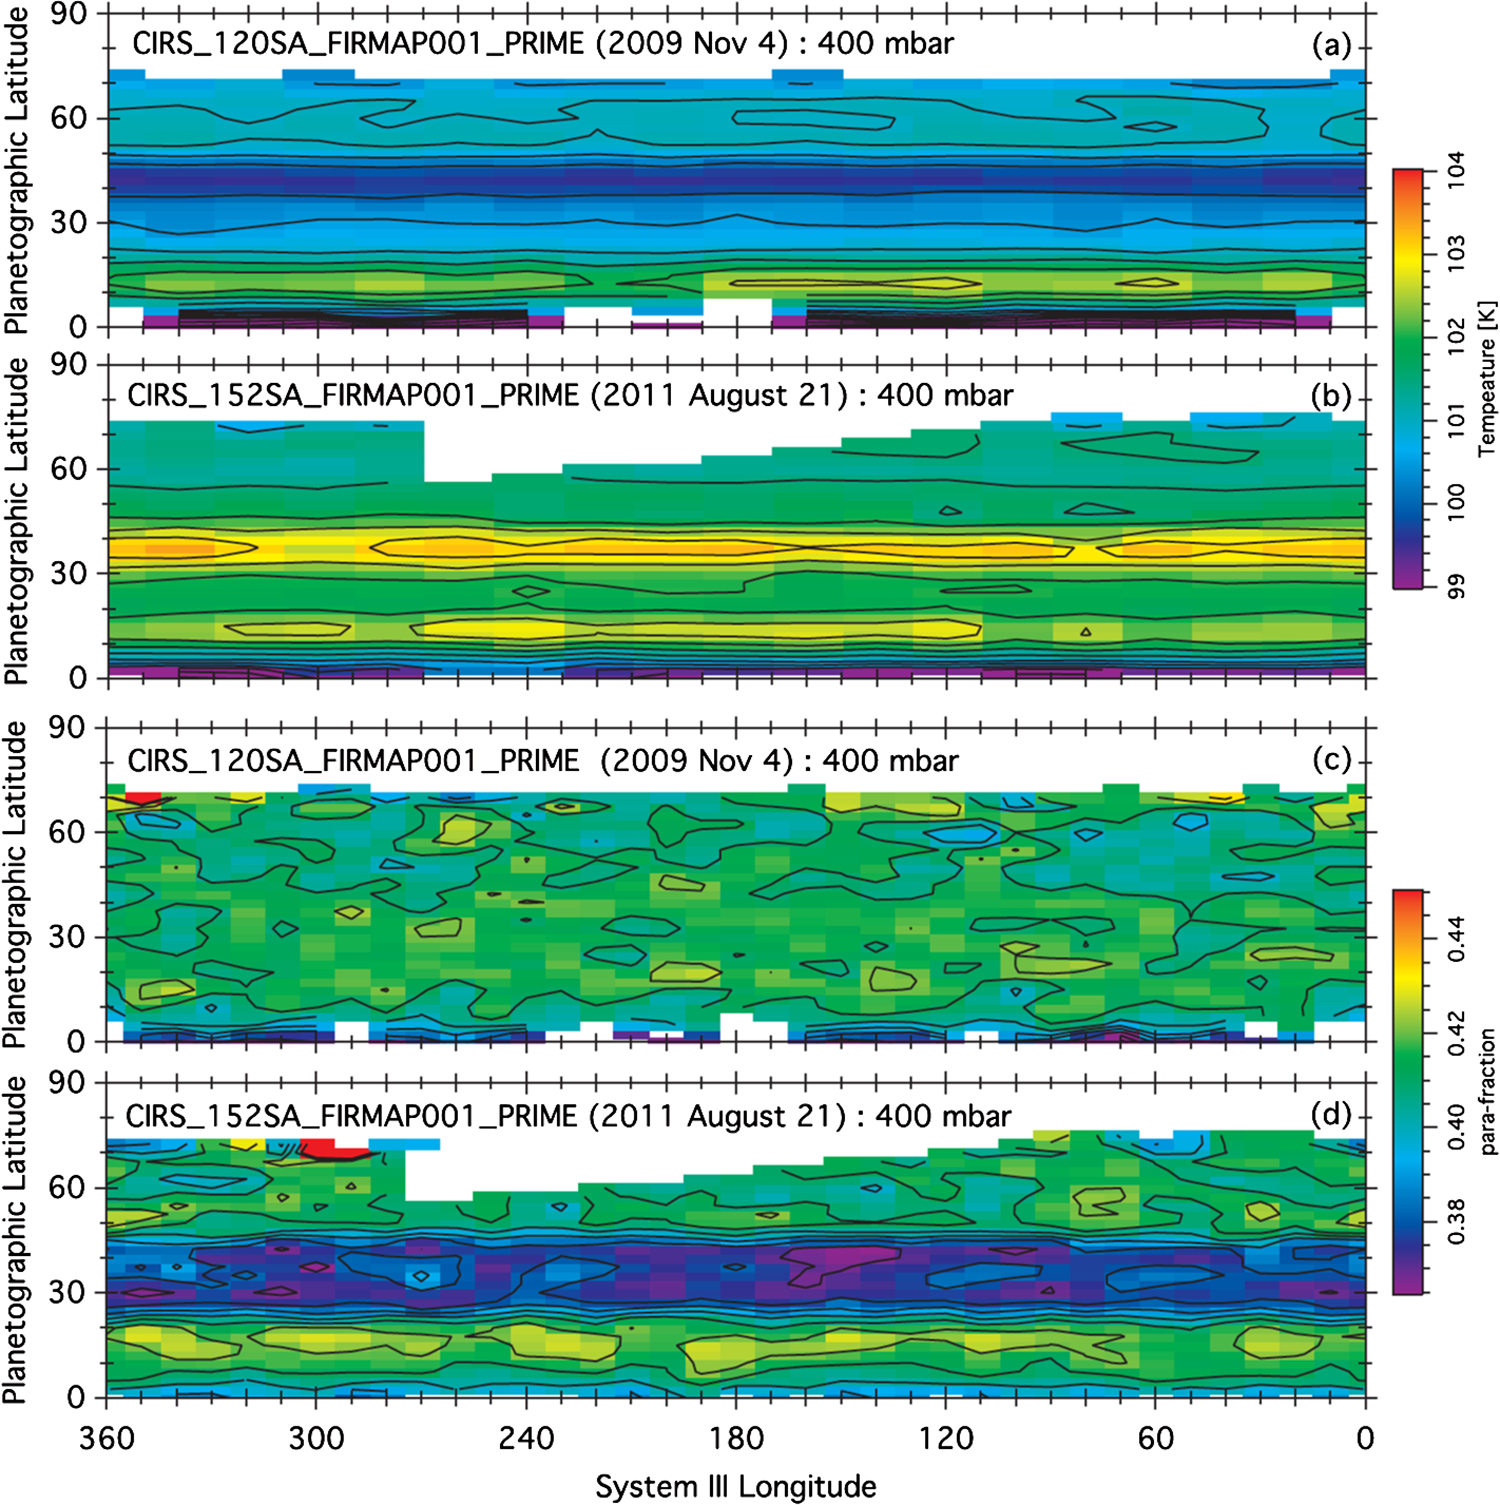
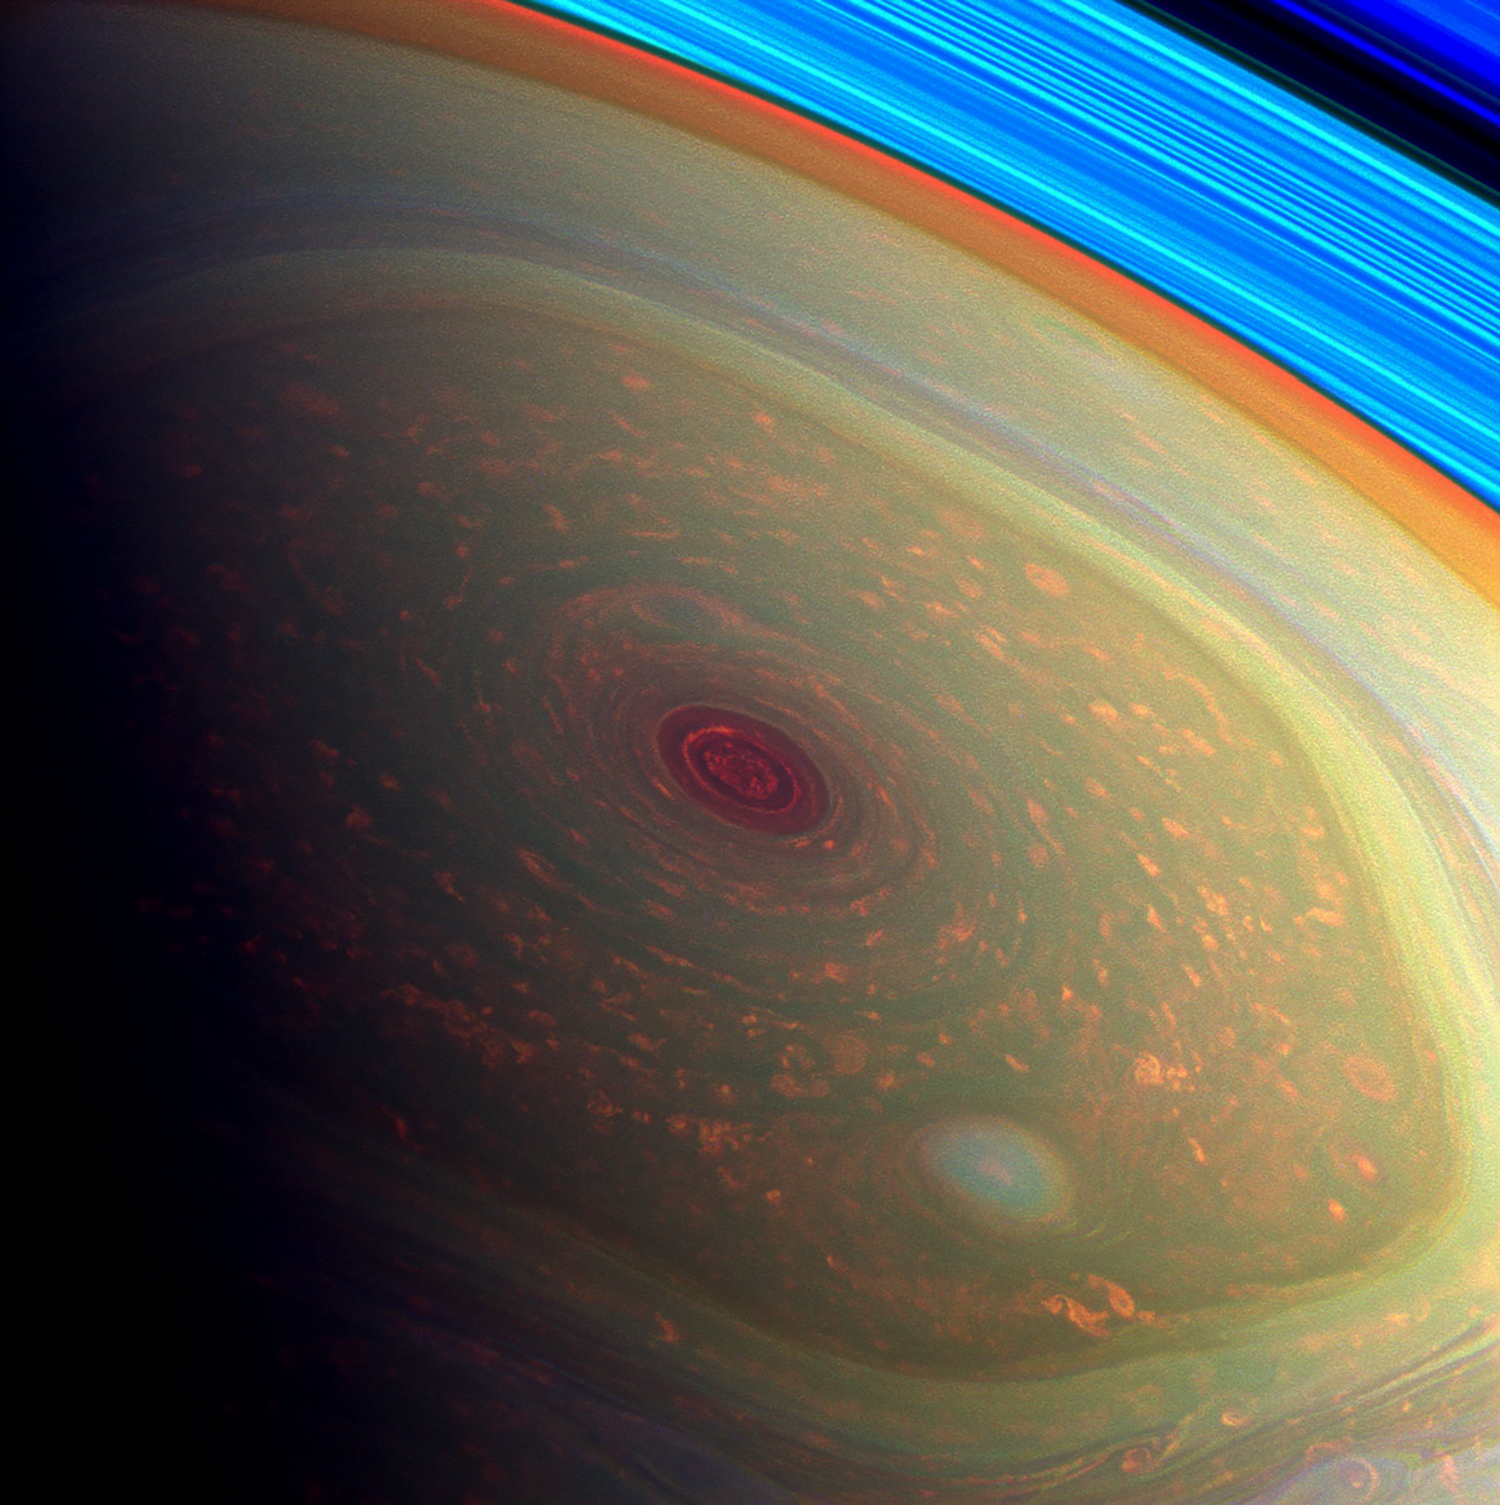
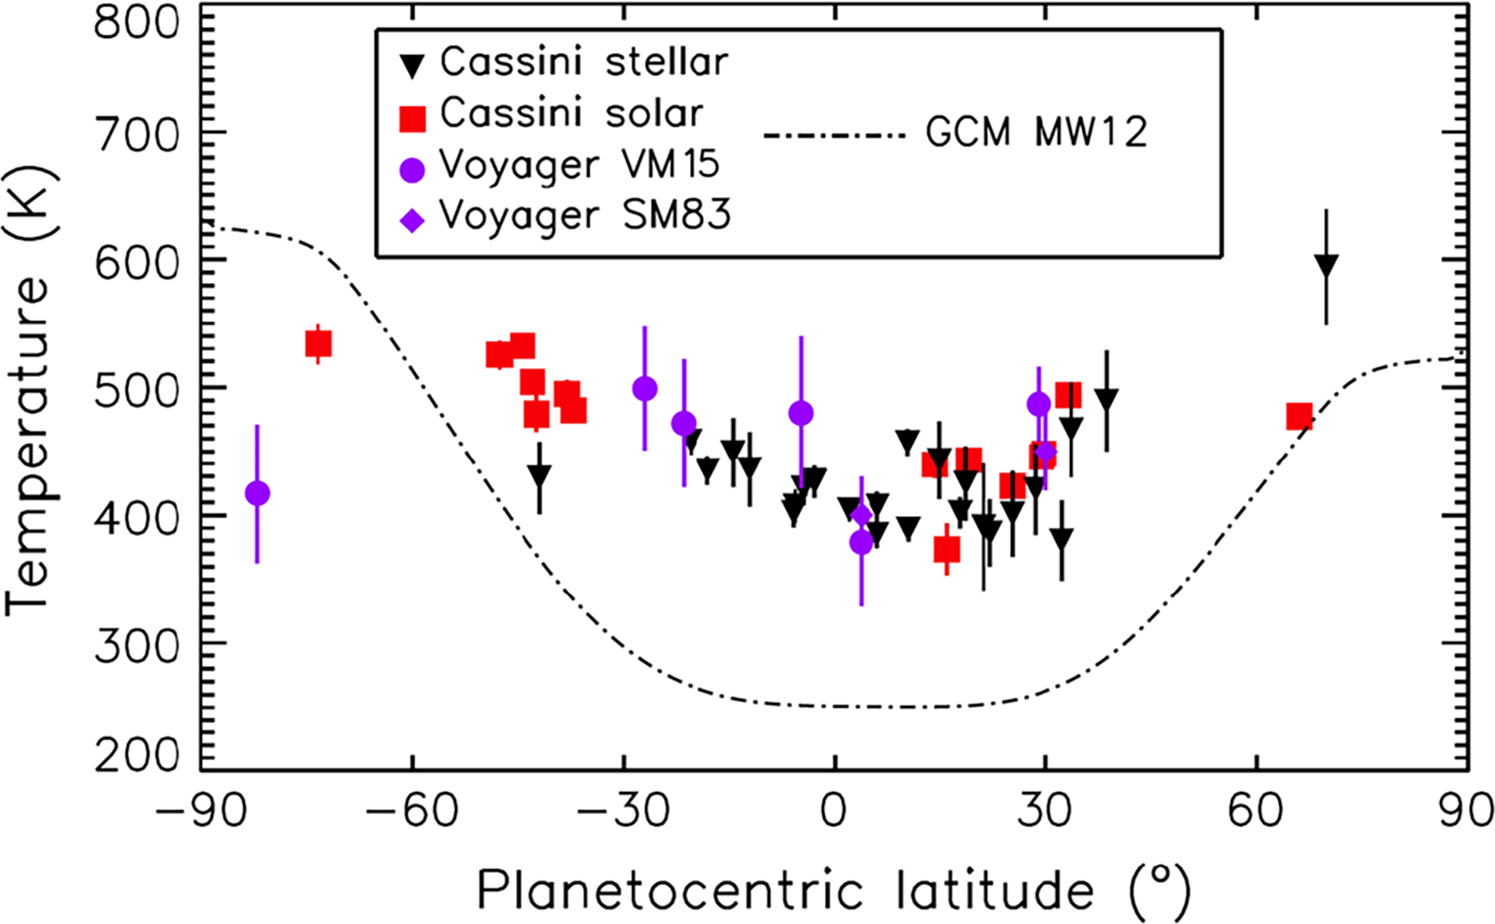
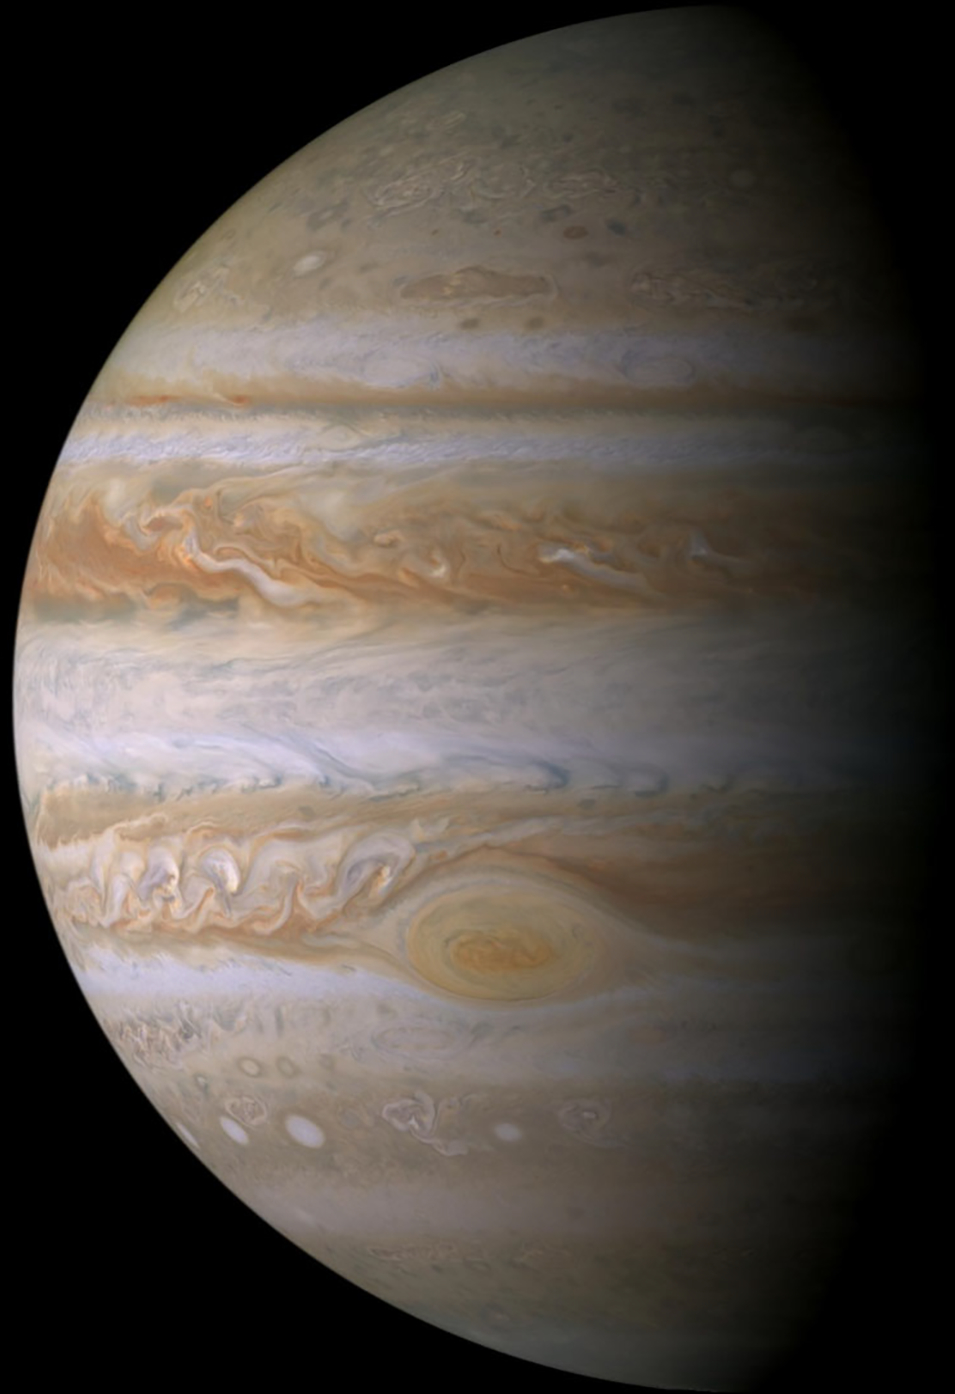
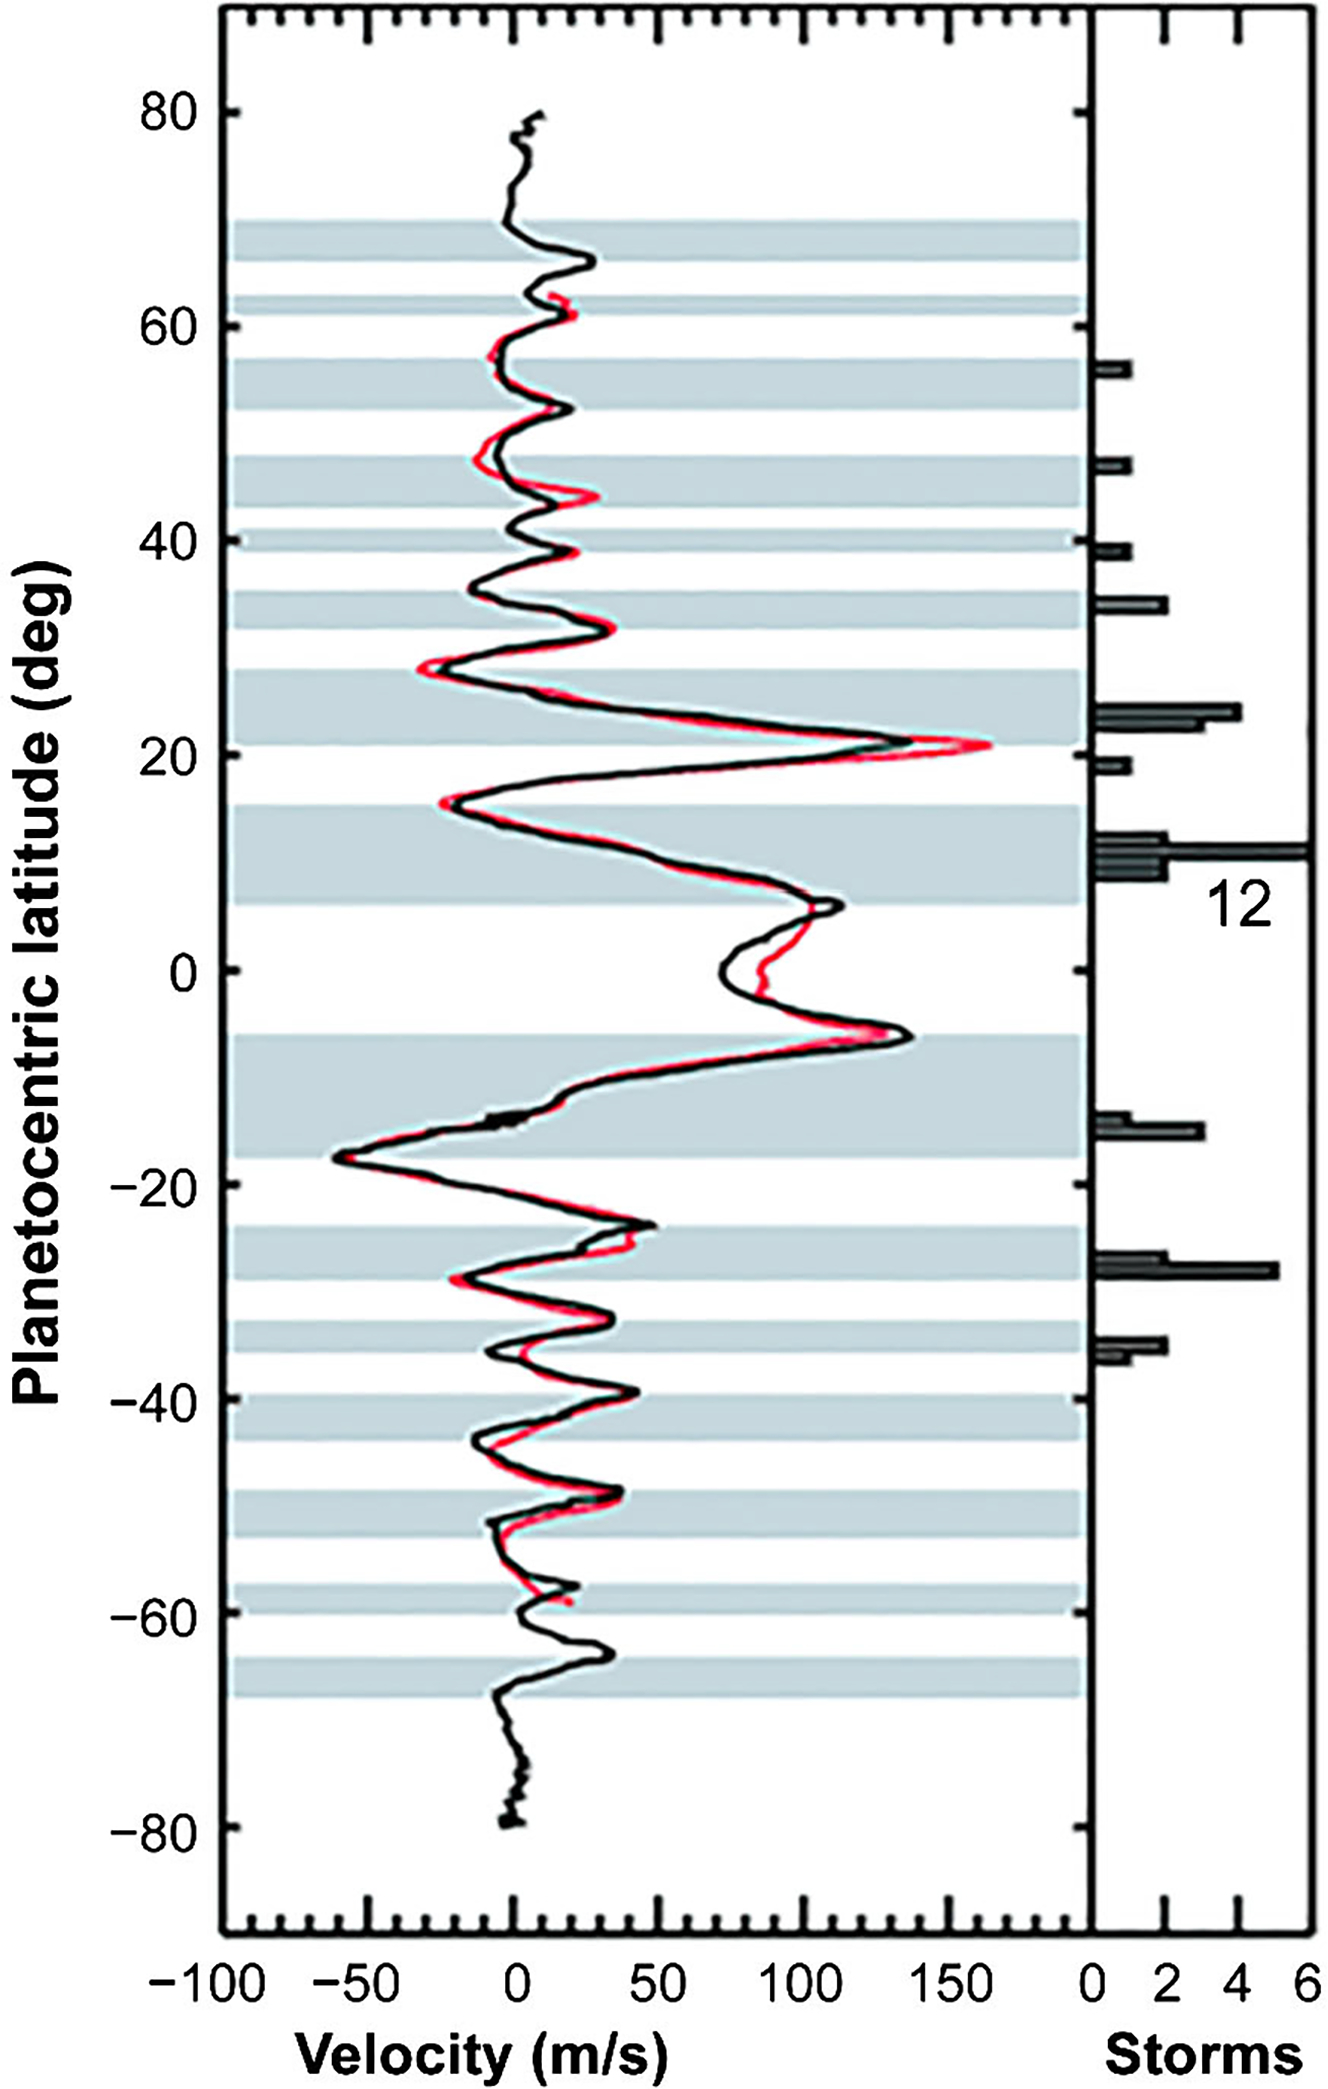
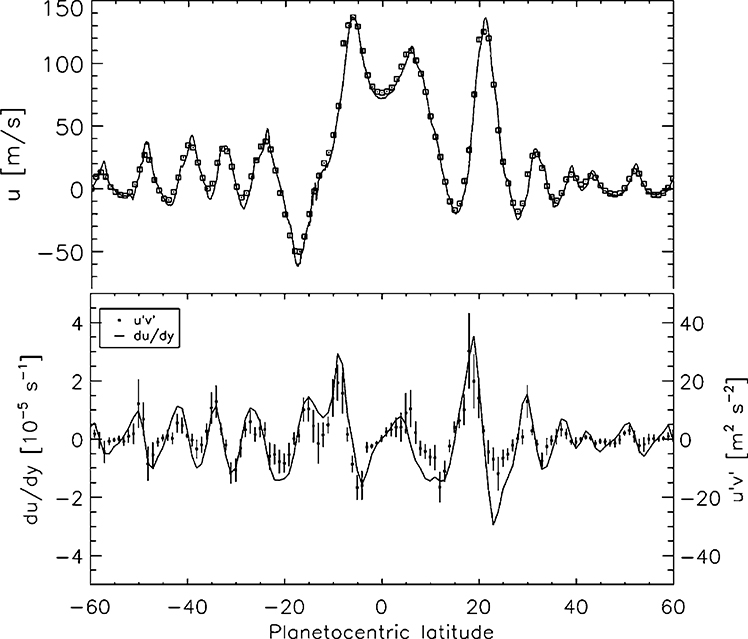
Before Cassini, scientists viewed Saturn's unique features only from Earth and from three spacecraft flying by. During more than a decade orbiting the gas giant, Cassini studied the planet from its interior to the top of the atmosphere. It observed the changing seasons, provided up-close observations of Saturn's exotic storms and jet streams, and heard Saturn's lightning, which cannot be detected from Earth. During the Grand Finale orbits, it dove through the gap between the planet and its rings and gathered valuable data on Saturn's interior structure and rotation. Key discoveries and events include: watching the eruption of a planet-encircling storm, which is a 20- or 30-year event, detection of gravity perturbations from winds 9000 km below the tops of the clouds, demonstration that eddies are supplying energy to the zonal jets, which are remarkably steady over the 25-year interval since the Voyager encounters, re-discovery of the north polar hexagon after 25 years, determination of elemental abundance ratios He/H, C/H, N/H, P/H, and As/H, which are clues to planet formation and evolution, characterization of the semiannual oscillation of the equatorial stratosphere, documentation of the mysteriously high temperatures of the thermosphere outside the auroral zone, and seeing the strange intermittency of lightning, which typically ceases to exist on the planet between outbursts every 1-2 years. These results and results from the Jupiter flyby are all discussed in this review.

Keywords: Atmosphere; Cassini; Giant planet; Interior; Jupiter; Saturn.


Conflict of interest statement

Conflict of interest None.

Figures

Fig. 1
Fig. 1
Image taken by the ISS in 2004 as Cassini was approaching Saturn. It was summer in the south, and the sunlight was driving a rich hydrocarbon chemistry. Temperatures were 10–20 K warmer in the south. The north was mostly shielded from sunlight, and the skies were blue, as shown by the sliver of atmosphere visible above the ring (PIA05389)
Fig. 2
Fig. 2
Tropospheric chemical abundances from Cassini VIMS. On first look, the profiles do not tell a consistent story. NH3 shows a high mole fraction at the equator, consistent with upwelling there and downwelling on either side at 10–12° latitude, but PH3 and AsH3 show low abundances at the equator, consistent with downwelling. The data may be indicating a double Hadley cell, with rising motion at the higher altitudes at the equator and sinking motion deeper down (Fletcher et al. 2011a)
Fig. 3
Fig. 3
Thermal emission of the planet in units of W m−2 from Cassini CIRS. In the south the season was early summer in 2004 and mid fall in 2013. The decrease in thermal emission in the south was due to cooling of the atmosphere. Comparing the years before and after 2011, it is clear that the great storm increased the thermal emission by 5–10% in the 30–40° latitude band, and that the anomaly persisted for several years (Li et al. 2015)
Fig. 4
Fig. 4
Temperature as a function of latitude and altitude from Cassini CIRS. In 2005 the season was mid-winter in the north, and in 2008 the season was late winter. Vernal equinox was August 10, 2009. The south is warmer than the north in both years, although most of the hemispheric contrast and most of the difference between 2005 and 2008 is confined to high altitudes (Fletcher et al. 2010)
Fig. 5
Fig. 5
Atmospheric zonal velocity for Saturn from Cassini ISS. The black curve is data from the 350 to 700 mbar levels, and the red curve is data from 100 to 200 mbar. The differences are small except for a latitude band ±15° from the equator (Garcia-Melendo et al. 2011b)
Fig. 6
Fig. 6
Oscillation of temperature (upper panel) and mean zonal wind (lower panel) at the equator from Cassini CIRS. The pattern moves down with time and has a ~15-year period (Orton et al. 2008; Fouchet et al. 2008; Guerlet et al. 2018). A similar pattern on Jupiter has a period of ~4 years (Orton et al. 1991). The Figure is from Fouchet et al. (2008)
Fig. 7
Fig. 7
Saturn imaged by Cassini ISS on February 25, 2011. The great storm of 2010–2011 is clearly visible in a band centered at 30–40° latitude. Since its appearance on December 5, 2010, the head of the storm had drifted west and overtaken the tail (PIA 12826)
Fig. 8
Fig. 8
Lightning flash in Saturn’s great storm of 2010–2011. The color composite consists of three images taken in rapid succession at three different wavelengths. A lightning flash occurred while the blue-filtered image was taken, making a blue spot in the composite image, left. The same region was imaged 30 minutes later and did not see a lightning flash, right (PIA14921)
Fig. 9
Fig. 9
Cylindrical projection of Saturn’s thermal emission at 2.2 cm wavelength, obtained by the Cassini RADAR in passive (non-transmitting) mode. The dark band at the equator is due to the rings, which are colder than the planet itself. The top two panels show the planet before the great storm. The lower panel shows warm emission at the location of the storm. Ammonia is the principal absorber at 2.2 cm wavelength, so the warm emission is due to ammonia depletion allowing radiation from deeper levels to reach the detector (Janssen et al. 2013)
Fig. 10
Fig. 10
Visible light image, left, and infrared images sensitive to temperatures in the 200–500 mbar level, center, and the 1–10 mbar level, right, on January 19, 2011. The stratospheric beacon stands out in the right image. The visible light image was from the International Outer Planet Watch database (Hueso et al. 2010), and the infrared images were from the Very Large Telescope (VLT) in Chile (Fletcher et al. 2011b)
Fig. 11
Fig. 11
Cassini CIRS cylindrical projections showing evidence of air being dredged up from below. The top two panels show tropospheric temperature before and after the storm and the band from 30–40° planetographic has warmed by several degrees. The bottom two panels show the two chemical states (nuclear spins parallel and nuclear spins anti-parallel) of molecular hydrogen H2 before and after the great storm. The 30–40° band shows a low para fraction, which indicates that the air has risen from below cloud base (Achterberg et al. 2014)
Fig. 12
Fig. 12
Saturn’s north polar hexagon and polar cyclone. This false color image was taken on November 27, 2012 by the Cassini ISS. The MT3 and MT2 images, which look dark due to absorption by methane gas in the atmosphere, are projected as blue and green, respectively. The CB2 image, which is not sensitive to methane absorption, is projected as red. The color balance is chosen to make the planet’s atmosphere look realistic. The rings look bright blue because there is no methane gas between the rings and the spacecraft. The red spot in the center extends from the pole to a latitude of 88–89°. It looks red in the false-color image because the clouds are deep and methane gas absorbs the sunlight before it can reflect off the clouds and reach the spacecraft. The spot is a cyclone with winds of ~100 ms−1 [PIA14946]
Fig. 13
Fig. 13
Eddy momentum transport for Saturn from Cassini ISS. The eastward and northward eddy winds u′ and v′ are the departures from the zonal means. Their product uv¯ averaged over longitude and multiplied by density is the northward eddy flux of eastward momentum. The fact that this quantity has the same sign as u¯/y, which is the increase of the mean eastward wind with latitude, says that the eddies are putting energy into the jets and not the reverse. The left panel is u¯, the middle panel is uv¯, and the right panel is the number of velocity measurements per 0.5° latitude bin (Del Genio and Barbara 2012)
Fig. 14
Fig. 14
Saturn electrostatic discharge counts, SEDs, which are roughly equivalent to lightning strikes, over a 2-year period starting in 2004. The SEDs are detected by the RPWS instrument, which is ON continuously. The lower panel shows ISS coverage of latitudes −34° to −36°, where all the storms were occurring, and it is clear that storms were seen only when the RPWS was detecting SED’s (Dyudina et al. 2007)
Fig. 15
Fig. 15
Ring seismology. The vertical dotted lines are the speeds of non-axisymmetric patterns in Saturn’s rings. Only the patterns that match the planet’s rotation are shown. They could be due to floating masses in the interior of Saturn. For comparison, periods of exterior magnetic fields, radio emissions, and clouds in the atmosphere are shown. Other patterns with speeds twice as fast are likely due to normal mode oscillations of the planet (Hedman and Nicholson 2014)
Fig. 16
Fig. 16
Hydrocarbons in the stratosphere at 1 mbar pressure. Ls = 0° and Ls = 360° are the first day of northern spring on successive years. The dashed lines are the results of a 1D photochemical model with seasons (Moses and Greathouse 2005). Ring shadow is included in the model, which has vertical mixing of species but no meridional circulation. The data are from the CIRS instrument on Cassini (Sylvestre et al. 2015)
Fig. 17
Fig. 17
Comparison of Cassini UVIS observations with Voyager observations and with a 3-D general circulation model. The model result is represented by the smooth dot-dashed line, and it is significantly low (colder) equatorward of ±60° in both hemispheres. The problem is that the air from the Polar Regions, heated by auroral currents, cools before it reaches the lower latitudes. What keeps it warm is an ongoing mystery (Koskinen et al. 2015)
Fig. 18
Fig. 18
The highest-resolution, full-disk color mosaic of Jupiter ever taken. Jupiter more than filled the field of view of the ISS, so the mosaic was assembled from over 30 individual images, allowing for the planet’s rotation as the images were taken [PIA04866]
Fig. 19
Fig. 19
Atmospheric zonal velocity for Jupiter. The black curve is from Cassini ISS data in late 2000, and the red curve is from Voyager data in mid-1979. The jets are remarkably steady over this 21-year interval (Porco et al. 2003)
Fig. 20
Fig. 20
Eddy momentum transport for Jupiter from Cassini ISS. The eastward and northward eddy winds u′ and v′ are the departures from the zonal means. Their product uv¯ averaged over longitude and multiplied by density is the northward eddy flux of eastward momentum. The fact that this quantity has the same sign as u¯/y, which is the increase of the mean eastward wind with latitude, says that the eddies are putting energy into the jets and not the reverse (Salyk et al. 2006)
Fig. 21
Fig. 21
Chemical tracers in Jupiter’s atmosphere at 5 mbar from Cassini CIRS. Both acetylene and ethane are formed at low latitudes by solar UV. In photochemical equilibrium their abundances would be greatest at pressures less than 0.1 mbar. C2H2 has a short chemical time constant, ~ 3 × 10⁷ s, so its abundance reflects photochemical equilibrium with lower sunlight toward the poles. C2H6 has a long lifetime, ~ 3 × 10¹⁰ s, so its abundance at 5 mbar reflects transport by the meridional circulation. The time constant of this circulation is between the lifetimes of the two molecules (Nixon et al. 2007)

References

    1. Abbas MM, LeClair A, Owen T, Conrath BJ, Flasar FM, Kunde VG et al., The nitrogen isotopic ratio in Jupiter’s atmosphere from observations by the Composite Infrared Spectrometer on the Cassini spacecraft. Astrophys. J. 602, 1063–1074 (2004). 10.1086/381084 - DOI
    1. Abbas MM et al., Distribution of CO2 in Saturn’s atmosphere from Cassini/CIRS infrared observations. Astrophys. J. 776(2), 73 (2013). 10.1088/0004-637x/776/2/73 - DOI
    1. Achterberg RK, Conrath BJ, Gierasch PJ, Cassini CIRS retrievals of ammonia in Jupiter’s upper troposphere. Icarus 182, 169–180 (2006). 10.1016/j.icarus.2005.12.020 - DOI
    1. Achterberg RK, Gierasch PJ, Conrath BJ, Fletcher LN, Hesman BE, Bjoraker GL, Flasar FM, Changes to Saturn’s zonal-mean tropospheric thermal structure after the 2010–2011 northern hemisphere storm. Astrophys. J. 786(2), 92 (2014). 10.1088/0004-637x/786/2/92 - DOI
    1. Achterberg RK, Flasar FM, Bjoraker GL, Hesman BE, Gorius NJP, Mamoutkine AA et al., Thermal emission from Saturn’s polar cyclones. Geophys. Res. Lett. 45(11), 5312–5319 (2018). 10.1029/2018GL078157 - DOI

LinkOut - more resources