. 2022 Jan 10:13:73-89.
doi: 10.18632/oncotarget.28167. eCollection 2022.

Altered glycosylation of several metastasis-associated glycoproteins with terminal GalNAc defines the highly invasive cancer cell phenotype

Affiliations

Altered glycosylation of several metastasis-associated glycoproteins with terminal GalNAc defines the highly invasive cancer cell phenotype

Elham Khosrowabadi et al. Oncotarget. .

Abstract

Several distinct metastasis-associated glycosylation changes have been shown to promote cancer cell invasion and metastasis, the main cause of death of cancer patients. However, it is unclear whether their presence reflects cell- or tissue-specific variations for metastasis, or species needed to drive different phases of the metastatic cascade. To address this issue from a different perspective, we investigated here whether different cancer cell lines share any glycotopes that are common and important for their invasive phenotype. By using lectin microarray glycan profiling and an established myoma tissue-based 3D invasion assay, we identified a single glycotope recognized by Helix Pomatia agglutinin (HPA), whose expression level in different cancer cells correlated significantly with their invasive potential. Lectin pull-down assay and LC-MS/MS analysis in highly- (A431 and SW-48) and poorly invasive (HepG2 and RCC4) cancer cells revealed ~85 glycoproteins of which several metastasis-promoting members of the integrin family of cell adhesion receptors, the epidermal growth factor receptor (EGFR) and the matrix metalloproteinase-14 (MMP-14) were among the abundant ones. Moreover, we showed that the level of the GalNAc glycotope in MMP-14, EGFR, αV-, β1- and β4 integrin in highly and poorly invasive cancer cells correlated positively with their invasive potential. Collectively, our findings suggest that altered glycosylation of several metastasis-associated glycoproteins with terminal GalNAc drives the highly invasive cancer cell phenotype.

Keywords: Helix Pomatia agglutinin (HPA); cancer; glycocode; glycosylation; invasion; terminal GalNAc.


Conflict of interest statement

CONFLICTS OF INTEREST Authors have no conflicts of interest to declare.

Figures
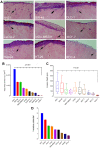
Figure 1
Figure 1. Invasion potential of different cancer cell lines.
(A) Myoma-tissue-based 3D invasion assay. Cells were seeded on top of myoma discs, allowed to grow for 21 days before fixing and processing for histochemical staining. Sections were cut perpendicularly to the seeded cell layer, stained, and imaged before quantification. Representative figures of the invasive foci inside the myoma tissue are shown (arrowheads). (B) Total invasion area (μm2) of the foci in each cell line. (C) The median invasion depth of the foci from the seeded cell layer. Twelve sections from each myoma disc (n = 2/24) were used for the quantification with ImageJ software. The whiskers indicate 10th to 90th percentiles. (D) A bar graph showing the relative invasive potential of each cancer cell type. The values were calculated by scaling the medians of the total area and the median depth using scores from 5 (high) to 0 (low). Invasive potential was calculated as the mean of the two scores.
Figure 2
Figure 2. Comparison of glycosylation profiles between different cancer cell types.
(A) Heat map representation of the lectin microarray glycan profiles. The rows represent normalized median intensity values of each lectin. Three independent samples were used for determination of the intensity values in each cell line. The color scale from blue to red indicates low to high signal intensities. Non-malignant COS-7 cells were used as a reference cell line for ranking. (B) Comparison of the glycan profiles by using principal component analysis tool in Excel. Normalized intensity values for each lectin were used for the analysis. The number of components is determined automatically from the input values. (C) Hierarchical clustering analysis of the glycosylation differences or similarities between different cancers cell type. Normalized median intensity values of each lectin, the SPSS software with Ward linkage analysis and Euclidean correlation coefficient as the distance metric were used for the analysis. (D) Comparison of the glycosylation profiles between subcluster forming cell lines. In each plot, normalized median intensity values were plotted against each other. The lines represent linear correlation equations. The R2 values are shown for each plot.
Figure 3
Figure 3. Identification of lectins that are specific for each clustered cell pair.
Lectins that define clustered cell pairs were identified by using conditional formatting algorithms embedded in Excel. In brief, similar lectin binding intensities were searched for each clustered cell by setting an acceptable intensity limit to 1.5 × SD. Any values within these limits were designated as similar whereas the ones exceeding these limits were designated as dissimilar. Specific lectins for each cell pair were then selected based on its similarity between the cell pair and dissimilarity in the other cell lines. Normalized median intensity values (±SD) were used for comparisons. (A) Selected lectins and their sugar specificities specific for each clustered cell pair. (B) Histogram showing lectin binding intensities specific for the clustered MCF-7/MDA-MB231 cell pair (marked by red box). (C) Histogram showing lectin binding intensities specific for the clustered DLD-1/CaCo-2 cell pair. (D) Histogram showing lectin binding intensities specific for the clustered RCC4, HepG2 and HT-29 cell lines.
Figure 4
Figure 4. Correlation and impact of HPA binding to cancer cell invasive potential.
(A) Correlation analysis between lectin binding and invasive potential of different cancer cell types. Normalize median intensity values for each lectin and relative invasive potential (Figure 1D) were used for the analysis with Excel’s data analysis tool pack. Pearson R values are shown and ranked from high to low and marked with red (high) and blue (low) colors. (B) Correlation analyses of selected lectins with their normalized median intensity values in relation to invasive potential of different cancer cell types. Pearson R values and statistical significance of the correlation are shown at the bottom of the table. Regression analysis with ANOVA was used for testing the statistical significance. (C) Multiple linear regression analysis showing the contribution of each lectin to cancer cell invasive potential. Each bar represents the contribution (as percentages) of the lectins used for the analysis (bottom). (D and E) Comparison of the cancer cell invasive potential (D) with the level of HPA binding glycotopes (E) in different cancer cell lines. Correlation and regression analyses showed a significant correlation between these two variables (R-value of 0.76 and p-value of 0.007**).
Figure 5
Figure 5. Identification of HPA binding glycoproteins and their comparison between highly and poorly invasive cancer cell types.
(A) HPA-binding proteins in highly (A431 and SW-48) and poorly (RCC4 and HepG2) invasive cancer cell samples as revealed by lectin blotting with biotinylated HPA. Complexes were visualized using HRP-conjugated streptavidin. A representative blot is shown. (B) Immunoblotting of selected HPA-binding glycoproteins after lectin pull-down with relevant antibodies in highly (A431, SW-48) and poorly (RCC4 and HepG2) invasive cancer cells. The star (*) in laminin β3 blot denotes a non-specific band. A representative blot is shown. (C) Immunoblotting of the HPA binding glycoproteins in input samples of the same cell types. A representative blot is shown. (D) Quantification of HPA pull-down protein levels in the immunoblot (B). ImageJ software was used for quantification of the band intensities as arbitrary units (AU). (E) Quantification of protein input levels in the immunoblot (C). ImageJ software was used for quantification of the band intensities as arbitrary units (AU). (F) Correlation analysis between HPA pull-down protein levels with invasion potential. Excel data analysis tool pack’s correlation and regression analyses with ANOVA were used to get the Pearson R and significance values. The stars (*) denote the statistical significance of p < 0.01** and p < 0.05*, respectively.

References

    1. Kohyama-Koganeya A, Nabetani T, Miura M, Hirabayashi Y. Glucosylceramide synthase in the fat body controls energy metabolism in Drosophila. J Lipid Res. 2011; 52:1392–99. 10.1194/jlr.M014266. - DOI - PMC - PubMed
    1. Ryczko MC, Pawling J, Chen R, Abdel Rahman AM, Yau K, Copeland JK, Zhang C, Surendra A, Guttman DS, Figeys D, Dennis JW. Metabolic Reprogramming by Hexosamine Biosynthetic and Golgi N-Glycan Branching Pathways. Sci Rep. 2016; 6:23043. 10.1038/srep23043. - DOI - PMC - PubMed
    1. Akintayo A, Stanley P. Roles for Golgi Glycans in Oogenesis and Spermatogenesis. Front Cell Dev Biol. 2019; 7:98. 10.3389/fcell.2019.00098. - DOI - PMC - PubMed
    1. Bishop JR, Schuksz M, Esko JD. Heparan sulphate proteoglycans fine-tune mammalian physiology. Nature. 2007; 446:1030–37. 10.1038/nature05817. - DOI - PubMed
    1. Varki A. Biological roles of glycans. Glycobiology. 2017; 27:3–49. 10.1093/glycob/cww086. - DOI - PMC - PubMed

Publication types