

Nicotinamide riboside supplementation confers marginal metabolic benefits in obese mice without remodeling the muscle acetyl-proteome
- PMID: 35028529
- PMCID: PMC8741497
- DOI: 10.1016/j.isci.2021.103635
Nicotinamide riboside supplementation confers marginal metabolic benefits in obese mice without remodeling the muscle acetyl-proteome
Abstract
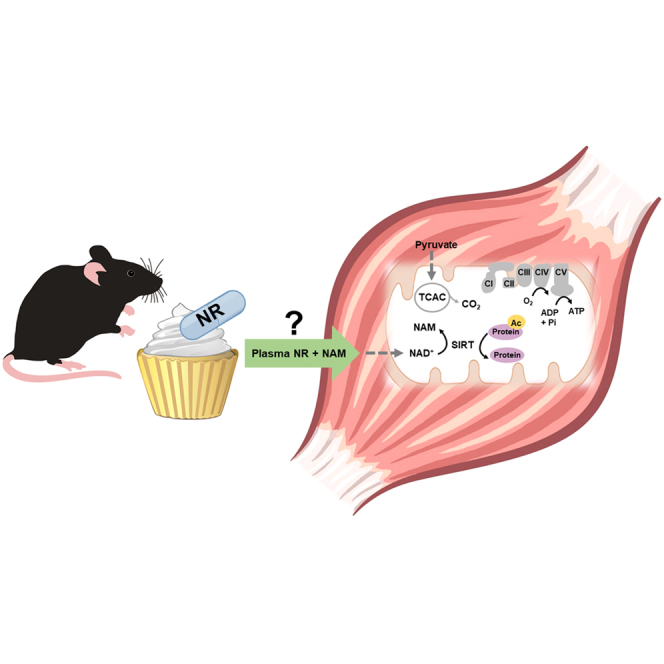
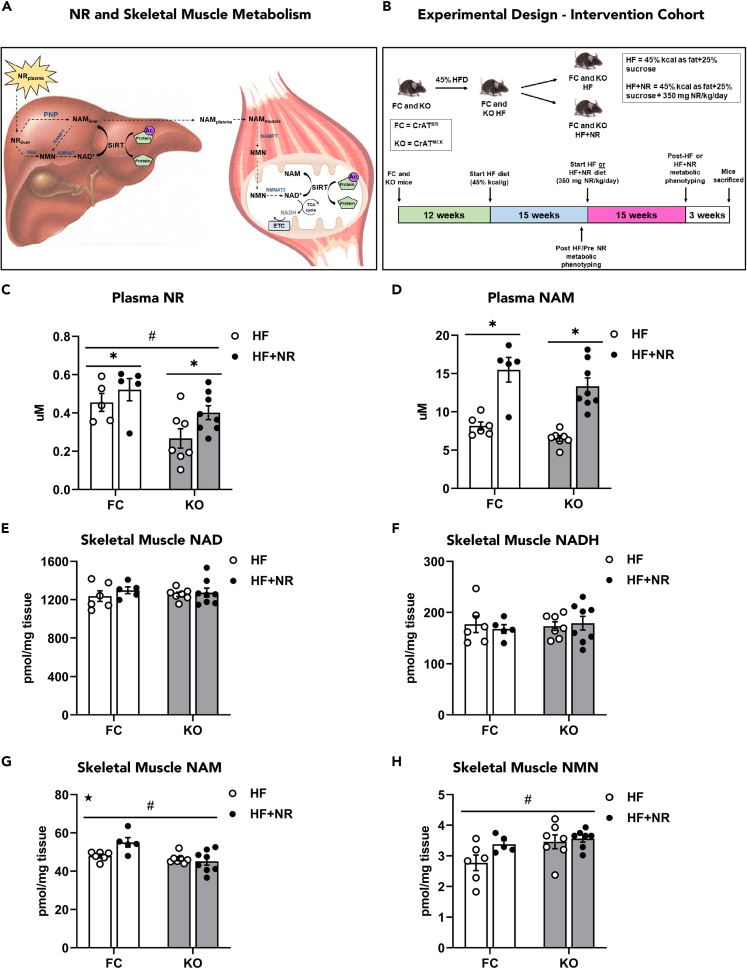
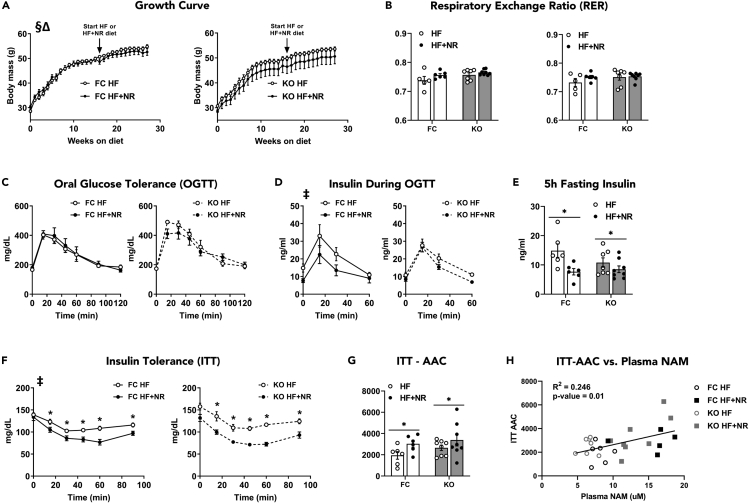
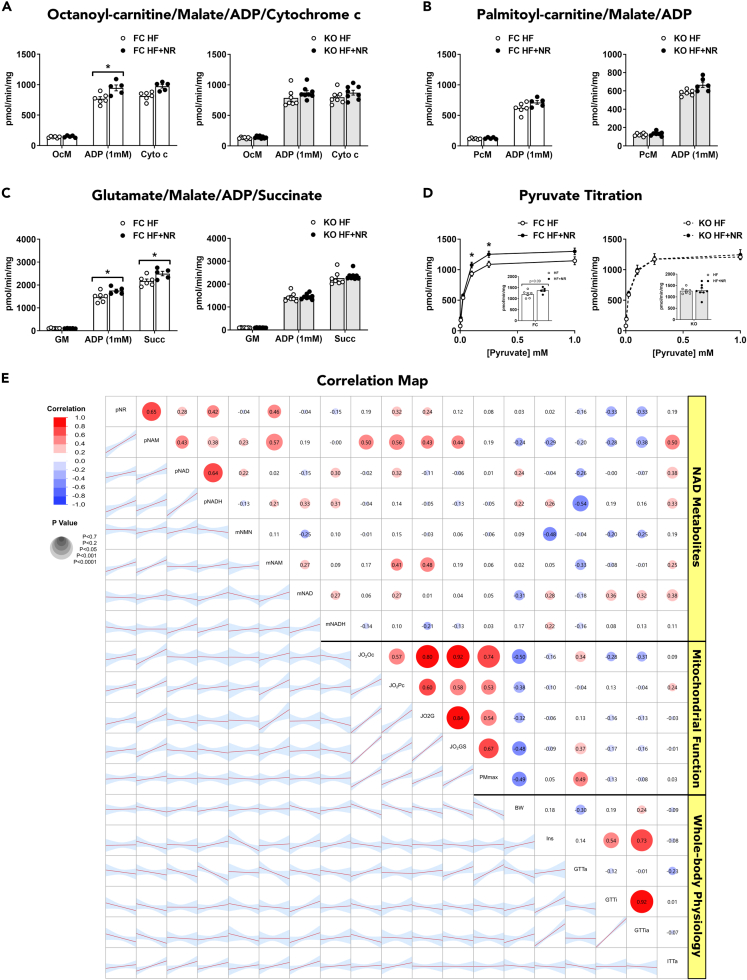
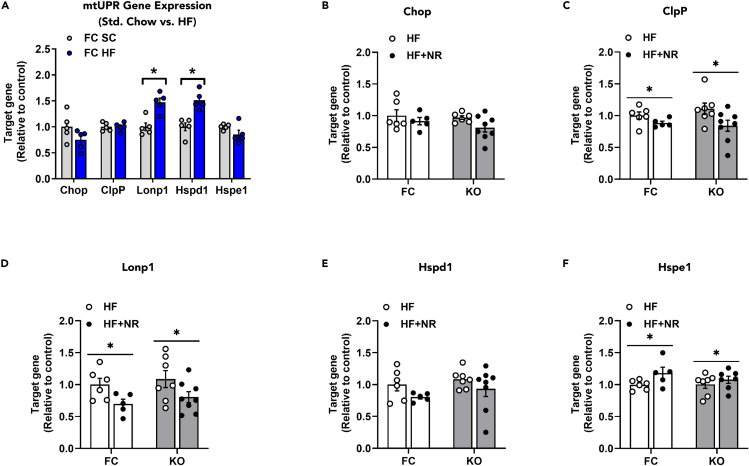
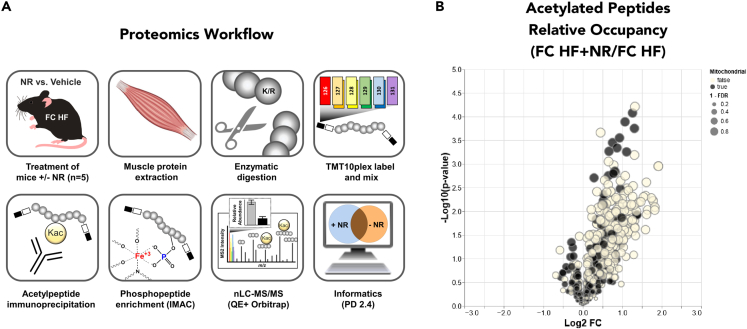
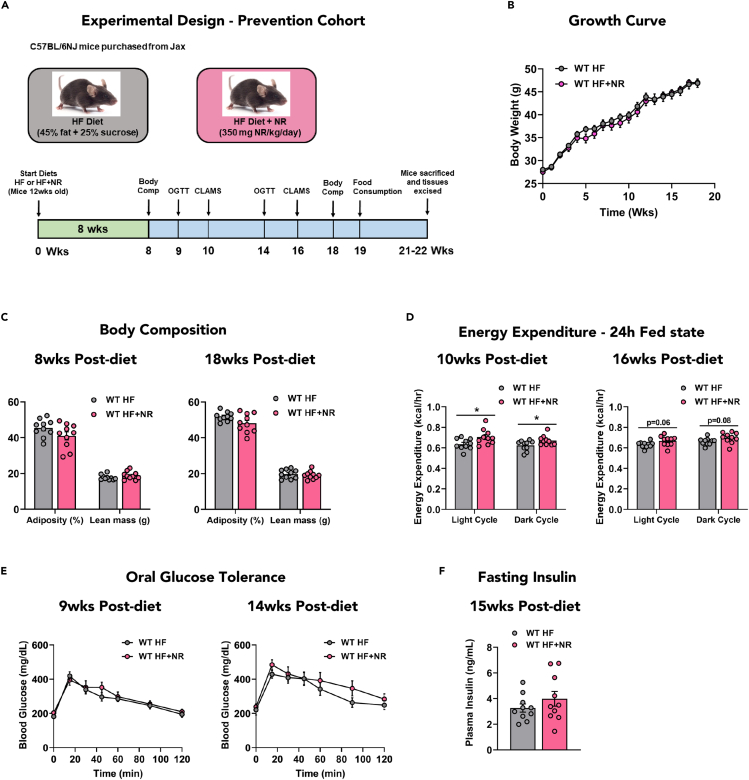
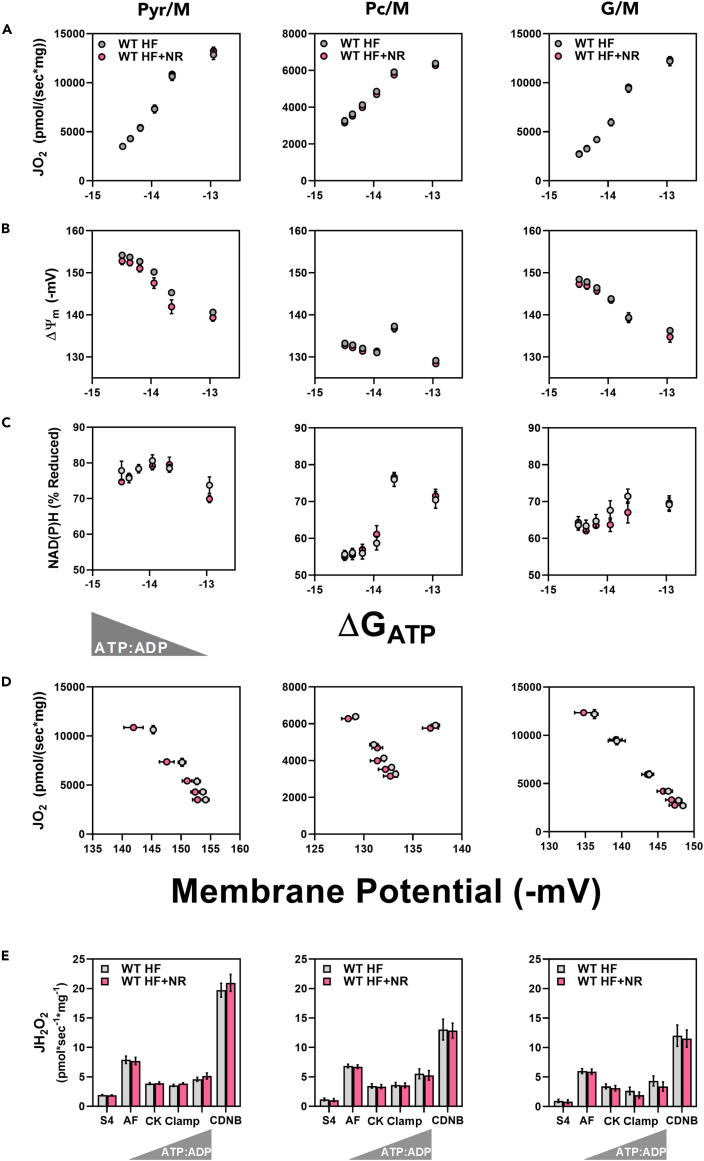
Nicotinamide riboside supplements (NRS) have been touted as a nutraceutical that promotes cardiometabolic and musculoskeletal health by enhancing nicotinamide adenine dinucleotide (NAD+) biosynthesis, mitochondrial function, and/or the activities of NAD-dependent sirtuin deacetylase enzymes. This investigation examined the impact of NRS on whole body energy homeostasis, skeletal muscle mitochondrial function, and corresponding shifts in the acetyl-lysine proteome, in the context of diet-induced obesity using C57BL/6NJ mice. The study also included a genetically modified mouse model that imposes greater demand on sirtuin flux and associated NAD+ consumption, specifically within muscle tissues. In general, whole body glucose control was marginally improved by NRS when administered at the midpoint of a chronic high-fat diet, but not when given as a preventative therapy upon initiation of the diet. Contrary to anticipated outcomes, the study produced little evidence that NRS increases tissue NAD+ levels, augments mitochondrial function, and/or mitigates diet-induced hyperacetylation of the skeletal muscle proteome.
Keywords: Nutrition; Physiology; Proteomics.
© 2021 The Authors.
Conflict of interest statement
The authors received NR Chloride as a gift from ChromaDex Inc.
Figures
Similar articles
-
NAD+ Therapeutics and Skeletal Muscle Adaptation to Exercise in Humans.Sports Med. 2022 Dec;52(Suppl 1):91-99. doi: 10.1007/s40279-022-01772-2. Epub 2022 Nov 4. Sports Med. 2022. PMID: 36331703 Free PMC article. Review.
-
Tissue-specific regulation of sirtuin and nicotinamide adenine dinucleotide biosynthetic pathways identified in C57Bl/6 mice in response to high-fat feeding.J Nutr Biochem. 2016 Nov;37:20-29. doi: 10.1016/j.jnutbio.2016.07.013. Epub 2016 Aug 14. J Nutr Biochem. 2016. PMID: 27592202
-
Nicotinamide riboside does not alter mitochondrial respiration, content or morphology in skeletal muscle from obese and insulin-resistant men.J Physiol. 2020 Feb;598(4):731-754. doi: 10.1113/JP278752. Epub 2019 Dec 26. J Physiol. 2020. PMID: 31710095 Clinical Trial.
-
Nicotinamide Riboside Preserves Cardiac Function in a Mouse Model of Dilated Cardiomyopathy.Circulation. 2018 May 22;137(21):2256-2273. doi: 10.1161/CIRCULATIONAHA.116.026099. Epub 2017 Dec 7. Circulation. 2018. PMID: 29217642 Free PMC article.
-
Nicotinamide riboside, a trace nutrient in foods, is a vitamin B3 with effects on energy metabolism and neuroprotection.Curr Opin Clin Nutr Metab Care. 2013 Nov;16(6):657-61. doi: 10.1097/MCO.0b013e32836510c0. Curr Opin Clin Nutr Metab Care. 2013. PMID: 24071780 Review.
Cited by
-
Nicotinamide Adenine Dinucleotide in Aging Biology: Potential Applications and Many Unknowns.Endocr Rev. 2023 Nov 9;44(6):1047-1073. doi: 10.1210/endrev/bnad019. Endocr Rev. 2023. PMID: 37364580 Free PMC article. Review.
-
Balancing NAD+ deficits with nicotinamide riboside: therapeutic possibilities and limitations.Cell Mol Life Sci. 2022 Aug 2;79(8):463. doi: 10.1007/s00018-022-04499-5. Cell Mol Life Sci. 2022. PMID: 35918544 Free PMC article. Review.
-
Chronic dietary supplementation with nicotinamide riboside reduces sleep need in the laboratory mouse.Sleep Adv. 2023 Dec 20;4(1):zpad044. doi: 10.1093/sleepadvances/zpad044. eCollection 2023. Sleep Adv. 2023. PMID: 38152423 Free PMC article.
-
NAD+ Therapeutics and Skeletal Muscle Adaptation to Exercise in Humans.Sports Med. 2022 Dec;52(Suppl 1):91-99. doi: 10.1007/s40279-022-01772-2. Epub 2022 Nov 4. Sports Med. 2022. PMID: 36331703 Free PMC article. Review.
-
Proteomics and phosphoproteomics datasets of a muscle-specific STIM1 loss-of-function mouse model.Data Brief. 2022 Mar 11;42:108051. doi: 10.1016/j.dib.2022.108051. eCollection 2022 Jun. Data Brief. 2022. PMID: 35345842 Free PMC article.
References
-
- Basse A.L., Agerholm M., Farup J., Dalbram E., Nielsen J., Ortenblad N., Altintas A., Ehrlich A.M., Krag T., Bruzzone S., et al. Nampt controls skeletal muscle development by maintaining Ca(2+) homeostasis and mitochondrial integrity. Mol. Metab. 2021;53:101271. doi: 10.1016/j.molmet.2021.101271. - DOI - PMC - PubMed
-
- Bieganowski P., Brenner C. Discoveries of nicotinamide riboside as a nutrient and conserved NRK genes establish a Preiss-Handler independent route to NAD+ in fungi and humans. Cell. 2004;117:495–502. - PubMed
Grants and funding
LinkOut - more resources
Full Text Sources
Molecular Biology Databases
