

Differential fate between oxytocin and vasopressin cells in the developing mouse brain
- PMID: 35028535
- PMCID: PMC8741612
- DOI: 10.1016/j.isci.2021.103655
Differential fate between oxytocin and vasopressin cells in the developing mouse brain
Abstract
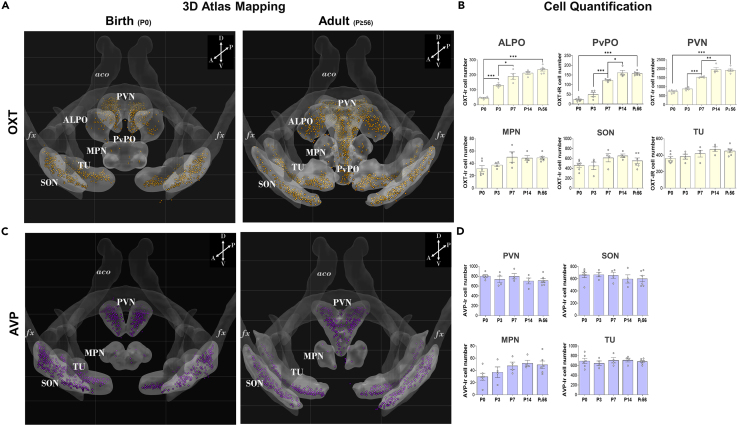
Oxytocin (OXT) and arginine vasopressin (AVP), two neuropeptides involved in socio-emotional behaviors have been anatomically defined in the adult brain. Yet their spatial organization during postnatal development is not clearly defined. We built a developmental atlas using 3D imaging of cleared immunolabeled tissue over four early postnatal (P) stages, from birth (P0, P3, P7, P14) to young adulthood (≥P56). Our atlas-based mapping revealed that the number of OXT neurons doubles according to unique temporal dynamics in selective hypothalamic regions, namely, the periventricular and paraventricular nuclei, and in a novel location we named the antero-lateral preoptic. In the paraventricular nucleus, single-cell densities and fluorescence analysis demonstrated selective expansion of OXT cells in the antero-ventral division, whereas the postero-dorsal division contained cells present at birth. No changes were observed for AVP neurons. Our findings show the coexisting of innate and plastic OXT/AVP brain circuits probably triggered by environmental adaptation of the social brain.
Keywords: Developmental biology; Neuroscience; Optical imaging.
© 2021 The Author(s).
Conflict of interest statement
The authors declare no competing interests.
Figures


Similar articles
-
Central vasopressin and oxytocin release: regulation of complex social behaviours.Prog Brain Res. 2008;170:261-76. doi: 10.1016/S0079-6123(08)00422-6. Prog Brain Res. 2008. PMID: 18655888 Review.
-
Electrophysiology and distribution of oxytocin and vasopressin neurons in the hypothalamic paraventricular nucleus: a study in male and female rats.Brain Struct Funct. 2020 Jan;225(1):285-304. doi: 10.1007/s00429-019-01989-4. Epub 2019 Dec 9. Brain Struct Funct. 2020. PMID: 31820102
-
LPS-induced Fos expression in oxytocin and vasopressin neurons of the rat hypothalamus.Brain Res. 2000 Mar 6;858(1):9-18. doi: 10.1016/s0006-8993(99)02418-x. Brain Res. 2000. PMID: 10700590
-
Differences in acid-induced currents between oxytocin-mRFP1 and vasopressin-eGFP neurons isolated from the supraoptic and paraventricular nuclei of transgenic rats.Neurosci Lett. 2014 Nov 7;583:1-5. doi: 10.1016/j.neulet.2014.09.004. Epub 2014 Sep 8. Neurosci Lett. 2014. PMID: 25220704
-
Early Life Adversity and Adult Social Behavior: Focus on Arginine Vasopressin and Oxytocin as Potential Mediators.Front Behav Neurosci. 2019 Jul 26;13:143. doi: 10.3389/fnbeh.2019.00143. eCollection 2019. Front Behav Neurosci. 2019. PMID: 31404254 Free PMC article. Review.
Cited by
-
Neonatal oxytocin gives the tempo of social and feeding behaviors.Front Mol Neurosci. 2022 Dec 13;15:1071719. doi: 10.3389/fnmol.2022.1071719. eCollection 2022. Front Mol Neurosci. 2022. PMID: 36583080 Free PMC article. Review.
-
Long range projections of oxytocin neurons in the marmoset brain.bioRxiv [Preprint]. 2024 Jan 2:2024.01.02.573953. doi: 10.1101/2024.01.02.573953. bioRxiv. 2024. Update in: J Neuroendocrinol. 2024 Jun;36(6):e13397. doi: 10.1111/jne.13397. PMID: 38260560 Free PMC article. Updated. Preprint.
-
Exploring neuronal markers and early social environment influence in divergent quail lines selected for social motivation.Sci Rep. 2024 Oct 9;14(1):23554. doi: 10.1038/s41598-024-74906-3. Sci Rep. 2024. PMID: 39384852 Free PMC article.
-
Brain serotonin, oxytocin, and their interaction: Relevance for eating disorders.J Psychopharmacol. 2025 Mar;39(3):187-200. doi: 10.1177/02698811241309617. Epub 2025 Jan 2. J Psychopharmacol. 2025. PMID: 39745000 Free PMC article. Review.
-
From Parental Behavior to Sexual Function: Recent Advances in Oxytocin Research.Curr Sex Health Rep. 2024;16(3):119-130. doi: 10.1007/s11930-024-00386-1. Epub 2024 May 11. Curr Sex Health Rep. 2024. PMID: 39224135 Free PMC article. Review.
References
LinkOut - more resources
Full Text Sources
Research Materials
Miscellaneous
