. 2021 Dec 21;2(12):100471.
doi: 10.1016/j.xcrm.2021.100471.

Multiomic analysis identifies CPT1A as a potential therapeutic target in platinum-refractory, high-grade serous ovarian cancer

Affiliations

Multiomic analysis identifies CPT1A as a potential therapeutic target in platinum-refractory, high-grade serous ovarian cancer

Dongqing Huang et al. Cell Rep Med. .

Abstract

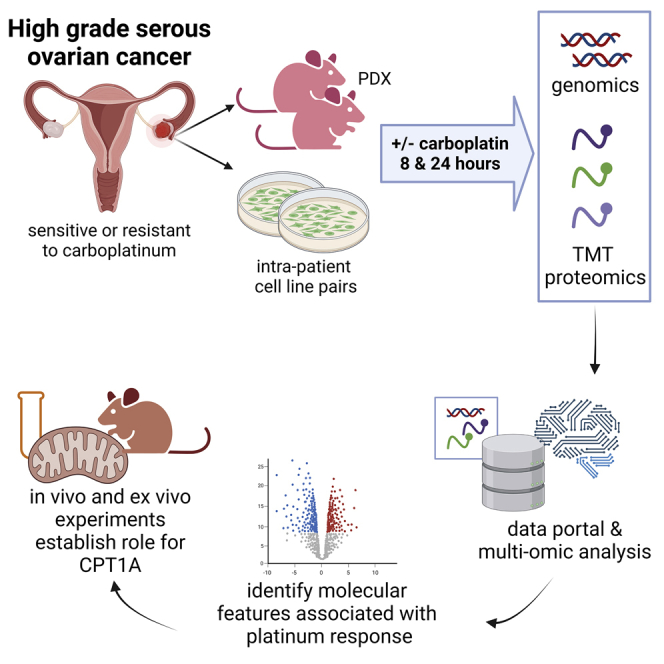
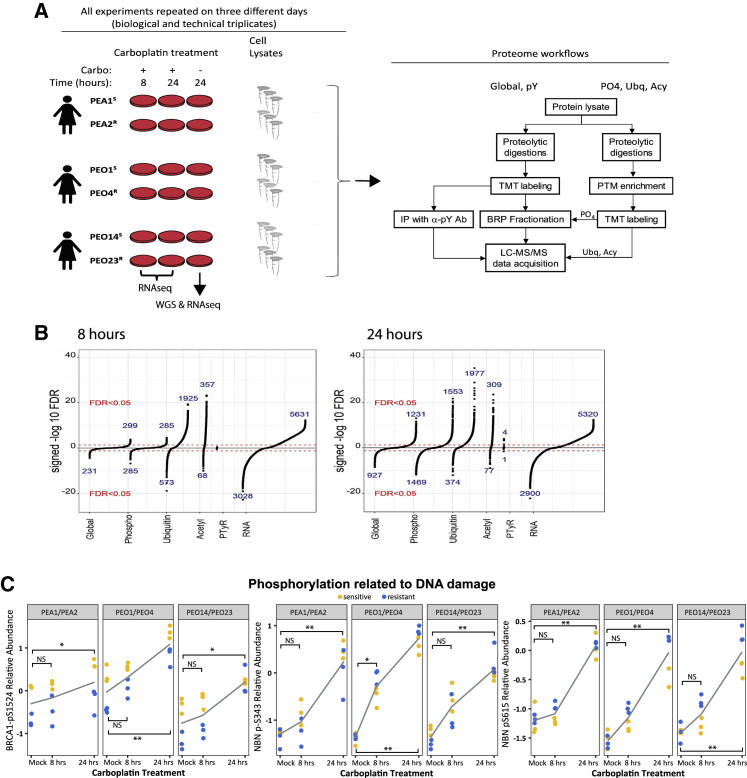
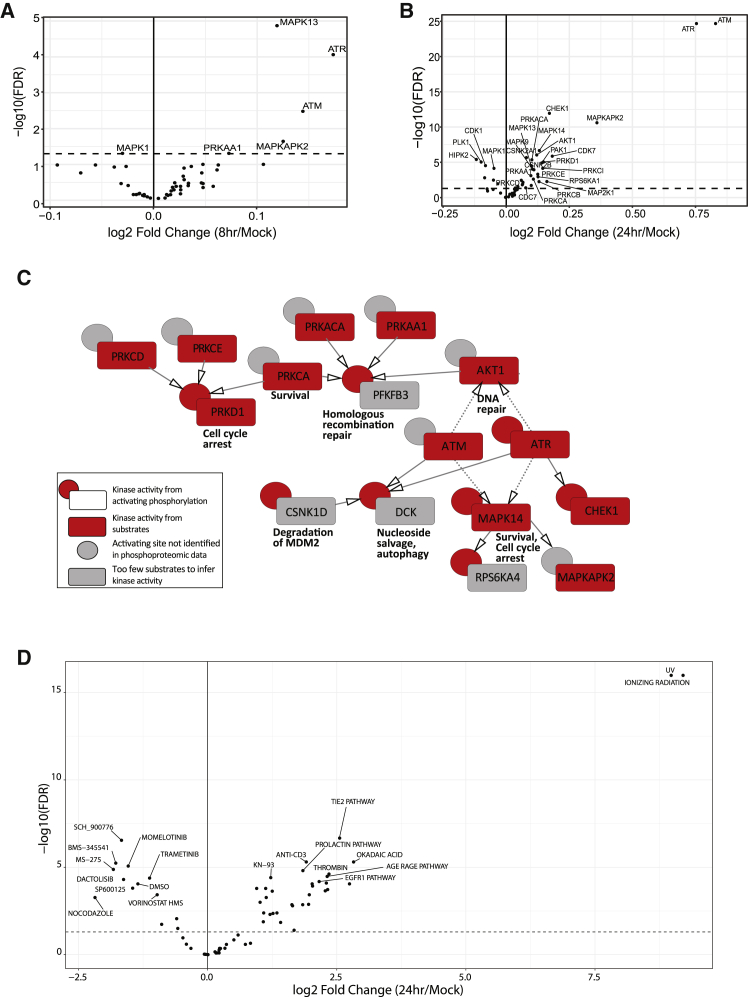
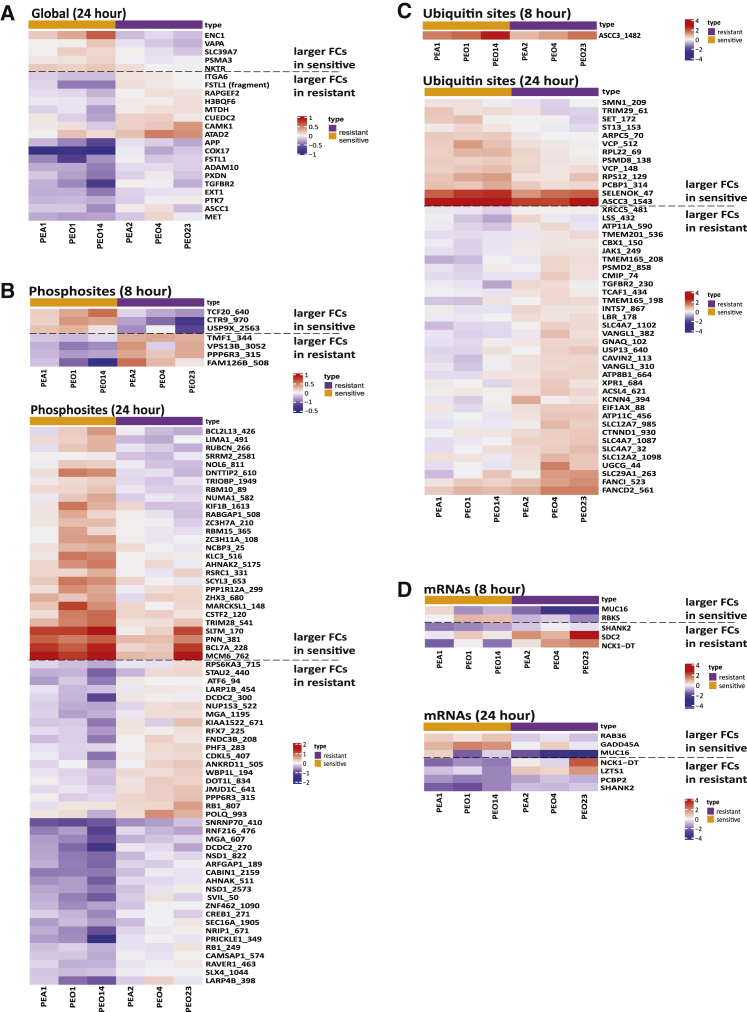
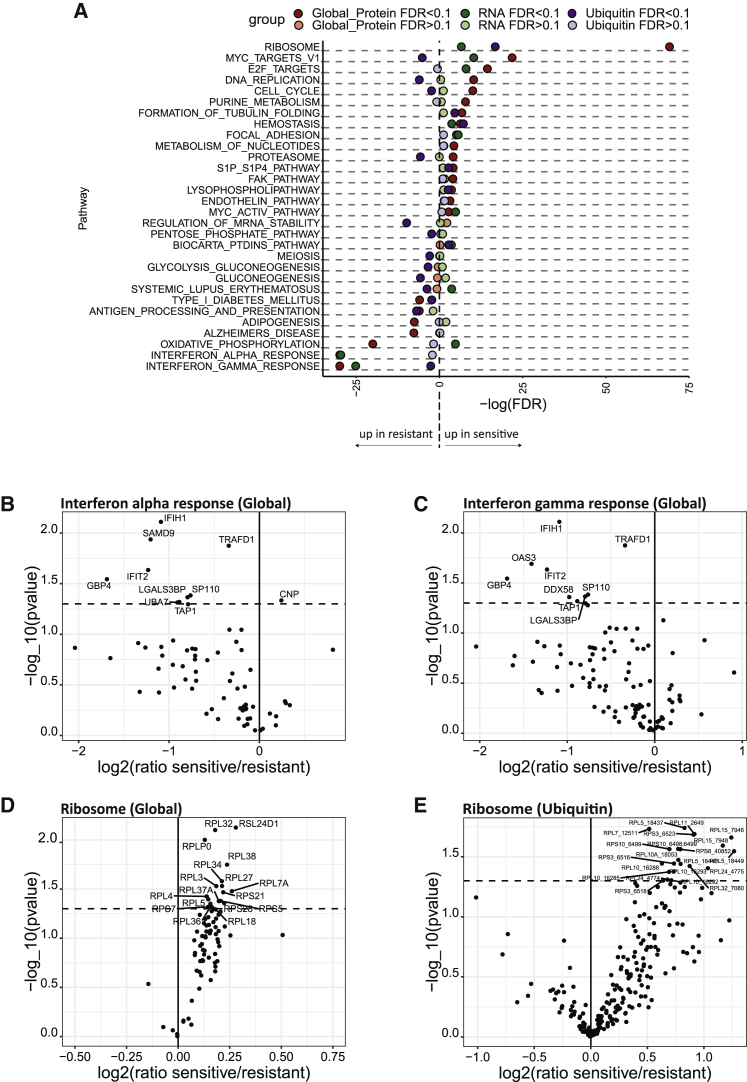
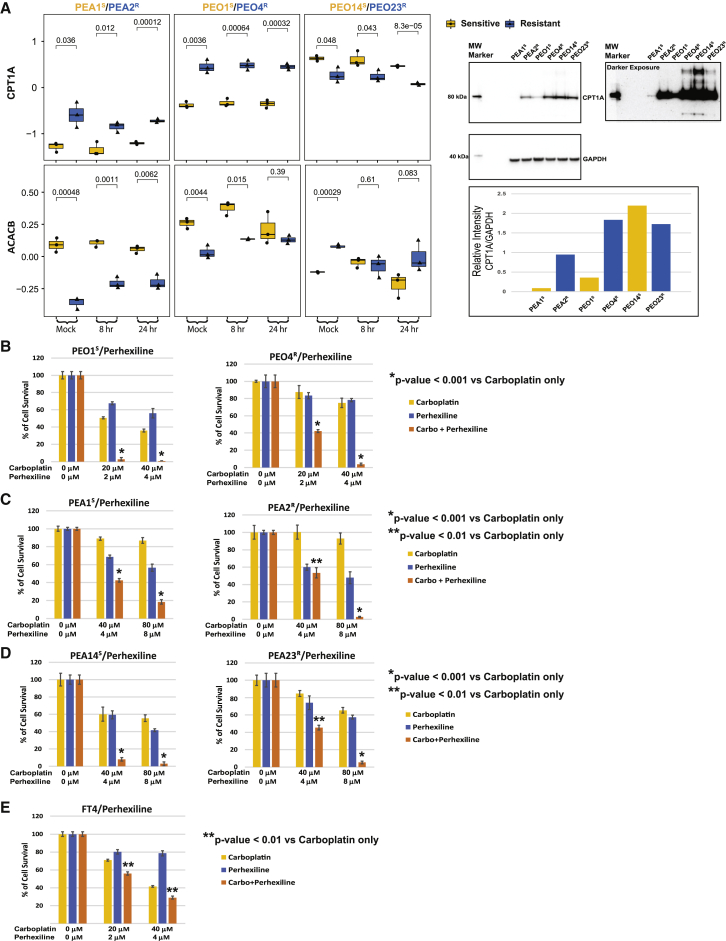
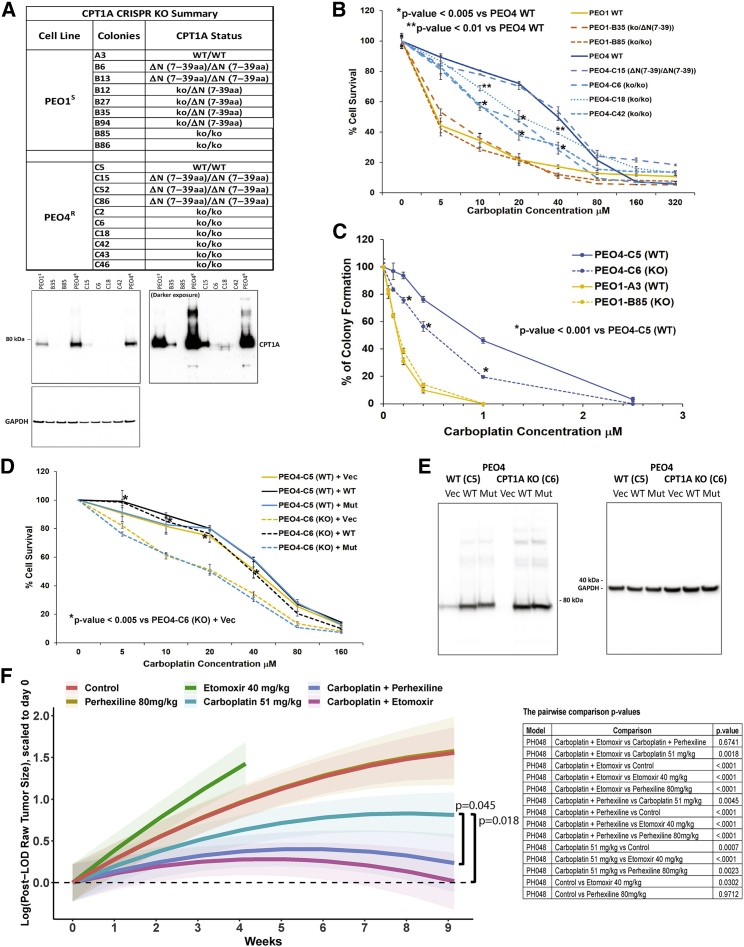
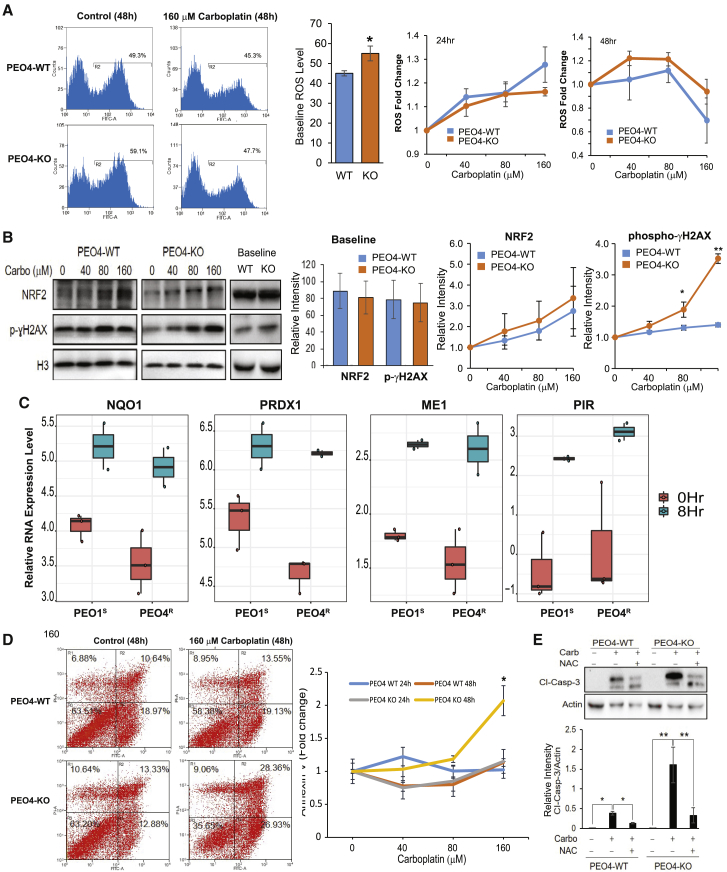
Resistance to platinum compounds is a major determinant of patient survival in high-grade serous ovarian cancer (HGSOC). To understand mechanisms of platinum resistance and identify potential therapeutic targets in resistant HGSOC, we generated a data resource composed of dynamic (±carboplatin) protein, post-translational modification, and RNA sequencing (RNA-seq) profiles from intra-patient cell line pairs derived from 3 HGSOC patients before and after acquiring platinum resistance. These profiles reveal extensive responses to carboplatin that differ between sensitive and resistant cells. Higher fatty acid oxidation (FAO) pathway expression is associated with platinum resistance, and both pharmacologic inhibition and CRISPR knockout of carnitine palmitoyltransferase 1A (CPT1A), which represents a rate limiting step of FAO, sensitize HGSOC cells to platinum. The results are further validated in patient-derived xenograft models, indicating that CPT1A is a candidate therapeutic target to overcome platinum resistance. All multiomic data can be queried via an intuitive gene-query user interface (https://sites.google.com/view/ptrc-cell-line).

Keywords: CPT1A; carboplatin; fatty acid oxidation; ovarian cancer; oxidative phosphorylation; proteogenomic; proteomic; reactive oxygen species; resistance.


Conflict of interest statement

M.J.B. has participated in advisory boards for Clovis, Astra Zeneca, and GSK-Tesaro. A.N.H. has a financial interest in the company Seattle Genetics.

Figures

None
Graphical abstract
Figure 1
Figure 1
Overview of experimental design and results (A) Cells were treated with 80 μM carboplatin and harvested after 8 or 24 h of treatment. A control sample (“mock”) was treated with vehicle and harvested at 24 h. The experiment was repeated on 3 days (complete process triplicates). Nucleic acids were extracted for RNA-seq whole-genome sequencing (WGS). Protein lysates were generated and digested with trypsin, and global or sub-proteomes were isolated. Samples were TMT-labeled, pooled, and analyzed by LC-MS/MS. (B) Regression analysis identifies protein and RNA features responsive to carboplatin exposure (Bonferroni-adjusted p < 0.05). Numbers are shown for significantly increased or decreased mRNAs, proteins, or PTMs in response to carboplatin at 8 h and 24 h. (C) Phosphorylation of Ser1524 of BRCA1 and Ser343 and Ser615 of NBN. Gray line indicates average of 6 samples. ∗adjusted p < 0.05, ∗∗adjusted p < 0.0001, and NS, adjusted p > 0.05.
Figure 2
Figure 2
Phosphoproteomic signatures responsive to carboplatin (A and B) Kinase activity inferred from phosphorylation of its substrates using ssGSEA at (A) 8 h and (B) 24 h of carboplatin exposure. (C) Kinase activity inferred from phosphorylation of its substrates (red box) and phosphorylation of its activating sites (red circle). Gray circles indicate no activating phosphorylation is available. Black arrows indicate a direct phosphorylating kinase on the activating site, and dashed arrows indicate an indirect relationship. (D) Log2 fold change of PTM-SEA phosphosite perturbation and pathway signature scores between 24 h of carboplatin exposure and mock-treated cells. The top 10 in each direction are shown. Dashed line indicates an FDR threshold of 0.05.
Figure 3
Figure 3
Differential responses to carboplatin treatment between sensitive and resistant cell lines (FDR < 0.05) (A) Global proteins, (B) phosphosites, (C) ubiquitin sites, and (D) mRNAs. The values depicted by color represent log2 fold change (8 or 24 h and 0 h).
Figure 4
Figure 4
Pathways showing baseline expression differences between sensitive and resistant cell lines (A) Significant baseline differences observed between sensitive and resistant cell lines at the pathway level. (B) Volcano plot showing higher expression of proteins in the interferon alpha pathway in the resistant cell lines. (C) Volcano plot showing higher expression of proteins in the interferon gamma pathway in the resistant cell lines. (D) Volcano plot showing higher expression of ribosomal proteins (RPs) in the sensitive cell lines. (E) Volcano plot showing higher ubiquitination of RPs in the sensitive cell lines.
Figure 5
Figure 5
CPT1A and ACACB expression levels are associated with carboplatin resistance in 2 of the 3 cell line pairs, and pharmacologic inhibition of CPT1A sensitizes cells to carboplatin (A) CPT1A protein abundance is higher in PEA2R and PEO4R, although acetyl-CoA carboxylase 2 (ACACB) protein abundance is lower in PEA2R and PEO4R. Western blot data (see image and bar graphs) confirm the LC-MS/MS results. (B–D) Perhexiline sensitizes HGSOC cell lines to carboplatin. (E) Perhexiline sensitizes non-tumorigenic FT4 cells to carboplatin. Data in (B)–(E) are an average of 3 biological repeats each with 3 technical repeats. p values (Student’s t test) are provided.
Figure 6
Figure 6
CPT1A is a determinant of platinum resistance both in vitro and in vivo (A) Inventory of CPT1A knockout (KO) clones with western blot confirmation in selected clones. (B) Sensitivity of CPT1A KO clones to carboplatin (cell viability assay, average of 3 biological repeats each with 3 technical repeats). (C) Sensitivity of selected CPT1A KO clones to carboplatin (colony formation assay). One PEO4 KO clone (C6) and one PEO1 KO clone (B85) were tested along with WT controls (C5 and A3, respectively). (D) Retroviral complementation of PEO4 CPT1A-KO clone C6 and WT control clone C5. Vec, vector control; WT, WT CPT1A; Mut, mutant CPT1A (G710E) (3 biological repeats each with 3 technical repeats; Student’s t test performed between WT and KO; p values provided in the graph). (E) Western blot confirmation of the expression of CPT1A WT or G710E mutant in PEO4 cells. (F) Combination efficacy of carboplatin + CPT1A inhibitors in the platinum refractory HGSOC PDX model PHO48. Tumor area was monitored weekly by transabdominal ultrasound. Change in tumor size over time is plotted as the statistical model estimated average of all animals at each time point for a given treatment, scaled relative to baseline estimate for that treatment. Shading indicates 95% confidence intervals. The p values are provided in the table.
Figure 7
Figure 7
Carboplatin-induced ROS is associated with higher induction of DNA damage and apoptotic cell death in CPT1A-KO versus CPT1A WT cells (A) The basal level of ROS (detected with 2,7’–dichlorofluorescin diacetate [DCFDA] dye) was compared between PEO4 CPT1A-KO cells and the parental PEO4 cell line (n = 3; ∗p < 0.05). Relative changes in ROS production for both PEO4 WT and PEO4 CPT1A-KO cells upon carboplatin exposure were plotted for both 24 h and 48 h. (B) Representative western blot showing the baseline and effects of carboplatin exposure on NRF2 and γH2AX expression (48 h). Quantification of NRF2 and γH2AX proteins was done using NIH ImageJ software and plotted as line graphs. Data are expressed as mean ± SEM (n = 3; ∗p < 0.05; ∗∗p < 0.001). (C) RNA expression levels of NQO1, PRDX1, ME1, and PIR at 0 h and 8 h after carboplatin treatment were compared for PEO1S and PEO4R cells. (D) Detection of carboplatin-induced apoptosis via Annexin V staining in PEO4-WT and PEO4-KO cells. Cells were treated with different concentrations of carboplatin for 48 h and incubated with AV-fluorescein isothiocyanate (FITC) and phosphatidylinositol (PI). Stained cells were analyzed by flow cytometry. Percentage of intact cells (AV−/PI−) and different stage apoptotic cells (AV+/PI−, AV+/PI+, and AV−/PI+) are presented. Data represent mean ± SEM (n = 3; ∗p < 0.001). (E) Western blot showing the effects of carboplatin treatment (160 μM; 48 h) in PEO4-WT versus PEO4-KO on caspase-3 cleavage as an indicator of cell death via apoptosis. Data are expressed as mean ± SEM (n = 3; ∗p < 0.05; ∗∗p < 0.001).

References

    1. Vizcaíno J.A., Côté R.G., Csordas A., Dianes J.A., Fabregat A., Foster J.M., Griss J., Alpi E., Birim M., Contell J., et al. The PRoteomics IDEntifications (PRIDE) database and associated tools: status in 2013. Nucleic Acids Res. 2013;41:D1063–D1069. - PMC - PubMed
    1. Edgar R., Domrachev M., Lash A.E. Gene Expression Omnibus: NCBI gene expression and hybridization array data repository. Nucleic Acids Res. 2002;30:207–210. - PMC - PubMed
    1. Shumway M., Cochrane G., Sugawara H. Archiving next generation sequencing data. Nucleic Acids Res. 2010;38:D870–D871. - PMC - PubMed
    1. DeVita V.T., Rosenberg S.A., Lawrence T.S. Eleventh Edition. Wolters Kluwer; 2018. DeVita, Hellman, and Rosenberg’s Cancer: Principles & Practice of Oncology (Cancer Principles and Practice of Oncology)
    1. Pascoe J.M., Roberts J.J. Interactions between mammalian cell DNA and inorganic platinum compounds. I. DNA interstrand cross-linking and cytotoxic properties of platinum(II) compounds. Biochem. Pharmacol. 1974;23:1359–1365. - PubMed

Publication types

MeSH terms