

Metabolic remodeling maintains a reducing environment for rapid activation of the yeast DNA replication checkpoint
- PMID: 35028974
- PMCID: PMC8844976
- DOI: 10.15252/embj.2021108290
Metabolic remodeling maintains a reducing environment for rapid activation of the yeast DNA replication checkpoint
Abstract
Nucleotide metabolism fuels normal DNA replication and is also primarily targeted by the DNA replication checkpoint when replication stalls. To reveal a comprehensive interconnection between genome maintenance and metabolism, we analyzed the metabolomic changes upon replication stress in the budding yeast S. cerevisiae. We found that upon treatment of cells with hydroxyurea, glucose is rapidly diverted to the oxidative pentose phosphate pathway (PPP). This effect is mediated by the AMP-dependent kinase, SNF1, which phosphorylates the transcription factor Mig1, thereby relieving repression of the gene encoding the rate-limiting enzyme of the PPP. Surprisingly, NADPH produced by the PPP is required for efficient recruitment of replication protein A (RPA) to single-stranded DNA, providing the signal for the activation of the Mec1/ATR-Rad53/CHK1 checkpoint signaling kinase cascade. Thus, SNF1, best known as a central energy controller, determines a fast mode of replication checkpoint activation through a redox mechanism. These findings establish that SNF1 provides a hub with direct links to cellular metabolism, redox, and surveillance of DNA replication in eukaryotes.
Keywords: DNA replication stress; carbon metabolism; cell cycle checkpoints; genome stability; reductive/oxidative (redox).
© 2022 The Authors.
Figures
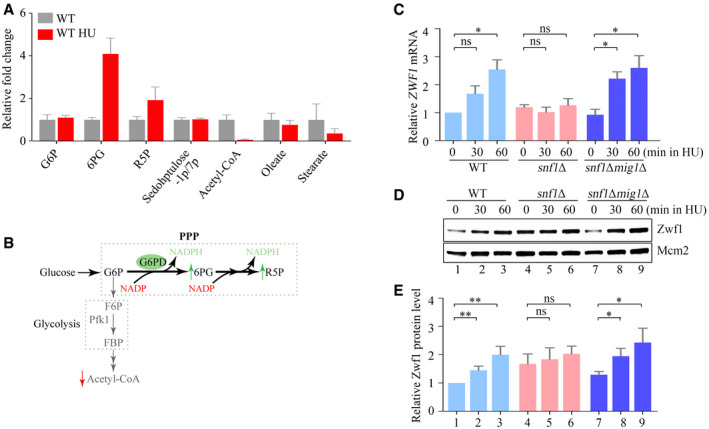
- A
The relative fold change of carbon metabolites with or without HU treatment for 60 min. Error bars represent standard deviations (SD) from six independent experiments.
- B
The diagram of carbon metabolism rewiring focused on glycolysis and PPP (
p entosep hosphatep athway). - C
The relative ZWF1 mRNA levels were measured by qPCR. Cells were grown into an exponential phase and treated by 200 mM HU for 0, 30, and 60 min. mRNA were prepared just as described in Methods and Materials. The relative mRNA levels of ZWF1 to ACTIN1 were determined by qPCR analyses. The value of the untreated WT sample was normalized to 1. Error bars represent standard deviations (SD) from at least three biological repeats. Statistical significance was evaluated based on Student’s t‐test (*0.01 < P‐values < 0.05).
- D, E
The relative levels of endogenous Zwf1 protein with a GFP tag were analyzed by immunoblots in WT, snf1Δ, or snf1Δmig1Δ cells (D). Protein extracts were probed with an anti‐GFP antibody. Mcm2 was applied as a loading control. Three independent experiments were carried out and the relative fold changes were measured by Image J (E). Error bars represent standard deviations (SD) from three biological repeats. Statistical significance was evaluated based on Student’s t‐test (*0.01 < P‐values < 0.05; **0.001 < P‐values <0.01).
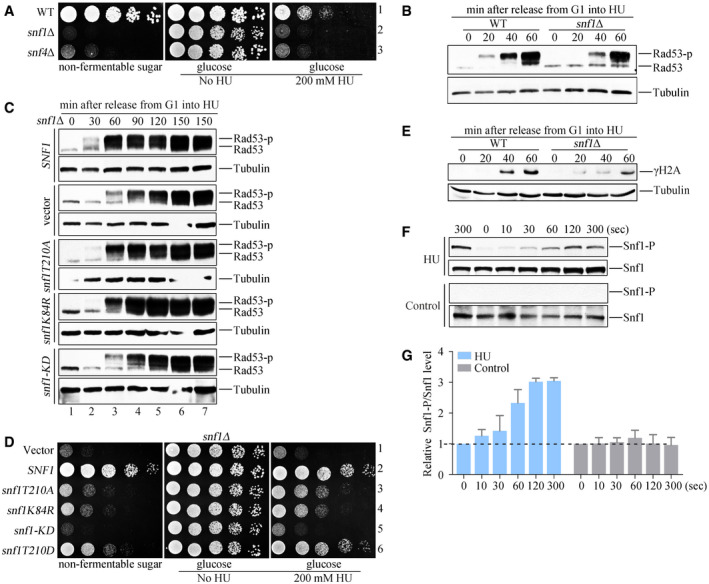
- A
The snf1Δ and snf4Δ mutant cells are hypersensitive to HU. Fivefold serial dilutions of the overnight cultures were assayed on normal growth media (YPD) with or without 200 mM HU. A plate in which 2% glucose was replaced by 2% non‐fermentable carbon (galactose) was applied as a control. All plates were cultured at 30°C for 48 h before photography.
- B
Rad53 hyperphosphorylation of WT and snf1Δ in response to HU. Cells were synchronized in G1 and released into the fresh medium containing 200 mM HU for the indicated time. Cell extracts were prepared for immunoblotting against anti‐Rad53 antibodies. Tubulin was probed as a loading control.
- C
Rad53 phosphorylation in various snf1 alleles in response to HU. The plasmids expressing the indicated snf1 alleles were transformed into snf1Δ. Rad53 phosphorylation was detected as above.
- D
The snf1 kinase‐defective mutants are sensitive to HU. Yeast spot assays were performed as in Fig 2A. The phospho‐mimetic snf1T210D (a constitutive active mutant) was applied as a control for non‐phosphorylatable snf1T210A.
- E
H2A S129 phosphorylation (namely γ‐H2A) of WT and snf1Δ in response to HU. γ‐H2A was detected by immunoblotting.
- F, G
HU induces a rapid Snf1 T210 phosphorylation. Exponential cells were treated by 200 mM HU for the indicated time. Protein extracts were prepared as described in the Methods and Materials. Three independent experiments were done. Quantitation of Snf1 T210 and Snf1 signals was performed by Image J. The relative ratio of Snf1 T210/Snf1 was shown in (G). Error bars represent standard deviations (SD) from three biological repeats.
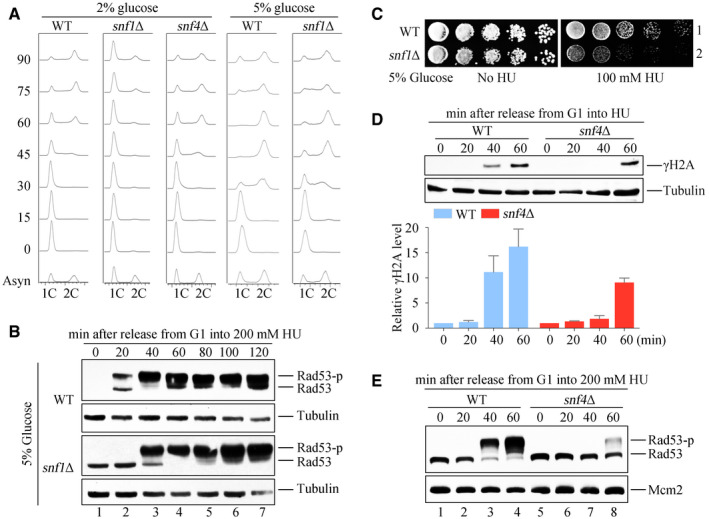
DNA content was monitored by flow cytometry. Cells were grown in media containing 2 or 5% glucose and exponential cells were arrested into G1 phase by alpha‐factor before release into corresponding fresh media for the indicated time.
Rad53 hyperphosphorylation of WT and snf1Δ in response to HU. Cells were synchronized in G1 and released into the fresh medium (5% glucose) containing 200 mM HU for the indicated time. Cell extracts were prepared for immunoblotting against anti‐Rad53 antibodies. Tubulin was probed as a loading control.
5% glucose cannot rescue the HU sensitivity of snf1Δ. WT and snf1Δ strains were grown and spotted on HU plates with 5% glucose. All plates were cultured at 30°C for 48 h before photography.
H2A S129 phosphorylation (namely γ‐H2A) of WT and snf4Δ in response to HU. γ‐H2A was detected by immunoblotting (upper panel). Three independent experiments were performed and quantified by Image J (lower panel). Error bars represent standard deviations (SD) from three biological repeats.
Rad53 phosphorylation of WT and snf4Δ in response to HU. Rad53 phosphorylation was detected as above. Mcm2 was probed as a loading control.
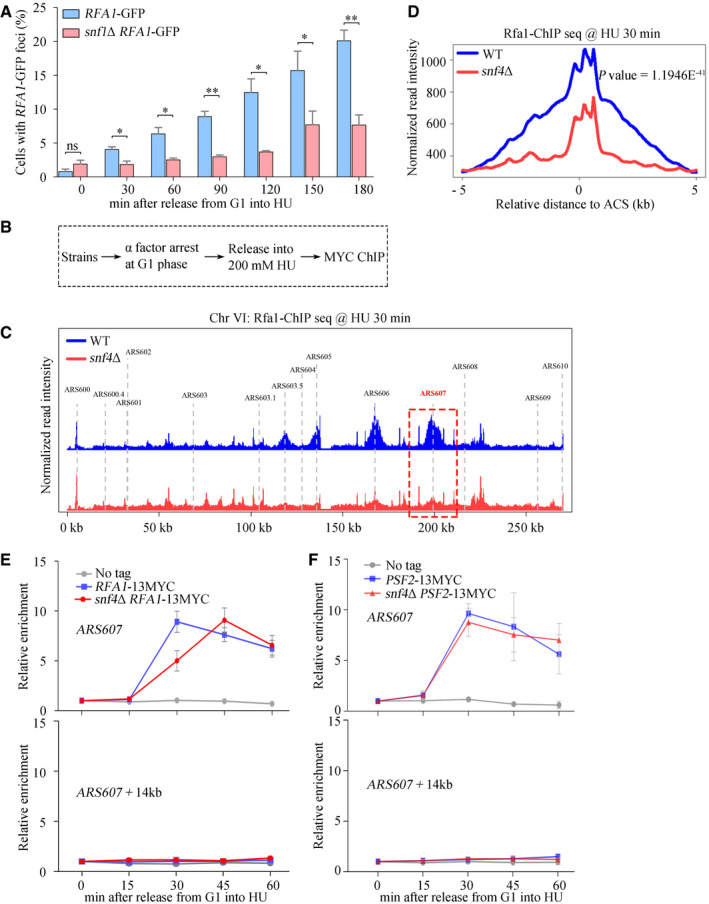
- A
A significant delay in RPA foci formation in the absence of Snf1. The percentage of cells with RPA foci was calculated and plotted against the incubation time in 200 mM HU. Error bars represent SD from three biological repeats. At least 200 cells were analyzed for each experiment of three independent experiments. Statistical significance was evaluated based on Student’s t‐test (*0.01 < P‐values < 0.05; **0.001 < P‐values < 0.01).
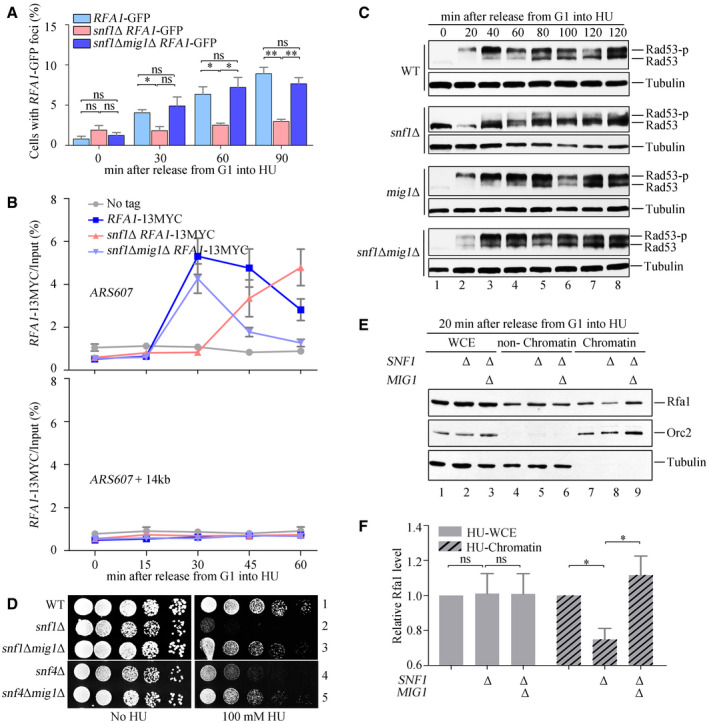
- B
The experimental scheme for the Rfa1–13MYC ChIP in the indicated yeast strains.
- C
Snap shot of Rfa1 ChIP‐Seq at Chromosome VI. Cells were synchronized in G1 and released into the fresh medium containing 200 mM HU for 30 min. The sequencing reads were mapped to the yeast reference genome. The red dashed box indicated the relative read intensity of ARS607.
- D
The average Rfa1 ChIP‐seq read density from cells released into HU medium around ACS sites. ACS, ARS consensus sequence.
- E, F
SNF1 is required for efficient recruitment of Rfa1, but not Psf2, to HU‐stalled replication forks. Cells were grown and synchronized in G1 by α‐factor before release into the fresh medium supplemented with 200 mM HU for the indicated time. Cell extracts were prepared and subjected to MYC–ChIP of Rfa1–13MYC (E) or Psf2–13MYC (F). The amounts of DNA in the precipitates were quantified by qPCR. Error bars represent SD from three biological repeats.
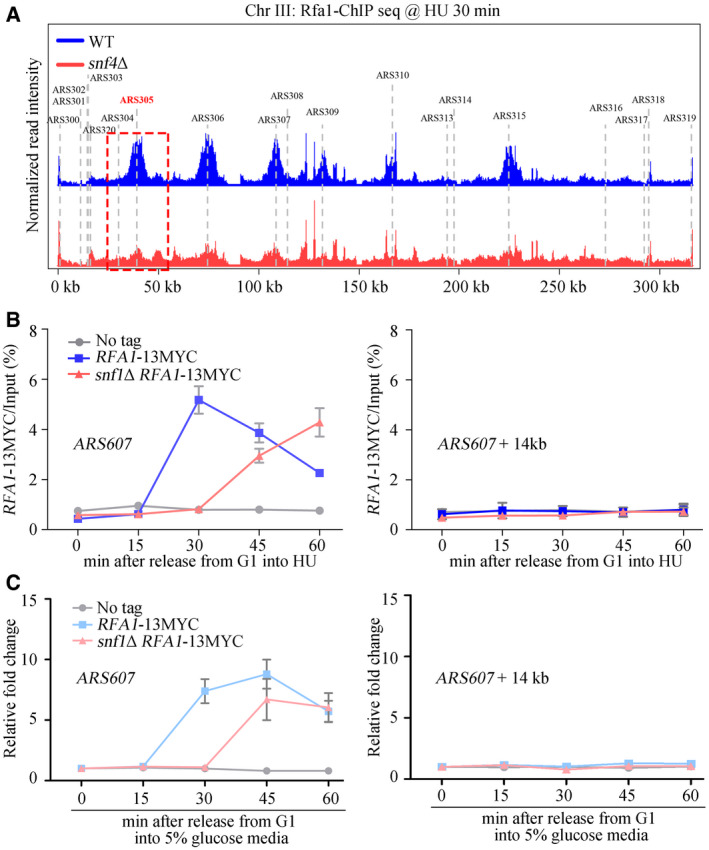
- A
Snap shot of Rfa1 ChIP‐Seq at Chromosome III. Cells were synchronized in G1 and released into the fresh medium containing 200 mM HU for 30 min. The sequencing reads were mapped to the yeast reference genome. The red dashed box indicated the relative read intensity of ARS305.
- B, C
SNF1 is required for efficient recruitment of Rfa1 to HU‐stalled replication forks, which is independent on cell cycle. Cells were grown and synchronized in G1 by α‐factor before release into the fresh medium containing 2% (B) or 5% (C) glucose supplemented with 200 mM HU for the indicated time. Cell extracts were prepared and subjected to MYC–ChIP of Rfa1–13MYC. The amounts of DNA in the precipitates were quantified by qPCR. Error bars represent SD from three biological repeats.
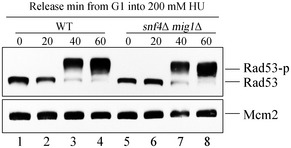
- A, B
Rfa1–GFP foci and Rfa1–13MYC ChIP assays were performed as in Fig 3. At least 200 cells were analyzed for each experiment of three independent experiments. Statistical significance was evaluated based on Student’s t‐test (*0.01 < P‐values < 0.05; **0.001 < P‐values < 0.01) (A). Error bars represent SD from three biological repeats (B).
- C, D
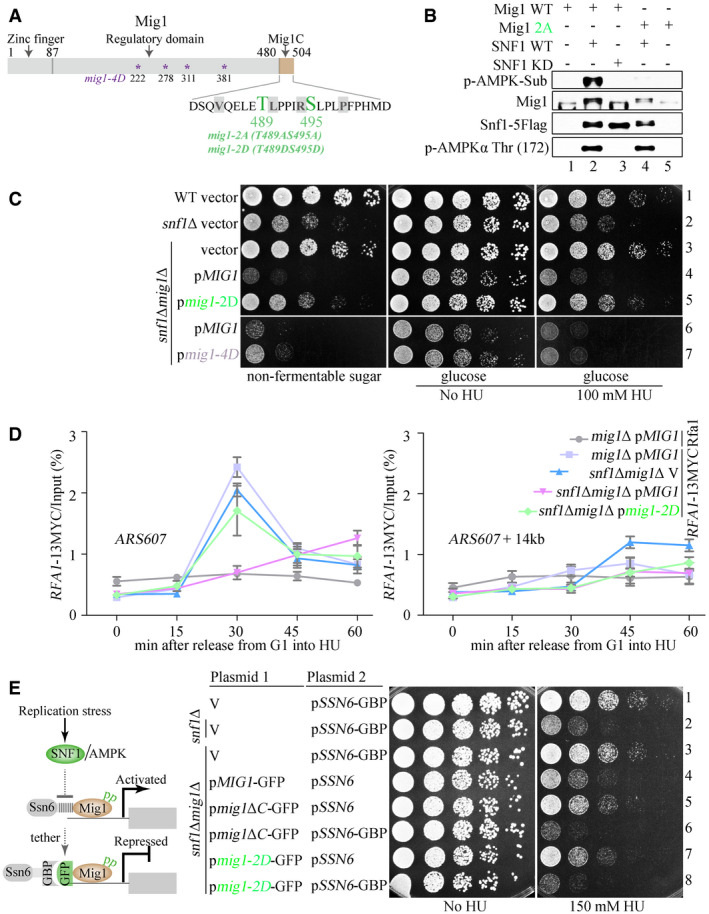
mig1Δ restores Rad53 phosphorylation and growth of the snf1 mutants in the presence of HU. The experiments were done as in Fig 2.
- E, F
snf1Δ shows less RPA on chromatin, which can be restored by mig1Δ. Cells were collected and fractionated into chromatin‐bound (Chromatin) and non‐chromatin‐bound fractions (non‐Chromatin) followed by immunoblotting. Tubulin and Orc2 were applied as controls for non‐chromatin and chromatin fractions, respectively. The signals were quantified by Image J and quantifications were shown in (F). Error bars represent SD from three biological repeats. Statistical significance was evaluated based on Student’s t‐test (*0.01 < P‐values < 0.05).
- A
T489 and S495, within Mig1C, are predicted to be the phosphorylation sites of SNF1 by global phosphorylation sites.
- B
Mig1 T489 and S495 are the main phosphorylation sites of SNF1 in response to HU. The SNF1 kinase complex was partially purified from HU‐treated Snf1‐5FLAG or snf1‐KD‐5FLAG yeast cells. Recombinant Mig1 or its mutant proteins (mig1‐2A, T489AS495A) were purified from E. coli. In vitro kinase assays were performed as described in Materials and Methods. Proteins were immunoblotted using the indicated antibodies. The anti‐AMPK substrate antibodies were used to probe the phosphorylation of the substrate Mig1. Less signals were observed when Mig1 was replaced by mig1‐2A. Phosphorylation of Snf1 Thr 172 indicates the activation status of the Snf1 kinase.
- C, D
Phospho‐mimetic mig1‐2D bypasses the role of SNF1 in HU resistance (C) and RPA recruitment (D). HU sensitivity and Rfa1–13MYC ChIP assays were conducted as described in Figs 2A and 3D. Error bars represent SD from three biological repeats.
- E
The diagram of the strategy to reinforce the Mig1–Ssn6 interaction via a GFP and GBP pair (left panel). The persistent Mig1–Ssn6 association abolishes the phospho‐mimicking effect of mig1‐2D (right panel). Yeast spot assays were performed as in Fig 2A.
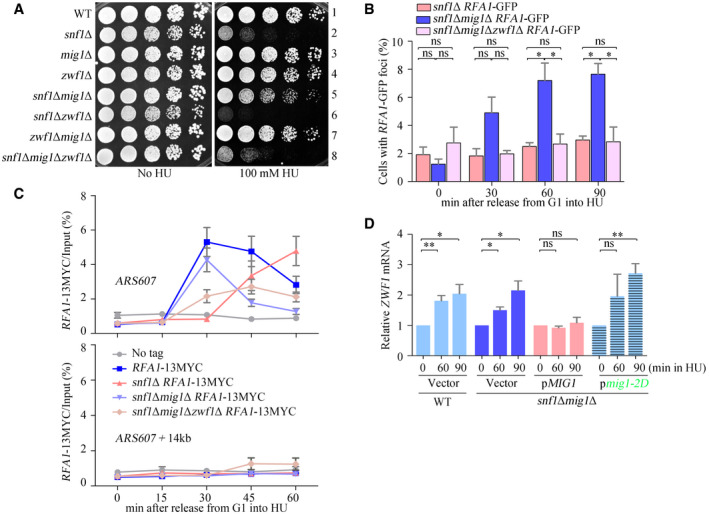
ZWF1 is required for snf1Δmig1Δ growing in HU. Overnight cultures were spotted onto plates containing HU, and cultivated at 30°C for 48 h before photography. Yeast spot assays were performed as in Fig 2A.
Rfa1–GFP foci were measured as in Fig 3. At least 200 cells were analyzed for each experiment of three independent experiments. Error bars represent SD from three biological repeats. Statistical significance was evaluated based on Student’s t‐test (*0.01 < P‐values < 0.05).
Rfa1–13MYC ChIP assays after HU treatment. Strains were synchronized in G1 phase by α‐factor prior to release into fresh media containing 200 mM HU for the indicated time points. Cell extracts were prepared as in Fig 3. Error bars represent SD from three biological repeats.
Phosphorylation of Mig1 T489 S495 completely restores the ZWF1 mRNA levels in snf1Δ. The experiments were done as in Fig 1. Error bars represent SD from three biological repeats. Statistical significance was evaluated based on Student’s t‐test (*0.01 < P‐values < 0.05; **0.001 < P‐values < 0.01).
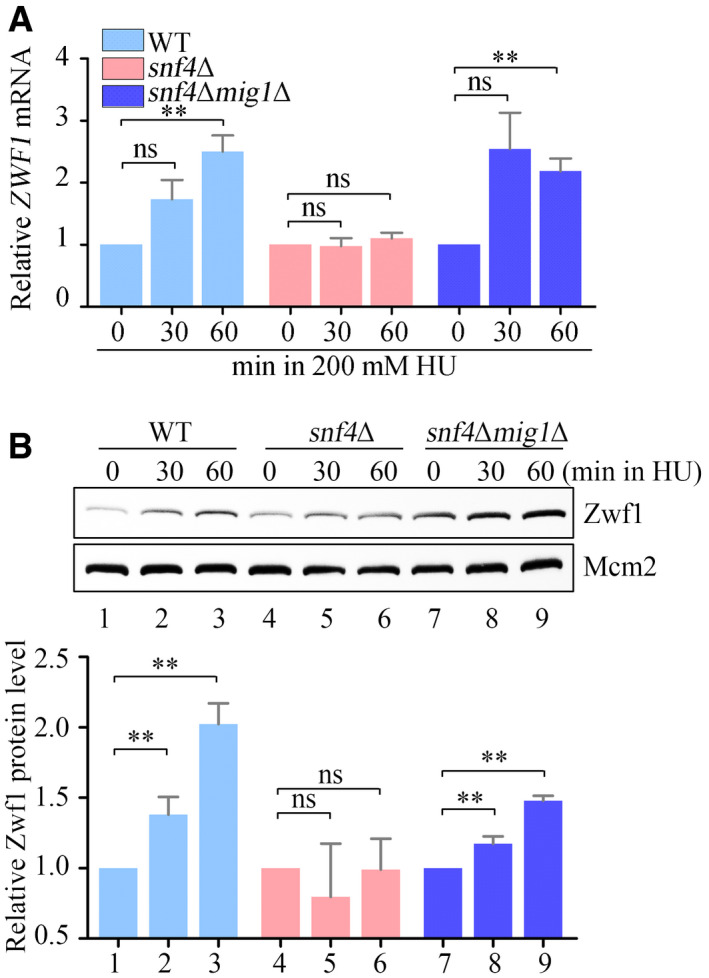
The relative ZWF1 mRNA levels were measured by qPCR. Cells were grown into an exponential phase and treated by 200 mM HU for 0, 30, and 60 min. mRNA were prepared just as described in Materials and Methods. The relative mRNA levels of ZWF1 to ACTIN1 were determined by qPCR analyses. The value of the untreated WT sample was normalized to 1. Error bars represent standard deviations (SD) from at least three biological repeats. Statistical significance was evaluated based on Student’s t‐test (**0.001 < P‐values < 0.01).
The relative levels of endogenous Zwf1 protein with a GFP tag were analyzed by immunoblots in WT, snf4Δ, or snf4Δmig1Δ cells (upper panel). Protein extracts were probed with an anti‐GFP antibody. Mcm2 was applied as a loading control. Three independent experiments were carried out and the relative fold changes were measured by Image J (lower panel). Statistical significance was evaluated based on Student’s t‐test (**0.001 < P‐values < 0.01).
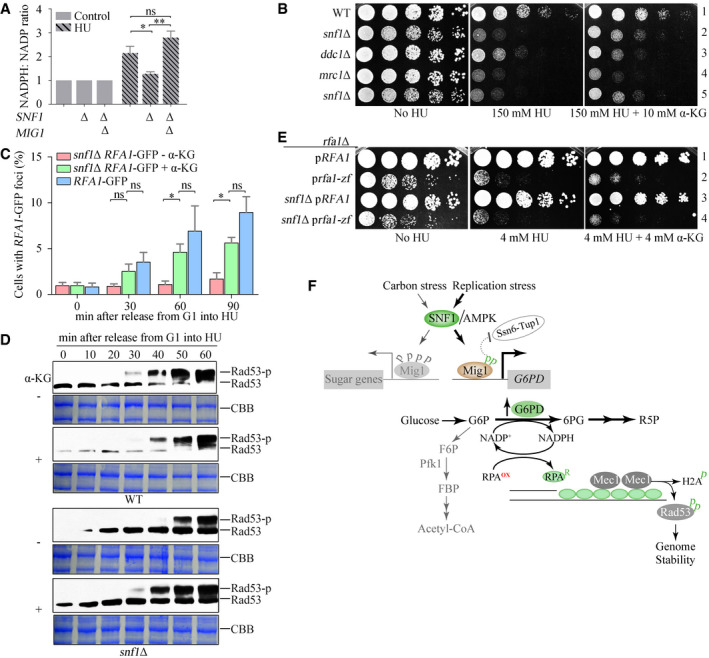
The SNF1–Mig1 axis induces NADPH upon HU treatment. The relative ratios of cellular NADPH/NADP before or after HU treatment were measured as described in Materials and Methods. Error bars represent SD from three biological repeats. Statistical significance was evaluated based on Student’s t‐test (*0.01 < P‐values < 0.05; **0.001 < P‐values < 0.01).
The effects of α‐KG on the HU sensitivity of snf1Δ and other checkpoint mutants. Yeast spot assays were performed as in Fig 2A.
α‐KG restores the levels of Rfa1–GFP foci in snf1Δ. Rfa1–GFP foci were measured as in Fig 3. At least 200 cells were analyzed for each experiment. Error bars represent SD from three biological repeats. Statistical significance was evaluated based on Student’s t‐test (*0.01 < P‐values < 0.05).
α‐KG restores Rad53 phosphorylation in snf1Δ. CBB indicates Coomassie bright blue (CBB) staining of the membrane as the loading control.
The effects of α‐KG on the HU sensitivity of Rfa1 zinc finger mutants (C486S, C491S, C505S, C508S). Yeast spot assays were performed as in Fig 2A.
The proposed working model. In brief, we uncover that sugar metabolism is rewired to protect genome stability by means of a redox mechanism. Mechanistically, an SNF1–Mig1–ZWF1–NADPH axis stimulates the ssDNA binding of RPA, thereby promoting a fast activation mode of Mec1–Rad53 kinase cascade to fight against replication threats.
References
-
- Alcasabas AA, Osborn AJ, Bachant J, Hu F, Werler PJ, Bousset K, Furuya K, Diffley JF, Carr AM, Elledge SJ (2001) Mrc1 transduces signals of DNA replication stress to activate Rad53. Nat Cell Biol 3: 958–965 - PubMed
-
- Awasthi P, Foiani M, Kumar A (2015) ATM and ATR signaling at a glance. J Cell Sci 128: 4255–4262 - PubMed
-
- Berti M, Cortez D, Lopes M (2020) The plasticity of DNA replication forks in response to clinically relevant genotoxic stress. Nat Rev Mol Cell Biol 21: 633–651 - PubMed
-
- Blackford AN, Jackson SP (2017) ATM, ATR, and DNA‐PK: the trinity at the heart of the DNA damage response. Mol Cell 66: 801–817 - PubMed
Publication types
MeSH terms
Substances
LinkOut - more resources
Full Text Sources
Molecular Biology Databases
Miscellaneous
