. 2022 Jan;11(1):e12185.
doi: 10.1002/jev2.12185.

Extracellular vesicle-mediated delivery of circDYM alleviates CUS-induced depressive-like behaviours

Affiliations

Extracellular vesicle-mediated delivery of circDYM alleviates CUS-induced depressive-like behaviours

Xiaoyu Yu et al. J Extracell Vesicles. 2022 Jan.

Abstract

Major depressive disorder (MDD) is the most prevalent psychiatric disorder worldwide and severely limits psychosocial function and quality of life, but no effective medication is currently available. Circular RNAs (circRNAs) have been revealed to participate in the MDD pathological process. Targeted delivery of circRNAs without blood-brain barrier (BBB) restriction for remission of MDD represents a promising approach for antidepressant therapy. In this study, RVG-circDYM-extracellular vesicles (RVG-circDYM-EVs) were engineered to target and preferentially transfer circDYM to the brain, and the effect on the pathological process in a chronic unpredictable stress (CUS) mouse model of depression was investigated. The results showed that RVG-circDYM-EVs were successfully purified by ultracentrifugation from overexpressed circDYM HEK 293T cells, and the characterization of RVG-circDYM-EVs was successfully demonstrated in terms of size, morphology and specific markers. Beyond demonstrating proof-of-concept for an RNA drug delivery technology, we observed that systemic administration of RVG-circDYM-EVs efficiently delivered circDYM to the brain, and alleviated CUS-induced depressive-like behaviours, and we discovered that RVG-circDYM-EVs notably inhibited microglial activation, BBB leakiness and peripheral immune cells infiltration, and attenuated astrocyte disfunction induced by CUS. CircDYM can bind mechanistically to the transcription factor TAF1 (TATA-box binding protein associated factor 1), resulting in the decreased expression of its downstream target genes with consequently suppressed neuroinflammation. Taken together, our findings suggest that extracellular vesicle-mediated delivery of circDYM is effective for MDD treatment and promising for clinical applications.

Keywords: CircDYM; MDD; TAF1; extracellular vesicles; inflammation.


Conflict of interest statement

The author declared no conflict of interest.

Figures

FIGURE 1
FIGURE 1
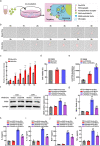
Preparation and characterization of engineered RVG‐EVs. (a) Schematic diagram of the production and harvest of engineered RVG‐EVs for targeted circDYM delivery. (b) TEM of RVG‐EVs isolated from the culture medium of HEK 293T cells. (c) RVG‐EVs were measured by NTA. (d) Western blot analysis of HA, Lamp2b, CD63, TSG101, and GM130 from RVG‐circDYM‐HEK 293T cells and RVG‐circDYM‐EVs. (e) Absolute qPCR analysis of circDYM copy numbers in HEK 293T cells transduced with vector or circDYM lentivirus. ***P < 0.001 versus the RVG‐Vector‐HEK 293T cells group using Student's t‐test. (f) Absolute qPCR analysis of circDYM copy numbers in RVG‐circDYM EVs. ***P < 0.001 versus RVG‐Vector‐EVs using Student's t‐test. (g) Absolute qPCR analysis of circDYM copy numbers in RVG‐EVs after treatments with RNase A/T1 Mix and 1% Triton X‐100 for 30 min. ***P < 0.001 versus the Control group using one‐way ANOVA followed by Holm‐Sidak post hoc multiple comparisons test. All data were presented as mean ± SEM of three independent experiments. Images of unedited full blots in Figure S16
FIGURE 2
FIGURE 2
RVG‐circDYM‐EVs inhibited primary mouse microglial activation in vitro. (a) Schematic illustration of the addition and uptake of engineered RVG‐EVs into the primary mouse microglia. (b) Bright‐field images of primary mouse microglia incubated with mock EVs or RVG‐EVs at 0, 1, 2, 3, 4, 5, and 6 h. Scale bar: 20 μm. (c) Quantitative fluorescence analysis of Dil in primary mouse microglia after incubation with Dil‐labelled mock EVs or RVG‐EVs (n = 6 for each group). ***P < 0.001 versus the mock EVs group using two‐way repeated‐measures ANOVA followed by the Holm‐Sidak post hoc multiple comparison test. (d) CCK8 assay was performed after primary mouse microglia were incubated with mock EVs or RVG‐EVs for 6 h. (e) Absolute qPCR analysis of circDYM copy numbers in primary mouse microglia after co‐incubation with circDYM‐EVs or RVG‐circDYM‐EVs for 6 h. **P < 0.01, ***P < 0.001 versus the Control group; ## P < 0.01 versus the circDYM‐EVs group using one‐way ANOVA followed by Holm‐Sidak post hoc multiple comparisons test. (f) Representative western blots of iNOS levels in primary mouse microglia after 6 h co‐incubated with RVG‐Vector‐EVs or RVG‐circDYM‐EVs with or without LPS treatment. ***P < 0.001 versus the Control + RVG‐Vector‐EVs group; ## P < 0.01 versus the LPS + RVG‐Vector‐EVs group using two‐way ANOVA followed by the Holm‐Sidak post hoc multiple comparison test. (g) NO production in primary mouse microglia after 6 h co‐incubated with RVG‐Vector‐EVs or RVG‐circDYM‐EVs with or without LPS treatment. ***P < 0.001 versus the Control + RVG‐Vector‐EVs group; ### P < 0.001 versus the LPS + RVG‐Vector‐EVs group using two‐way ANOVA followed by the Holm‐Sidak post hoc multiple comparison test. (h–k) Level of IL‐6 (h), IL‐1β (i), MCP‐1 (j), and TNF‐α (k) measured by ELISA in primary mouse microglia after 6 h co‐incubated with RVG‐Vector‐EVs or RVG‐circDYM‐EVs with or without LPS treatment. ***P < 0.001 versus the Control + RVG‐Vector‐EVs group; # P < 0.05, ## P < 0.01, ### P < 0.001 versus the the LPS + RVG‐Vector‐EVs group using two‐way ANOVA followed by the Holm‐Sidak post hoc multiple comparison test. Images of unedited full blots in Figure S17
FIGURE 3
FIGURE 3
Biodistribution of DiR‐labelled RVG‐EVs in vivo. (a) Representative live fluorescence imaging of DiR‐labelled mock EVs or RVG‐EVs distribution in the mice. (b) Distribution of mock EVs or RVG‐EVs in different organs of the mice after 24 h of injection. Right boxed graph illustrates location of the analysed six organs. (c) Quantitation of fluorescence intensities in different organs. **P < 0.01 versus the mock EVs group using Student's t‐test. (d) qPCR analysis of circDYM levels in the brain, heart, liver, spleen, lung, and kidney of normal mice at h 2, 12 and 24 after intravenous injection of circDYM‐EVs with a dose of 200 μg (n = 6 for each group). ***P < 0.001 versus the untreated group using one‐way ANOVA followed by the Holm‐Sidak post hoc multiple comparison test. (e) qPCR analysis of circDYM levels in the brain, heart, liver, spleen, lung, and kidney of normal mice at h 2, 12 and 24 after intravenous injection of RVG‐circDYM‐EVs with a dose of 200 μg (n = 6 for each group). **P < 0.01, ***P < 0.001 versus the untreated group using one‐way ANOVA followed by the Holm‐Sidak post hoc multiple comparison test
FIGURE 4
FIGURE 4
Engineered RVG‐EVs efficiently delivered exosomal circDYM into the brain. (a) Representative NIRF images of mice brains which received the administration of DiR‐labelled mock EVs or RVG‐EVs. (b) Quantitation of fluorescence intensity in the brains. ***P < 0.001 versus the mock EVs group using two‐way ANOVA followed by the Holm‐Sidak post hoc multiple comparison test. (c) Co‐localization of Dil‐labelled mock EVs or RVG‐EVs and HA tag‐stabilized peptide‐RVG fusion proteins in the brain of normal mice. Scale bar: 50 μm. (d) Confocal microscopy images of Dil‐labelled mock EVs or RVG‐EVs. Red fluorescent spots indicate Dil‐labelled EVs, and lake blue fluorescence represents Iba‐1 (microglia). Scale bar: 50 μm. (e) Absolute qPCR analysis of RNA extracted from the mouse hippocampus 24 h after injection of RVG‐Vector‐EVs or RVG‐circDYM‐EVs (n = 6 for each group). ***P < 0.001 versus the RVG‐Vector‐EVs group using Student's t‐test
FIGURE 5
FIGURE 5
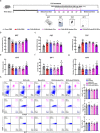
Effects of different doses of circDYM mediated by RVG‐EVs on depressive‐like behaviours in CUS mice. (a) qPCR analysis of circDYM levels in the brain of normal mice following injection of various quantities of RVG‐circDYM‐EVs (n = 3 for each group). *P < 0.05, ***P < 0.001 versus the untreated group using one‐way ANOVA followed by the Holm‐Sidak post hoc multiple comparison test. (b) Schematic of the experimental procedure and behavioural studies. (c–h) CircDYM relieved depressive‐like behaviours in CUS mice (n = 6 for each group) as measured by the SPT (c), FST (d), TST (e) and OFT (f–h). **P < 0.01, ***P < 0.001 versus the Control + RVG‐Vector‐EVs group; # P < 0.05, ## P < 0.01, and ### P < 0.001 versus the CUS + RVG‐Vector‐EVs group using two‐way ANOVA followed by the Holm‐Sidak post hoc multiple comparison test
FIGURE 6
FIGURE 6
RVG‐EV‐mediated delivery of circDYM alleviated depressive‐like behaviours in CUS mice. (a) Schematic of the experimental procedure and behavioural studies. (b–g) CircDYM relieved depressive‐like behaviours in CUS mice (n = 6 for each group) as measured by the SPT (b), FST (c), TST (d) and OFT (e–g). *P < 0.05, **P < 0.01, ***P < 0.001 versus the Control + RVG‐Vector‐EVs group; # P < 0.05, ## P < 0.01, and ### P < 0.001 versus the CUS + RVG‐Vector‐EVs group using two‐way ANOVA followed by the Holm‐Sidak post hoc multiple comparison test. (h) Peripheral immune cells analysed by FCM indicated no overt changes in CD4+ T cells, immunosuppressive Treg cells, and pro‐inflammatory Th17 cells in mice treated with mock EVs, RVG‐HA, or RVG‐EVs compared to those treated with PBS (n = 6 for each group). Data were analysed using one‐way ANOVA followed by the Holm‐Sidak post hoc multiple comparison test
FIGURE 7
FIGURE 7
RVG‐EV‐mediated delivery of circDYM attenuated microglial activation. (a–d) Level of IL‐6 (a), IL‐1β (b), MCP‐1 (c), and TNF‐α (d) measured by ELISA in the hippocampus after RVG‐circDYM‐EVs administration with or without CUS treatment (n = 6 for each group). **P < 0.01, ***P < 0.001 versus the Control + RVG‐Vector‐EVs group; # P < 0.05, ### P < 0.001 versus the CUS + RVG‐Vector‐EVs group using two‐way ANOVA followed by the Holm‐Sidak post hoc multiple comparison test. (e) Representative western blots of iNOS levels after RVG‐circDYM‐EVs administration with or without CUS treatment (n = 6 for each group). ***P < 0.001 versus the Control + RVG‐Vector‐EVs group; ### P < 0.001 versus the CUS + RVG‐Vector‐EVs group using two‐way ANOVA followed by the Holm‐Sidak post hoc multiple comparison test. (f) FCM analysis of CD11b+CD45dim microglial cells isolated from the CUS mouse brain by the Percoll gradient method (n = 6 for each group). ***P < 0.001 versus the Control + RVG‐Vector‐EVs group; ### P < 0.001 versus the CUS + RVG‐Vector‐EVs group using two‐way ANOVA followed by the Holm‐Sidak post hoc multiple comparison test. (g–k) RVG‐circDYM‐EVs inhibited microglial activation in the CUS mouse hippocampus. Representative images of microglial immunostaining for Iba‐1, followed by 3D reconstruction and Sholl analysis (g). Scale bar: 50 μm. Average soma volume (h), branch number (i), total branch length (j), and total branch volume (k). (n = 6 mice for each group, 60 cells for each group). ***P < 0.001 versus the Control + RVG‐Vector‐EVs group; ### P < 0.001 versus the CUS + RVG‐Vector‐EVs group using two‐way ANOVA followed by the Holm‐Sidak post hoc multiple comparison test. ELISA, Enzyme‐linked immunosorbent assay; SSC‐A, side scatter area; FSC‐A, forward scatter area. Images of unedited full blots in Figure S18
FIGURE 8
FIGURE 8
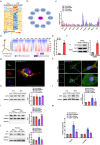
CircDYM directly bound to TAF1 to regulate microglial activation. (a) Microarray heat map assessing the variation in mRNA expression in primary mouse microglia with overexpressed circDYM and vector treated with or without LPS. (n = 3 for each group) (b) Prediction of transcriptor‐mRNA interaction using the GTRD algorithm. (c) qPCR analysis of the expression of potential TAF1 target genes in LPS‐induced primary mouse microglia after circDYM overexpression. All data were presented as mean ± SEM of three independent experiments. *P < 0.05, **P < 0.01, ***P < 0.001 versus the Control + Vector group; # P < 0.05 versus the LPS + Vector group using two‐way repeated measures ANOVA followed by the Holm‐Sidak post hoc multiple comparison test. (d) Prediction of circDYM‐TAF1 interaction using the catPAPID algorithm and schematic of TAF1 with functional protein domains. (e) qPCR analysis of relative enrichment of endogenous circDYM in TAF1 RIP. All data were presented as mean ± SEM of three independent experiments. ***P < 0.001 versus the IgG group using Student's t‐test. (f) Western blot analysis of relative enrichment of endogenous TAF1 in circDYM RIP. All data were presented as mean ± SEM of three independent experiments. **P < 0.01 versus the Vector group using Student's t‐test. (g) Co‐localization of circDYM and TAF1 in the cytoplasm of primary mouse microglia by FISH analysis. Green: circDYM; Red: TAF1; Blue: DAPI. Scale bar: 20 μm. (h–j) Western blot analysis of TAF1 protein levels (h) and cytoplasmic (i) or nuclear (j) localization of TAF1 in primary mouse microglia after vector or circDYM lentivirus transduction with or without treated with LPS (100 ng ml–1) for 24 h. The purity of cell subcellular fractions was assessed by western blotting against specific markers. All data were presented as mean ± SEM of three independent experiments. *P < 0.05, **P < 0.01 versus the Control + Vector group; # P < 0.05, ### P < 0.001 versus the LPS + Vector group using two‐way ANOVA followed by the Holm‐Sidak post hoc multiple comparison test. (k) Distribution of TAF1 in primary microglia. Primary mouse microglia were subjected to immunocytochemistry analysis of TAF1 and Iba‐1 proteins and DAPI staining of genomic DNA with or without LPS treatment. Scale bar: 20 μm. (l) Overexpression of circDYM significantly inhibited iNOS expression induced by TAF1 in primary mouse microglia. All data were presented as mean ± SEM of three independent experiments. **P < 0.01 versus the Control + Vector group; ## P < 0.01 versus the TAF1 +Vector group using two‐way repeated measures ANOVA followed by the Holm‐Sidak post hoc multiple comparison test. (m) qPCR analysis of the expression of potential TAF1 target genes in primary mouse microglia after overexpression of circDYM or TAF1. All data were presented as mean ± SEM of three independent experiments. **P < 0.01 versus the Control + Vector group; # P < 0.05, ## P < 0.01 versus the TAF1 +Vector group using two‐way repeated measures ANOVA followed by the Holm‐Sidak post hoc multiple comparison test. Images of unedited full blots in Figure S19
FIGURE 9
FIGURE 9
Schematic illustration of the effect of RVG‐circDYM‐EVs on the functional recovery in CUS mice. Intravenous administration of RVG‐circDYM‐EVs following CUS treatment significantly ameliorated depressive‐like behaviours by inhibiting neuroinflammation. CircDYM binds to TAF1 and downregulates multiple downstream genes (Trpm6, Cyp39a1) to maintain brain functions

References

    1. Abbott, N. J. , Patabendige, A. A. K. , Dolman, D. E. M. , Yusof, S. R. , & Begley, D. J. (2010). Structure and function of the blood‐brain barrier. Neurobiology of Disease, 37, 13–25. - PubMed
    1. Alvarez‐Erviti, L. , Seow, Y. , Yin, H. , Betts, C. , Lakhal, S. , & Wood, M. J. A. (2011). Delivery of siRNA to the mouse brain by systemic injection of targeted exosomes. Nature Biotechnology, 29, 341–345. - PubMed
    1. Arnow, B. A. , Blasey, C. , Williams, L. M. , Palmer, D. M. , Rekshan, W. , Schatzberg, A. F. , Etkin, A. , Kulkarni, J. , Luther, J. F. , & Rush, A. J. (2015). Depression subtypes in predicting antidepressant response: A report from the iSPOT‐D trial. American Journal of Psychiatry, 172, 743–750. - PubMed
    1. Athauda, D. , Gulyani, S. , Karnati, H. K. , Li, Y. , Tweedie, D. , Mustapic, M. , Chawla, S. , Chowdhury, K. , Skene, S. S. , Greig, N. H. , Kapogiannis, D. , & Foltynie, T. (2019). Utility of neuronal‐derived exosomes to examine molecular mechanisms that affect motor function in patients with Parkinson disease: A secondary analysis of the exenatide‐PD trial. JAMA Neurology, 76, 420–429. - PMC - PubMed
    1. Belzeaux, R. , Gorgievski, V. , Fiori, L. M. , Lopez, J. P. , Grenier, J. , Lin, R. , Nagy, C. , Ibrahim, ElC , Gascon, E. , Courtet, P. , Richard‐Devantoy, S. , Berlim, M. , Chachamovich, E. , Théroux, J. ‐F. , Dumas, S. , Giros, B. , Rotzinger, S. , Soares, C. N. , Foster, J. A. , … Turecki, G. (2020). GPR56/ADGRG1 is associated with response to antidepressant treatment. Nature Communication, 11, 1635. - PMC - PubMed

Publication types

MeSH terms