. 2022 Jan;11(1):e12183.
doi: 10.1002/jev2.12183.

Human neural cell type-specific extracellular vesicle proteome defines disease-related molecules associated with activated astrocytes in Alzheimer's disease brain

Affiliations

Human neural cell type-specific extracellular vesicle proteome defines disease-related molecules associated with activated astrocytes in Alzheimer's disease brain

Yang You et al. J Extracell Vesicles. 2022 Jan.

Abstract

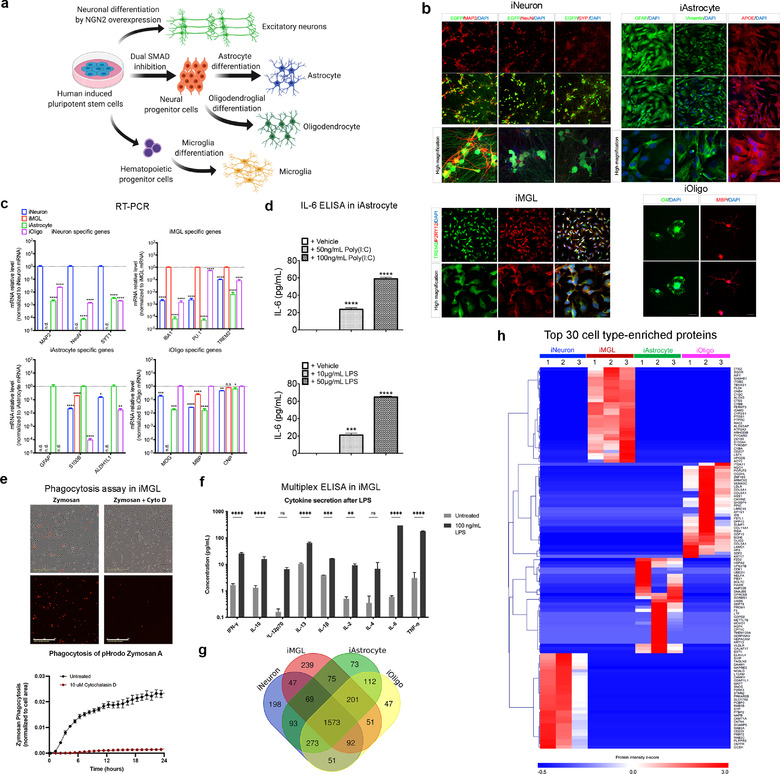
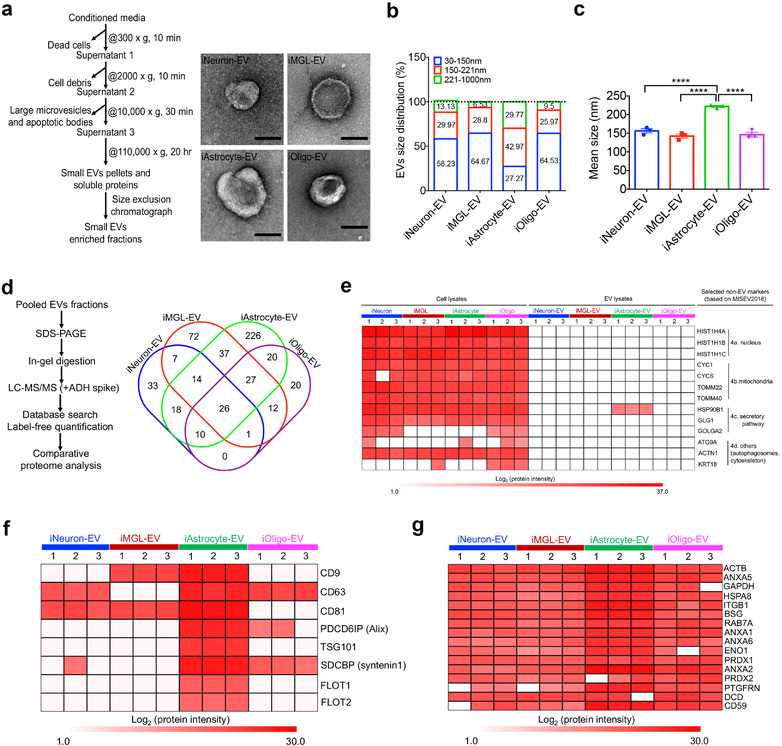
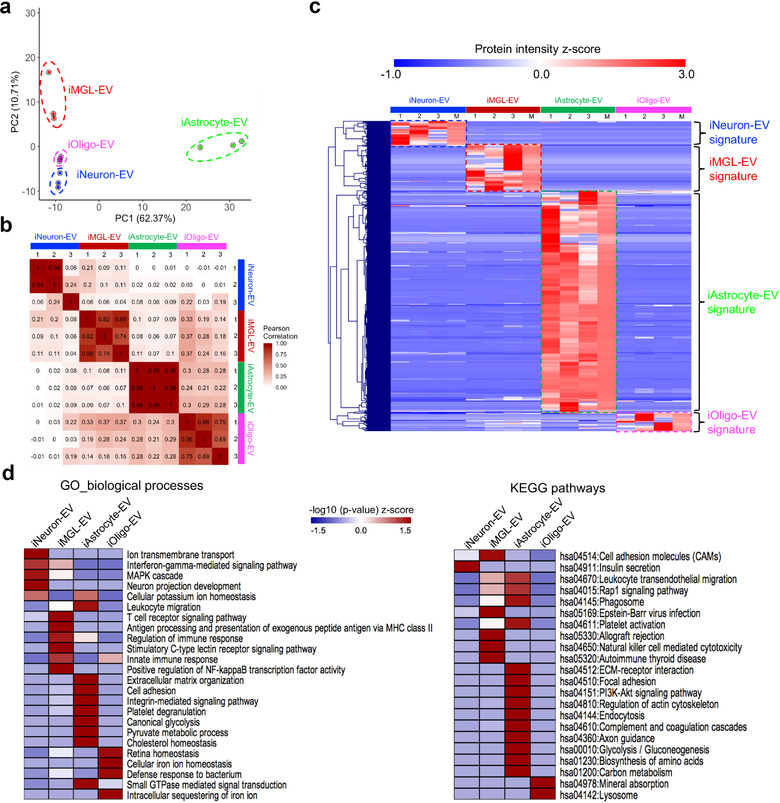
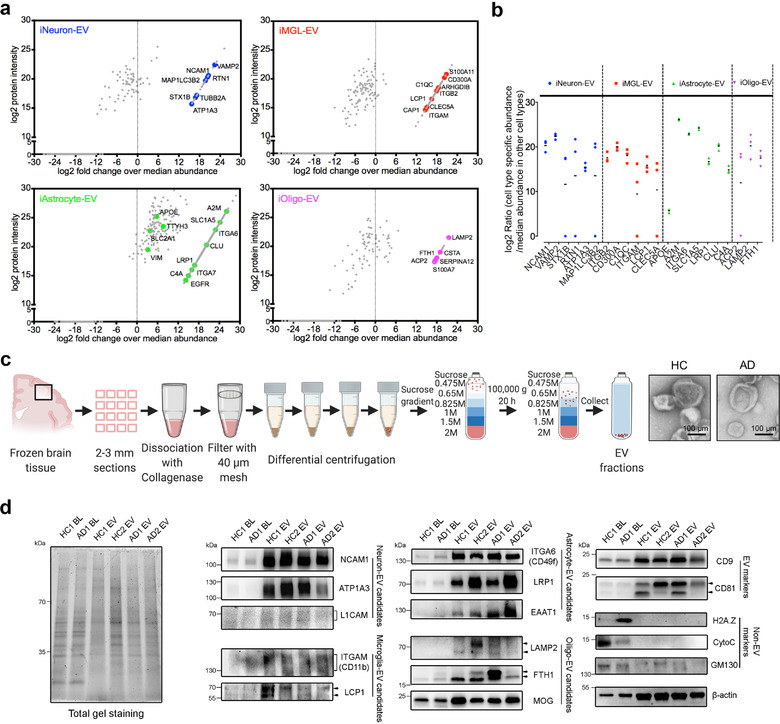
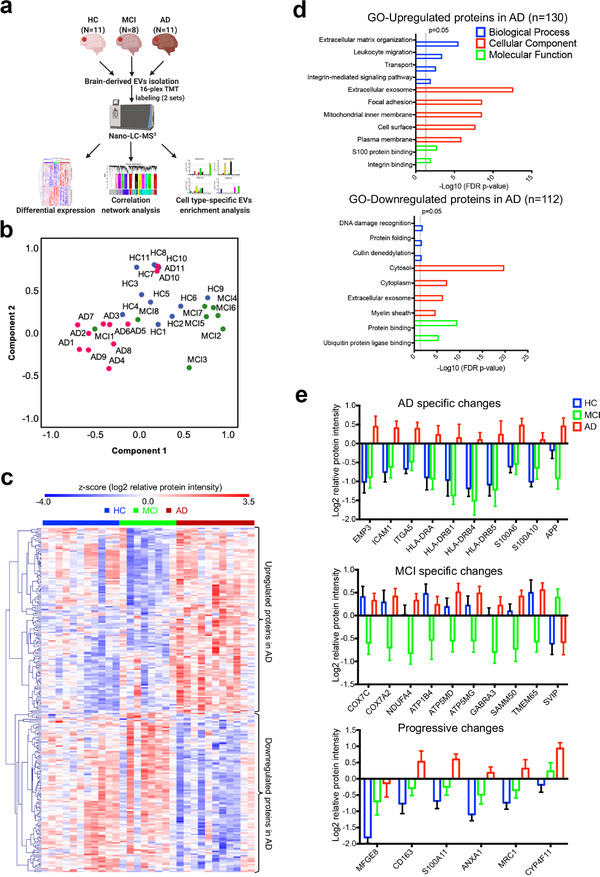
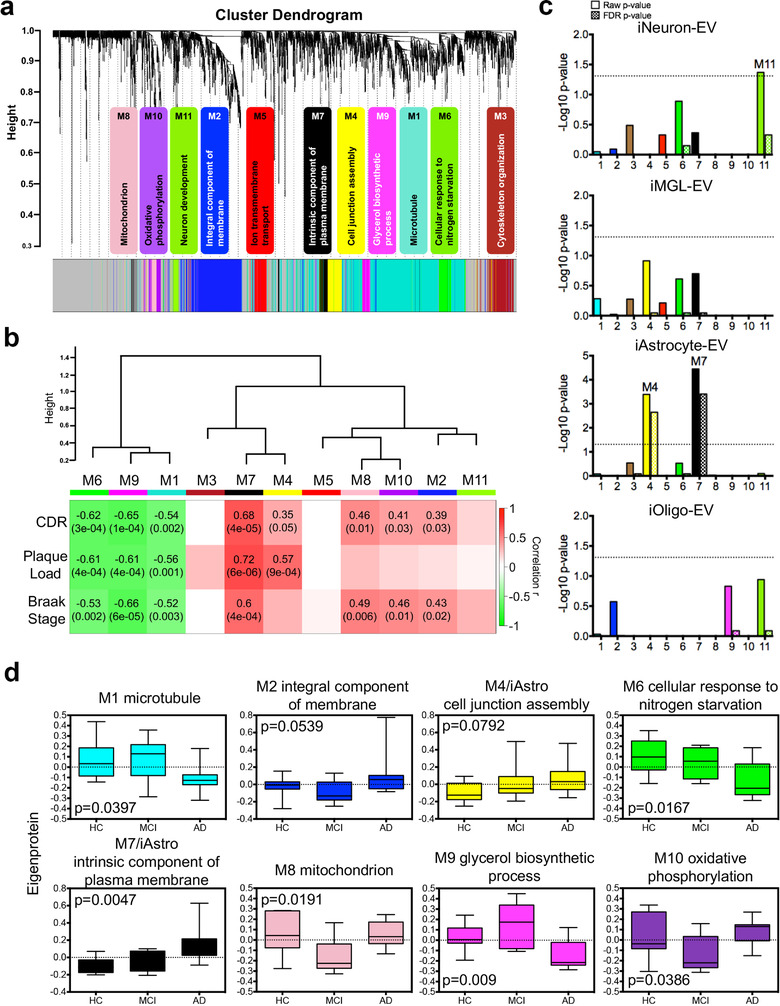
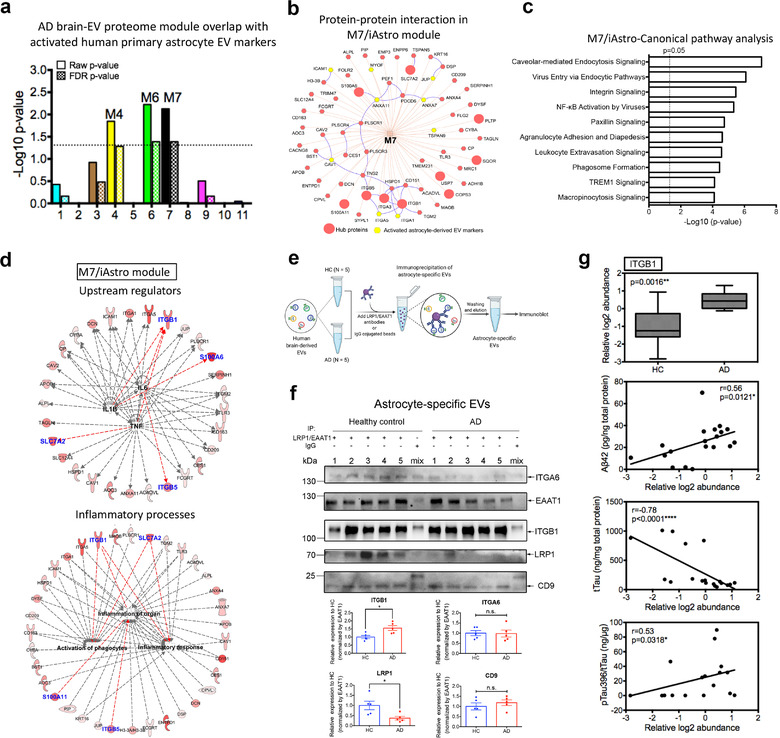
In neurodegenerative diseases, extracellular vesicles (EVs) transfer pathogenic molecules and are consequently involved in disease progression. We have investigated the proteomic profiles of EVs that were isolated from four different human-induced pluripotent stem cell-derived neural cell types (excitatory neurons, astrocytes, microglia-like cells, and oligodendrocyte-like cells). Novel cell type-specific EV protein markers were then identified for the excitatory neurons (ATP1A3, NCAM1), astrocytes (LRP1, ITGA6), microglia-like cells (ITGAM, LCP1), and oligodendrocyte-like cells (LAMP2, FTH1), as well as 16 pan-EV marker candidates, including integrins and annexins. To further demonstrate how cell-type-specific EVs may be involved in Alzheimer's disease (AD), we performed protein co-expression network analysis and conducted cell type assessments for the proteomes of brain-derived EVs from the control, mild cognitive impairment, and AD cases. A protein module enriched in astrocyte-specific EV markers was most significantly associated with the AD pathology and cognitive impairment, suggesting an important role in AD progression. The hub protein from this module, integrin-β1 (ITGB1), was found to be significantly elevated in astrocyte-specific EVs enriched from the total brain-derived AD EVs and associated with the brain β-amyloid and tau load in independent cohorts. Thus, our study provides a featured framework and rich resource for the future analyses of EV functions in neurodegenerative diseases in a cell type-specific manner.


Conflict of interest statement

T.I. has a sponsored research agreement from Abbvie, Inc. for this study. M.B.J. and W.W.P. are co‐inventors of patent WO/2018/160496, related to the differentiation of human pluripotent stem cells into microglia.

Figures

FIGURE 1
FIGURE 1
Brain cell type differentiation and characterization. (a) Schematics for the excitatory neuron, astrocyte, microglia, and oligodendrocyte differentiation from hiPSCs. (b) Representative immunofluorescent images of cell type specific markers. iPSC‐induced excitatory neurons (iNeurons) were stained for neuron‐specific markers (MAP2, NeuN, and SYP; synaptophysin). Scale bar, 75 and 20 μm (high magnification). iPSC‐derived microglia‐like cells (iMGLs) were stained for microglia‐specific markers (TREM2 and P2RY12). Scale bar, 30 μm (upper) and 10 μm (lower). iPSC‐derived astrocytes (iAstrocytes) were stained for astrocyte‐specific markers (GFAP, Vimentin, and APOE). Scale bar, 75 and 20 μm (high magnification). iPSC‐derived oligodendrocyte‐like cells (iOligos) were stained for oligodendrocyte‐specific markers (O4 and MBP). Scale bar, 75 μm. (c) qRT‐PCR of cell type‐specific markers for iNeuron (MAP2, NeuN and SYT1), iMGL (IBA1, PU.1 and TREM2), iAstrocyte (GFAP, S100B and ALDH1L1), and iOligo (MOG, MBP and CNP) showing the relative mRNA levels of these genes normalized by the specified cell type. Data are presented as mean ± SEM. n.d., non‐determined; *p < 0.05, **p < 0.01, ***p < 0.001, and ****p < 0.0001, determined by one‐way ANOVA with Dunnett's multiple comparisons. (d) IL‐6 secretion following 24 h of treatment with poly(I:C) and lipopolysaccharide in iAstrocytes (n = 3). Data are presented as the mean ± SEM using one‐way ANOVA with Tukey multiple comparisons. ***p < 0.001 and ****p < 0.0001. (e) Phagocytosis of pHrodo‐tagged Zymosan A over 24 h (representative images at 24 h) in iMGLs determined by fluorescence intensity. Inhibition of actin polymerization with Cytochalasin D (10 μM, 30 min pre‐treatment) attenuated phagocytosis. n = 4 wells (four images per well, imaged hourly on Incucyte S3). Scale bar, 200 μm. (f) Stimulation of iMGLs with 100 ng/ml LPS for 24 h increased pro‐inflammatory cytokine secretion (n = 4). Data are presented as mean ± SEM using two‐way ANOVA with Sidak's multiple comparisons. n.s., no significance, **p < 0.01, ***p < 0.001, and ****p < 0.0001. (g) Venn diagram showing the number of differentially identified proteins in cell lysates from iNeuron, iMGL, iAstrocyte, and iOligo. (h) Heatmap illustrating the top 30 enriched proteins across the four cell types based on their protein intensity as determined from mass spectrometry. Some common cell type‐specific protein markers were identified in iNeuron (e.g., MAPT), iMGL (e.g., AIF1, PU.1), iAstrocyte (e.g., AQP4), and iOligo (e.g., OLIG2). MAP2, microtubule associated protein2; NeuN, RNA binding Fox‐1 homolog 3; SYP, synaptophysin; TREM2, Triggering Receptor Expressed On Myeloid Cells 2; P2RY12, purinergic receptor P2RY12; GFAP, glial fibrillar acidic protein; APOE, apolipoprotein E; MBP, myelin basic protein; SYT1, synaptotagmin 1; IBA1/AIF1, ionized calcium binding adaptor molecule 1/allograft inflammatory factor 1; PU.1, transcription factor PU.1; S100B, S100 calcium‐binding protein B; ALDH1L1, 10‐formyltetrahydrofolate dehydrogenase; MOG, myelin oligodendrocyte glycoprotein; MBP, myelin basic protein; CNP, 2′,3′‐cyclic nucleotide 3′‐phosphodiesterase; SEM, standard error of the mean; ANOVA, analysis of variances; LPS, lipopolysaccharide; MAPT, microtubule associated protein tau; AQP4, aquaporin 4; OLIG2, oligodendrocyte transcription factor 2
FIGURE 2
FIGURE 2
Isolation and characterization of extracellular vesicles from hiPSC‐derived brain cells. (a) Workflow for the EV isolation and transmission electron microscopy (TEM) images of isolated iNeuron‐, iMGL‐, iAstrocyte‐, and iOligo‐EVs. Scale bar: 100 nm. (b) Size distribution of the isolated EVs from four cell types determined using a nanoparticle tracking analysis (NTA, n = 3 for each cell type). (c) Comparison of the EV mean size among the four cell types by NTA (n = 3 for each cell type). iAstrocyte showed the significant increase in diameter of the EV size when compared to the other three cell types. Data are presented as the mean ± SEM. **** p < 0.0001. (d) Workflow for the label‐free proteomics and Venn diagram showing the number of EV proteins differentially identified in iNeuron, iMGL, iAstrocyte, and iOligo. (e) Heatmap illustrating the expression of non‐EV protein markers present in different brain cell‐derived EVs and their cellular origins based on the protein intensity determined using mass spectrometry. Four types of non‐EV protein markers, including proteins from the nucleus, mitochondria, secretory pathway, and others, were selected as indicated in the MISEV2018 guideline (Théry et al., 2018). (f) Heatmap illustrating the enrichment of conventional exosome protein markers present in different brain cell‐derived EVs based on their protein intensity from mass spectrometry. (g) Sixteen newly defined pan‐EV marker candidates from different cell types based on their protein intensity, determined using mass spectrometry. Proteins represented in at least two of the three replicates within each cell type were selected. The white cells indicate no presence of the protein in the specified cell type. hiPSC, human induced pluripotent stem cells; EV, extracellular vesicle; TEM, transmission electron microscopy; iNeuron, hiPSC‐derived excitatory neuron; iMGL, hiPSC‐derived microglia‐like cell; iAstrocyte, hiPSC‐derived astrocyte; iOligo, hiPSC‐derived oligodendrocyte‐like cells; NTA, nanoparticle tracking analysis; SEM, standard error of the mean; MISEV2018, Minimal information for studies of extracellular vesicles 2018
FIGURE 3
FIGURE 3
Comparative analysis of the hiPSC‐derived cell‐type‐specific EV proteome. (a) Principal component analysis (PCA). The EV proteome of all cell types and their differentiation states were measured in triplicate and classified into four major cell types based on component 1 (62.37% variability) and component 2 (10.71% variability). (b) Heatmap of the Pearson correlations between each sample, showing high correlation coefficients for the protein intensity determined from the triplicate measurements. (c) Heatmap of the z‐scores for the protein intensities of the cell type‐specific EV proteins after unsupervised hierarchical clustering (= 3 for each cell type). M represents the median protein abundance of the triplicate measurements. Proteins are divided into four clusters showing the different EV protein signatures across different cell types. (d) Heatmap of the functional enrichments [z‐scored (‐log10 p‐value)] of the EV protein signatures across different cell types for the gene ontology (biological process) terms and KEGG pathways using DAVID Bioinformatics Resources 6.8. PCA, principal component analysis; EV, extracellular vesicle; KEGG, Kyoto Encyclopedia of Genes and Genomes; DAVID, Database for Annotation, Visualization, and Integrated Discovery
FIGURE 4
FIGURE 4
Abundant and enriched proteins were identified in the cell type specific EVs. (a) Scatter plot of the identified proteins in the indicated cell type using log2 protein intensity versus log2 fold change over the protein abundance in the other three cell types. The coloured dots highlight several enriched proteins that are cell type‐specific (Sharma et al., 2015) as potential cell type‐specific EV marker candidates. (b) Log2 fold change of selected marker candidates in individual replicates for the specified cell types when compared to the other cell types. (c) Schematic of the EV isolation method from human frozen brain tissues for immunoblotting and TEM images of isolated brain derived EVs from healthy controls (HC) and AD patients. Scale bar; 100 nm. (d) Western blot analysis of the brain lysates and associated EVs isolated from both HC and AD patients for conventional and newly identified neural cell type specific EV proteins, as well as common EV (CD9, CD81) and non‐EV (H2A.Z, CytoC, GM130) protein markers, and the reference protein β‐actin (ACTB). Equivalent proteins from brain lysates and EVs were loaded as loading controls and indicated in the total gel staining (left panel). The original western blot images are shown in Supplementary Figure S8. BL, brain lysate; EV, extracellular vesicle; HC, healthy control; AD, Alzheimer's disease
FIGURE 5
FIGURE 5
Proteomic analyses of the EVs isolated from the brains of healthy controls, mild cognitive impairment and Alzheimer's disease cases. (a) Graphic illustration of the workflow for brain derived EV proteomes. Brain tissue was sectioned from the postmortem frontal cortex of HC (n = 11), MCI (n = 8), and AD (n = 11) patients for EV isolation. Protein levels were measured and quantified using 16‐plex TMT labelled mass spectrometry and analyzed using differential expression, correlation network analysis, and cell type‐specific EV enrichment analysis. (b) PCA of the total EV samples. HC, blue symbols; MCI, green symbols; AD, red symbols. (c) Heatmap of the z‐scored log2 relative protein intensities within each of the EV sample after unsupervised hierarchical clustering showing the significantly altered proteins in the three comparisons (HC vs. AD, HC vs. MCI, and MCI vs. AD) determined by ANOVA (p < 0.05) followed by Tukey's post hoc test (p < 0.01). Proteins are divided into two clusters showing upregulated and downregulated EV proteins in AD. (d) Gene ontology (GO) analysis of the upregulated and downregulated proteins in AD brain derived EVs by using DAVID Bioinformatics Resources 6.8. The top significant (FDR  p‐value < 0.05) GO terms in biological Process, Cellular Component and Molecular Function are listed. (e) List of several significantly differentially expressed proteins (Tukey's post hoc test p < 0.05, fold change over other group > 2) that have AD specific changes, MCI specific changes, and progressive changes across the comparisons of HC, MCI, and AD groups. Data are presented as mean ± SEM. HC, healthy control; MCI, mild cognitive impairment; AD, Alzheimer's disease; EV, extracellular vesicle; TMT, tandem mass tag; PCA, principal component analysis; ANOVA, analysis of variances; GO, gene ontology; DAVID, Database for Annotation, Visualization, and Integrated Discovery; FDR, false discovery rate; SEM, standard error of the mean
FIGURE 6
FIGURE 6
Protein co‐expression network analysis of the brain derived EV proteome identified modules associated with specific gene ontologies and brain cell types. (a) WGCNA cluster dendrogram of the total identified brain‐derived EV proteins (n = 2645) from three groups with distinct protein modules (M1–11) defined by dendrogram branch cutting. The significant gene ontologies associated with these modules in biological processes or cellular components were noted. (b) Brain‐derived EV protein modules were clustered to assess module correlation with neuropathological hallmarks of AD based on protein co‐expression eigenproteins. The Pearson correlation and p‐value between module eigenprotein expression and CDR, plaque load value, and Braak stage. (c) Cell‐type enrichment was assessed by cross‐referencing module proteins (via matching gene symbols) using the one‐tailed Fisher's exact test against the lists of proteins determined as cell type‐specific EV markers derived from neurons, microglia, astrocytes, and oligodendrocytes. Both the raw p‐value and the FDR p‐value (correction for multiple comparisons by the Benjamini‐Hochberg method) are shown; bars extending above the dashed line represent p < 0.05. (d) Module eigenprotein level by case status for each protein module that had significant correlation with at least two traits in b. Cell‐type associated modules are highlighted. Boxplots are displayed for each of the case samples among the three groups (HC, MCI, and AD) and represent the median, 25th and 75th percentiles and whiskers represent the 5th and 95th percentiles, respectively. Significance was measured using one‐way nonparametric ANOVA, Kruskal‐Wallis p‐values. WGCNA, weighted gene co‐expression network analysis; EV, extracellular vesicle; CDR, cognitive dementia rating; FDR, false discovery rate; HC, healthy control; MCI, mild cognitive impairment; AD, Alzheimer's disease; ANOVA, analysis of variances
FIGURE 7
FIGURE 7
The M7 module is enriched in activated astrocyte derived EV markers and involved in inflammatory processes. (a) The enrichment of proteins, identified as EV markers for the activated astrocytes, was calculated for each module in the AD protein network using a one‐tailed Fisher's exact test. Both the raw p‐value and the FDR p‐value (correction for multiple comparisons by the Benjamini‐Hochberg method) are shown; The dashed line represents a p‐value <0.05, above which enrichment was considered statistically significant. Enrichment was assessed by cross‐referencing module proteins against lists of proteins determined to be differentially expressed in activated astrocyte derived EVs provided in Supplementary Table S16. (b) Protein‐protein interaction network within the M7 module generated by the ToppCluster tool (Kaimal et al., 2010) (https://toppcluster.cchmc.org/). The top 10 hub proteins are ranked by correlation significance with AD traits in the module and are highlighted in the larger red circle. Proteins highlighted in yellow are marker proteins from activated astrocyte derived EVs. (c) Ingenuity canonical pathway analysis of the proteins within the M7 module. The top 10 significantly enriched canonical pathways are listed. A statistically significant p‐value of 0.05 is indicated on the plot as a vertical dashed line, at the x‐value of 1.30. (d) Involvement of the protein co‐expression network within the M7 module in mediating inflammation. These proteins were regulated by potential pro‐inflammatory factors including TNF‐α, IL‐6, and IL‐1β and involved in inflammatory processes including the activation of phagocytes, inflammation of organ and inflammatory responses. The red color indicates the significance of the proteins in the M7 module; Blue indicates the top 10 hub proteins within the module; Red lines indicate leading to activation by a predicted relationship. (e) Schematic of the immunoprecipitation of astrocyte specific EVs from an independent cohort of HC (n = 5) and AD patients (n = 5) for immunoblotting. Combined antibodies against astrocyte‐EV proteins LRP1 and EAAT1 were conjugated to magnetic beads and then added for the immunocapture of astrocyte‐derived EVs. As a negative control, combined mouse and rabbit IgG were used to immunoprecipitate EVs mixed from the HC and AD groups. (f) Western blot analysis of the astrocyte‐specific EVs from the HC and AD patients for the hub protein ITGB1 in the M7/astrocyte‐EV module. The newly identified astrocyte specific EV marker ITGA6, common EV marker CD9, and immunoprecipitated protein EAAT1 and LRP1 were also detected. The original western blot images are shown in Supplementary Figure S9b. Equivalent brain derived EV proteins (30 μg) were isolated from healthy controls and AD patients were used to initiate the immunoprecipitation assay. The ITGB1 level was enriched and significantly elevated in the astrocyte specific EVs from AD when compared to the HC samples (p = 0.032). The LRP1 level was significantly reduced in astrocyte specific EVs from AD when compared to the HC samples (p = 0.032). The western blot signals were calculated using ImageJ and normalized by EAAT1 intensity. Data are presented as mean ± SEM, *p < 0.05, n.s., no significance, and determined using the Mann‐Whitney non‐parametric test. (g) Relative ITGB1 protein level in the human brain‐derived EVs isolated from HC (n = 9) and AD (n = 11) samples using our previously published proteomics dataset (Muraoka, Deleo, et al., 2020) and its correlation with AD pathogenic hallmarks (Aβ42, total tau and pSer396 tau) and evaluated using ELISA kits. The proteomics data and measurements are provided in Supplementary Table S18. Significance in the ITGB1 protein level was measured using a two‐sided Mann‐Whitney t‐test. Correlations were performed using nonparametric Spearman correlation analysis. Box plots represent the median, 25th and 75th percentiles and whiskers indicate the 5th and 95th percentiles, respectively. *p < 0.05, **p < 0.01, ****p < 0.0001. EV, extracellular vesicle; AD, Alzheimer's disease; FDR, false discovery rate; TNF‐α, tumour necrosis factor alpha; IL‐1β, interleukin 1 beta; IL‐6, interleukin 6; HC, healthy control; AD, Alzheimer's disease

References

    1. Abud, E. M. , Ramirez, R. N. , Martinez, E. S. , Healy, L. M. , Nguyen, C. H. H. , Newman, S. A. , Yeromin, A. V. , Scarfone, V. M. , Marsh, S. E. , Fimbres, C. , Caraway, C. A. , Fote, G. M. , Madany, A. M. , Agrawal, A. , Kayed, R. , Gylys, K. H. , Cahalan, M. D. , Cummings, B. J. , Antel, J. P. , … Blurton‐Jones, M. (2017). iPSC‐derived human microglia‐like cells to study neurological diseases. Neuron, 94, 278–293 e279. 10.1016/j.neuron.2017.03.042 - DOI - PMC - PubMed
    1. Asai, H. , Ikezu, S. , Tsunoda, S. , Medalla, M. , Luebke, J. , Haydar, T. , Wolozin, B. , Butovsky, O. , Kügler, S. , & Ikezu, T. (2015). Depletion of microglia and inhibition of exosome synthesis halt tau propagation. Nature Neuroscience, 18, 1584–1593. 10.1038/nn.4132 - DOI - PMC - PubMed
    1. Barabási, A.‐L. , Gulbahce, N. , & Loscalzo, J. (2011). Network medicine: A network‐based approach to human disease. Nature Reviews Genetics, 12, 56–68. 10.1038/nrg2918 - DOI - PMC - PubMed
    1. Barbar, L. , Jain, T. , Zimmer, M. , Kruglikov, I. , Sadick, J. S. , Wang, M. , Kalpana, K. , Rose, I. V. L. , Burstein, S. R. , Rusielewicz, T. , Nijsure, M. , Guttenplan, K. A. , Di Domenico, A. , Croft, G. , Zhang, B. , Nobuta, H. , Hébert, J. M. , Liddelow, S. A. , & Fossati, V. (2020). CD49f is a novel marker of functional and reactive human iPSC‐derived astrocytes. Neuron, 107, 436–453 e412. 10.1016/j.neuron.2020.05.014 - DOI - PMC - PubMed
    1. Brennan, K. , Martin, K. , FitzGerald, S. P. , O'Sullivan, J. , Wu, Y. , Blanco, A. , Richardson, C. , & Mc Gee, M. M. (2020). A comparison of methods for the isolation and separation of extracellular vesicles from protein and lipid particles in human serum. Scientific Reports, 10, 1039 - PMC - PubMed

Publication types

MeSH terms