. 2022 Feb 7;219(2):e20210815.
doi: 10.1084/jem.20210815. Epub 2022 Jan 14.

Lung tumor MHCII immunity depends on in situ antigen presentation by fibroblasts

Affiliations

Lung tumor MHCII immunity depends on in situ antigen presentation by fibroblasts

Dimitra Kerdidani et al. J Exp Med. .

Abstract

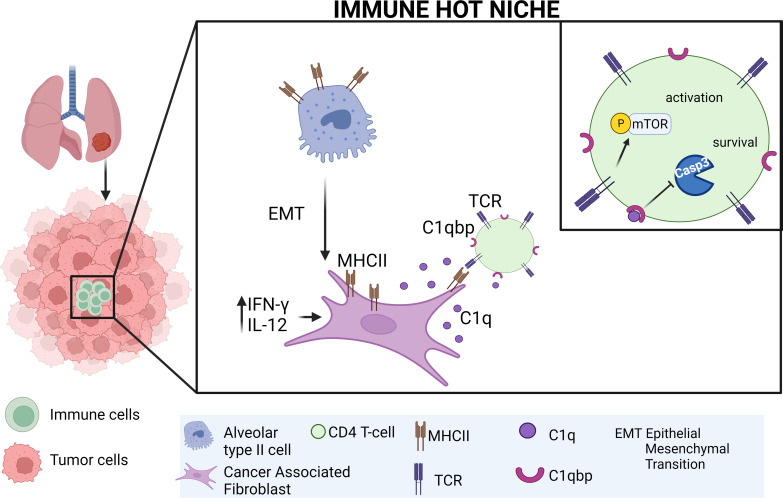
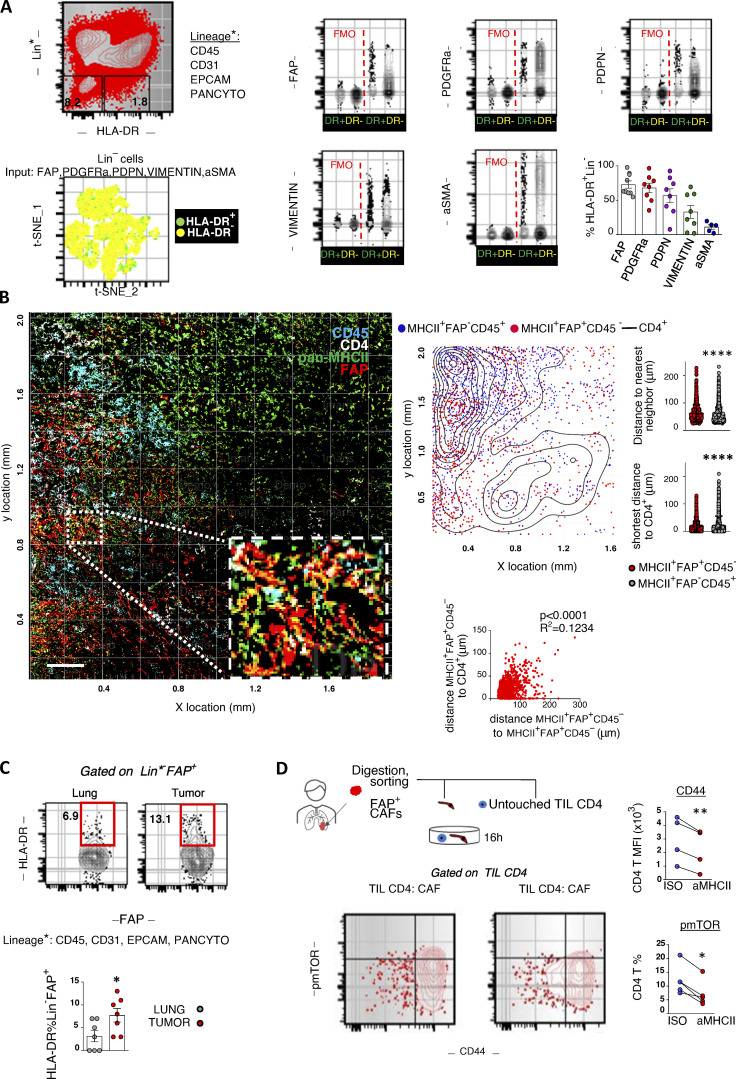
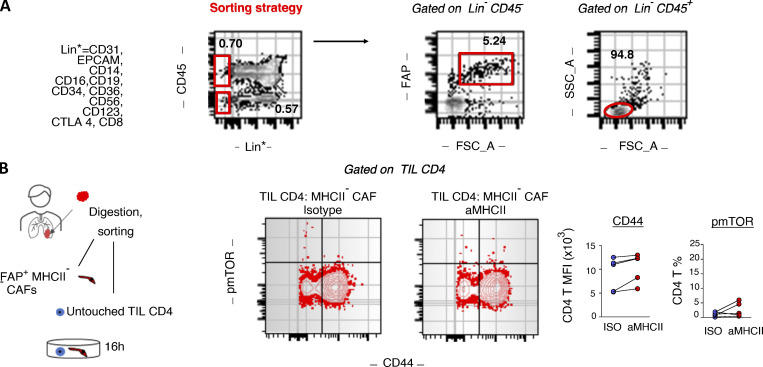
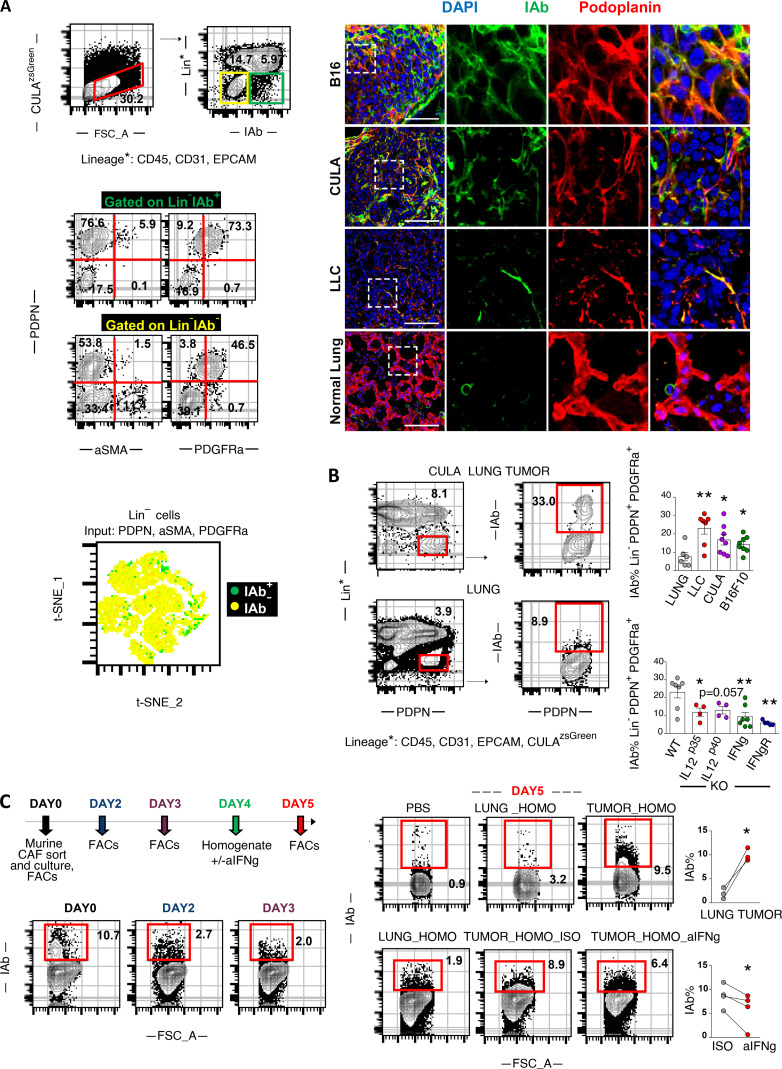
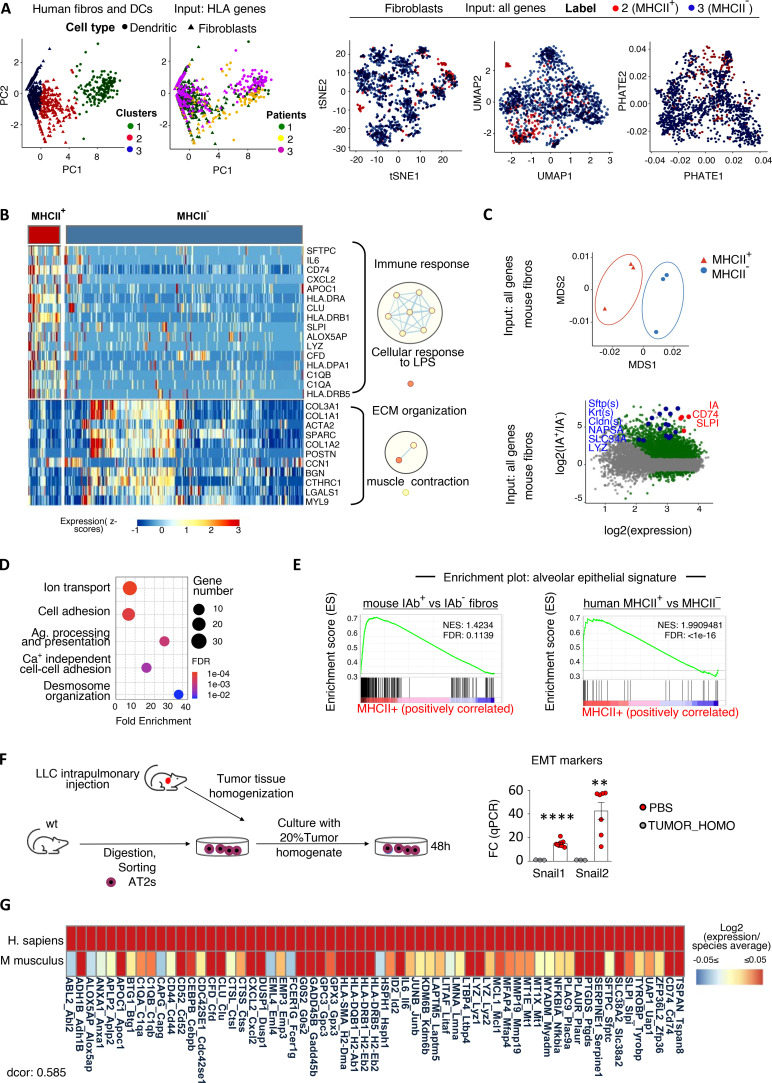
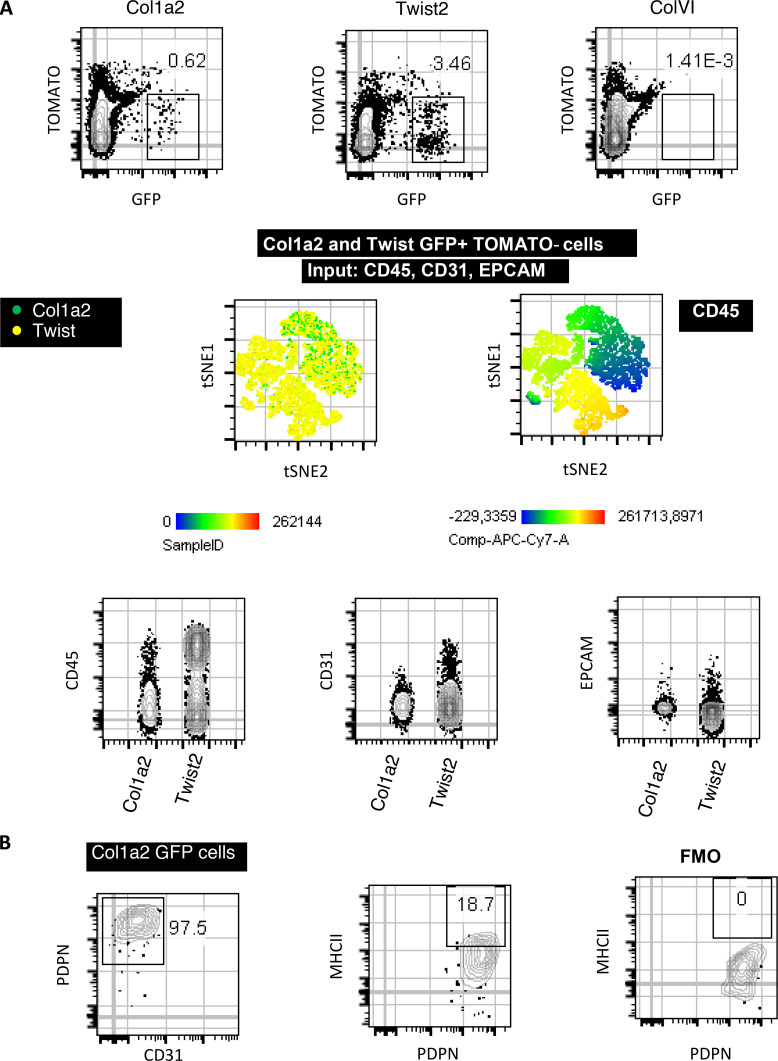
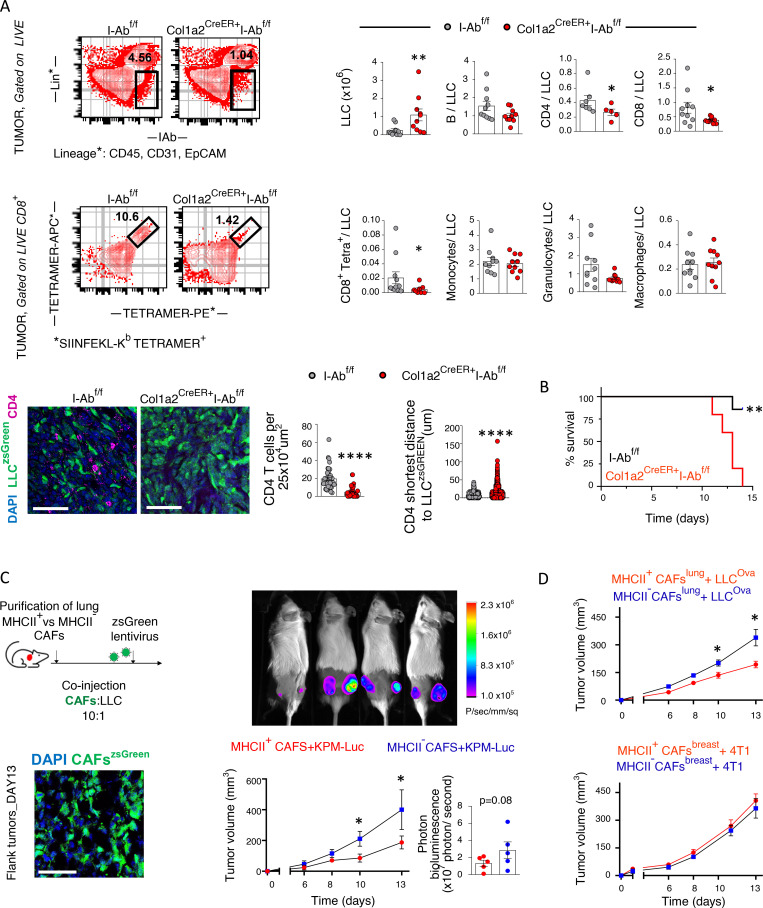
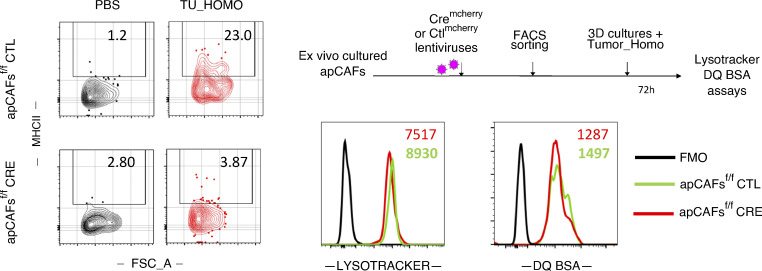
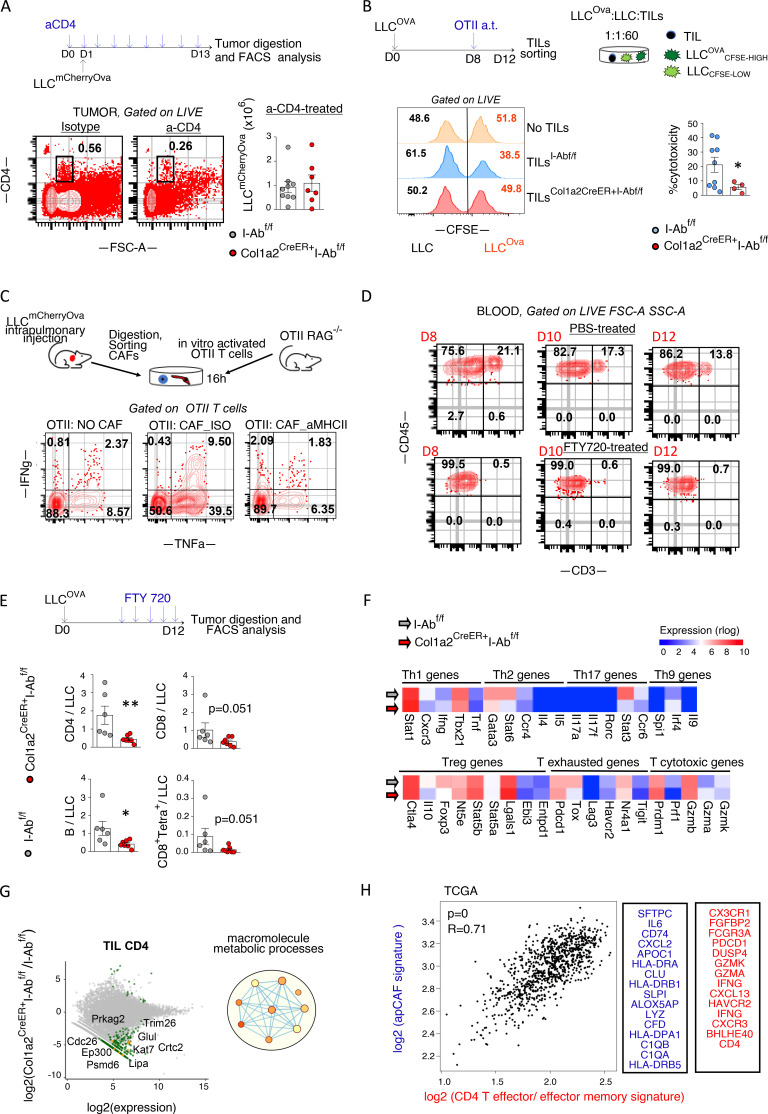
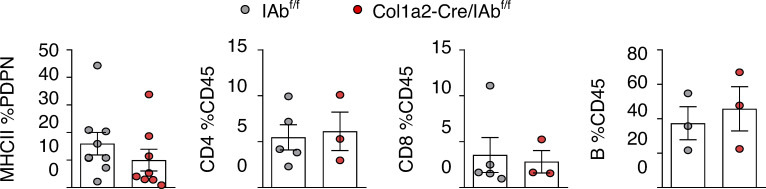
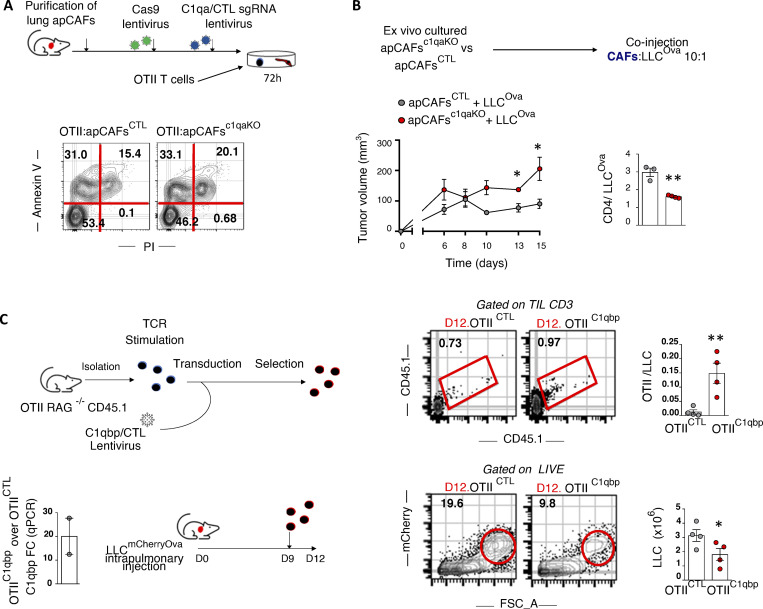
A key unknown of the functional space in tumor immunity is whether CD4 T cells depend on intratumoral MHCII cancer antigen recognition. MHCII-expressing, antigen-presenting cancer-associated fibroblasts (apCAFs) have been found in breast and pancreatic tumors and are considered to be immunosuppressive. This analysis shows that antigen-presenting fibroblasts are frequent in human lung non-small cell carcinomas, where they seem to actively promote rather than suppress MHCII immunity. Lung apCAFs directly activated the TCRs of effector CD4 T cells and at the same time produced C1q, which acted on T cell C1qbp to rescue them from apoptosis. Fibroblast-specific MHCII or C1q deletion impaired CD4 T cell immunity and accelerated tumor growth, while inducing C1qbp in adoptively transferred CD4 T cells expanded their numbers and reduced tumors. Collectively, we have characterized in the lungs a subset of antigen-presenting fibroblasts with tumor-suppressive properties and propose that cancer immunotherapies might be strongly dependent on in situ MHCII antigen presentation.


Conflict of interest statement

Disclosures: The authors declare no competing interests exist.

Figures

None
Graphical abstract
Figure 1.
Figure 1.
MHCII fibroblasts form CD4 T cell priming spots within human lung tumors. (A) Representative FACS plots of a digested human lung tumor. t-SNE plot illustrates all lineage cells and was run using expression of all mesenchymal-specific markers of a representative patient as input. Each dot represents a single cell. Cumulative data (n = 5–9 patients). (B) Representative whole-slide imaging for pan-MHCII, FAP, CD45, and CD4 and cellular spatial relationship map from a lung cancer patient. Samples were analyzed by confocal microscopy with a 20× objective. Bars, 200 µm. After acquiring XY coordinates, XY location of MHCII+FAP+CD45 and MHCII+FAPCD45+ cells was overlaid with CD4 cell density contour. Cell density of MHCII+FAP+CD45 and MHCII+FAPCD45+ cells calculated as average distance to nearest neighbor. Distance between MHCII+FAP+CD45 or MHCII+FAPCD45+ and the closest CD4 cell. Co-localization of MHCII+FAP+CD45 and CD4+ cells, depicted as positive correlation between shortest distance of MHCII+FAP+CD45 to CD4+ with average distance of MHCII+FAP+CD45 to nearest neighbor MHCII+FAP+CD45 (representative of n = 3 patients). (C) FACS plots showing MHCII in FSC-AHighLinFAP+PDGFRa+ fibroblasts of paired digested human lung tumors and tumor-free lungs (n = 7 patients). (D) CD4 T cells and fibroblasts were sorted from the same tumor fragment and co-cultured with pan-MHCII blocking antibody or isotype (ISO) control. Representative FACS plots and cumulative data on phospho-mTOR (pmTOR) and CD44 (n = 4 patients). (B–D) *, P < 0.05; **, P < 0.01; ****, P < 0.0001. aMHCII, pan-MHCII blocking antibody; FMO, fluorescence minus one; MFI, mean fluorescence intensity. Error bars, mean ± SEM; two-tailed unpaired or paired t test.
Figure S1.
Figure S1.
Human MHCII CAF-tumor infiltrating CD4 T cell co-cultures. (A) Gating strategy for sorting untouched CD4 T cells and CAFs from the same tumor fragment. CAFs are sorted as live FSC-AhighLinCD45FAP+ and untouched CD4 T cells as FSC-AlowLinCD45+. (B) Purified CD4 T cells and FSC-AhighLinCD45FAP+MHCII CAFs were co-cultured with panMHCII-blocking antibody or isotype (ISO) control. Representative FACS plots and cumulative data on phospho-mTOR (pmTOR) and CD44 (n = 5 patients). *, P < 0.05; **, P < 0.01. Error bars, mean ± SEM; two-tailed paired t test. aMHCII, pan-MHCII blocking antibody; FSC-A, forward scatter-A; MFI, mean fluorescence intensity; SSC-A, side scatter-A.
Figure 2.
Figure 2.
MHCII expression in fibroblasts is IFN-γ dependent. (A–D) LLC/CULA lung adenocarcinoma cells or B16F10 melanoma cells were injected in the left lung lobe of syngeneic mice or through the tail vein, respectively. (A) Representative FACS plots of a digested mouse CULA lung tumor and expression of mesenchymal-specific genes. Immunofluorescence for IAb (MHCII) and Podoplanin identifies MHCII fibroblasts. Samples were analyzed by confocal microscopy with a 40× objective. Bars, 50 µm. (B) Top: Representative FACS plots of IAb in FSC-AHighLinPodoplanin+PDGFRa+ fibroblasts of a CULA lung tumor and a healthy lung of wild-type C57BL/6 mice. Bottom left: Cumulative data on IAb expression of LLC, CULA, and B16F10 lung tumors and healthy lungs of wild-type C57BL/6 mice (n = 6–8 per group). Bottom right: Cumulative data on IAb expression of LLC lung tumors of cytokine-deficient mice (n = 4–7 per group). (C) FSC-AHighLinPodoplanin+PDGFRa+ fibroblasts were isolated from pooled LLC lung tumors and cultured in 3D, as indicated (n = 4 experiments). FSC-A, forward scatter-A; ISO, isotype control; Lung_homo, lung homogenate; Tumor_homo, tumor homogenate. (B and C) *, P < 0.05; **, P < 0.01. Error bars, mean ± SEM; two-tailed unpaired or paired t test.
Figure 3.
Figure 3.
MHCII fibroblasts closely relate to alveolar epithelial cells across mice and humans. (A) Fibroblast and DC scRNAseq datasets from lung tumors and adjacent lungs (E-MTAB-6149, -6653) were extracted and reclustered based only on MHCII genes to identify MHCII fibroblasts (fibros; n = 3 patients). (B) Heatmap of differentially expressed genes (adj. P values < 0.05) between MHCII+ and MHCII fibroblasts. GO enrichment analysis was performed using DAVID. Network visualization was conducted by Cytoscape's EnrichmentMap. Nodes represent GO biological processes, and edges connect functional terms with overlapping genes. Clusters of related nodes are circled and given labels reflecting broad biological processes. GO terms with an FDR < 0.1 are shown. (C) Multidimensional scaling representation of bulk RNAseq data of sorted MHCII+ and MHCII fibroblasts from pooled mouse LLC lung tumors (n = 3 experiments). Differential expression between MHCII+ and MHCII fibroblasts. Deregulated genes with adj. P values < 0.05 are indicated. (D) GO enrichment analysis using up-regulated genes with |Log2FC| > 3 as input. (E) GSEA enrichment plots for alveolar epithelial gene sets. (F) Murine ATII cells were FACS sorted from healthy lungs and exposed ex vivo to tumor homogenate (TUMOR_HOMO). Expression of EMT genes was quantified by qPCR (n = 2 or 3, pooled from two experiments). (G) Homology analysis of gene expression across mouse and human MHCII fibroblasts. Tumor-homo, Tumor homogenate. (F) **, P < 0.01; ****, P < 0.0001. Error bars, mean ± SEM; two-tailed unpaired t test. LPS, lipopolysaccharides; Ag, antigen; NES, negative normalized enrichment score.
Figure S2.
Figure S2.
Lung CAF specificity of the Col1a2-CreER, ColVI-Cre, and Twist2-Cre mouse strains. (A and B) LLC cells were implanted intrapulmonary in the left lung lobe of tamoxiphen-treated Col1a2-CreER/mTmG (Col1a2), ColVI-Cre/mTmG (ColVI), and Twist2-Cre/mTmG mice (Twist) mice. Lung tumors were digested and subjected to FACS analyses. (A) Expression of hematopoietic- (CD45), endothelial- (CD31), and epithelial- (EpCAM) specific markers by lung GFP cells. (B) Twist2 expression of the fibroblast-specific marker Podoplanin and of IAb (MHCII) (n = 2 per group, from two independent experiments). FMO, fluorescence minus one.
Figure 4.
Figure 4.
Lung apCAFs restrict tumor growth via MHCII. (A) Top: Col1a2 CreER+I-Abfl/fl and I-Abfl/fl mice were inoculated with LLCmcherryOva or LLCzsGreen. Representative FACS plots of LinIAb+ and CD8+tetramer+ cells (gated as tetramer-APC+tetramer-PE+) in digested tumors. Cumulative data of tumor burden and intratumoral immune profiles (n = 3–7 per group, pooled from two experiments). Immune cell number was normalized to cancer cell number. Numbers of cancer cells (tumor burden) and immune cells were assessed by FACS using counting beads. Bottom: Representative immunofluorescence for CD4 and LLCzsGreen cells. Cell density of CD4+ T cells in tumors of Col1a2 CreER+I-Abfl/fl versus I-Abfl/fl mice (cells per 25 × 104 μm2 regions in whole-slide images). Shortest distance between CD4 and LLCzsGreen cells in tumors of Col1a2 CreER+I-Abfl/fl versus I-Abfl/fl mice (n = 2 or 3 mice per group). Samples were analyzed by confocal microscopy with a 20× objective. Bars, 50 µm. (B) Survival curves (representative of two experiments). (C) Left: Experimental scheme and immunofluorescence of subcutaneous tumors after cotransplantation of LLC cells plus zsGreen-expressing MHCII+ versus MHCII CAFs into syngeneic mice. Samples were analyzed by confocal microscopy with a 20× objective. Bars, 50 µm. Right: Tumor growth after subcutaneous cotransplantation of luciferase-expressing KPM cells plus MHCII+ versus MHCII CAFs in syngeneic mice (n = 5 mice per group). (D) Top: Tumor growth after subcutaneous cotransplantation of LLCmcherryOva cells plus lung tumor–derived MHCII+ versus MHCII CAFs in syngeneic mice (C57BL/6; n = 6 mice per group, representative of two experiments). Bottom: Tumor growth after subcutaneous cotransplantation of 4T1 cells plus breast tumor–derived MHCII+ versus MHCII CAFs in syngeneic mice (BALB/c; n = 8 mice per group, pooled from two experiments). (A–D) *, P < 0.05; **, P < 0.01; ****, P < 0.0001. Error bars, mean ± SEM; two-tailed Mann-Whitney U test.
Figure S3.
Figure S3.
Lysosomal processes of MHCII-deleted apCAFs. Purified apCAFs from I-Ab-fl/fl mice were expanded and transduced with CREmcherry or control (CTL) lentiviruses. To induce MHCII, apCAFs were exposed for 72 h in 3D conditions to 30% tumor homogenate (Tumor_Homo). Left: Representative FACS plots of MHCII. Lysosomes were tracked (LysoTracker), and lysosomal proteolysis was assessed (DQ Green BSA) with FACS. Right: Representative FACS plots. FSC-A, forward scatter-A; FMO, fluorescence minus one.
Figure 5.
Figure 5.
Lung anti-tumor CD4 T cell responses depend on apCAF MHCII. (A) Col1a2 CreER+I-Abfl/fl and I-Abfl/fl mice were inoculated with LLCOva and treated with CD4 T cell–depleting antibody. Cumulative data of tumor burden (n = 3–6 per group, pooled from two experiments). Absolute numbers of tumor cells were assessed by FACS using counting beads. (B) Col1a2 CreER+I-Abfl/fl versus I-Abfl/fl mice bearing LLCOva lung tumors were adoptively (a.t.) transferred with OTII T cells. TILs were FACS sorted and incubated with CFSE-loaded LLCOva (CSFEhigh = 5 μM CFSE) plus LLC (CSFElow = 0.5 μM CFSE) cells at a 60:1:1 ratio. Cytotoxicity was determined at 16 h by quantifying the ratio of LLCOva to LLC (n = 2–5 per group, pooled from two experiments). Representative and cumulative FACS data are shown. (C) CAFs from LLCOva lung tumor–bearing mice were sorted and co-cultured with OTII T cells from OTII RAG−/− mice at a 1:1 ratio plus MHCII-blocking antibody or isotype (ISO) control. Representative FACS plots of intracellular cytokines (n = 2 or 3 per group, representative of two experiments). (D) Depletion of circulating T cells upon FTY720 treatment. Representative FACS plots. (E) Lung tumor Col1a2 CreER+I-Abfl/fl versus I-Abfl/fl mice were treated with FTY720. Lung tumors were excised and analyzed by FACS (n = 6 or 7 per group, pooled from two experiments). (F and G) Intratumoral lung CD4 T cells were purified from Col1a2 CreER+I-Abfl/fl versus I-Abfl/fl mice (n = 7) and analyzed by bulk RNAseq. Expression heatmaps (mean values) of marker genes (F). MA (M [log ratio] and A [mean average]) plots and GO term enrichment analysis, with nodes in the networks representing biological processes and edges connecting terms with overlapping genes (G). Adj. P values > 0.05, except from: Stat6 0.0042, Stat3:0.0053 (F). Deregulated genes with FDR < 0.01 and GO terms with an FDR < 0.1 are shown (G). (H) Left: Pearson correlation analysis between CD4 effector/effector memory T cell and apCAF signature genes in patients with lung adenocarcinoma and squamous cell carcinoma in The Cancer Genome Atlas [TCGA], GEPIA2). Right: Input gene lists. (A, B, and E) *, P < 0.05; **, P < 0.01. Error bars, mean ± SEM; two-tailed Mann-Whitney U test. aMHCII, pan-MHCII blocking antibody; FSC-A, forward scatter-A; SSC-A, side scatter-A.
Figure S4.
Figure S4.
FACS analysis of tumor-draining LNs of the Col1a2-CreER strain. LLC cells were implanted intrapulmonary in the left lung lobe of Col1a2-CreER+I-Abfl/fl and I-Abfl/fl mice. After 14 d, mesothoracic/tumor-draining LNs were digested and analyzed by FACS. From left to right: MHCII expression in CD45CD31EpCAMPodoplanin+. Frequencies of CD4+, CD8+ T cells, and B220+ B cells. n = 3–5 per group, pulled from two independent experiments. Error bars, mean ± SEM.
Figure 6.
Figure 6.
Exogenous C1q is anti-apoptotic, and human apCAF C1q increases viability of intratumoral CD4 T cells. (A) Immunofluorescence for C1qbp shows surface expression in human intratumoral CD4 T cells. Samples were analyzed by confocal microscopy with a 40× objective. Bars, 40 µm. MHCII+ CAFs, MHCII CAFs, and intratumoral CD4+ T cells were FACS sorted from human lung tumors and analyzed for C1q by qPCR (n = 4 patients). Pt, patient. (B) CD4 T cells and CAFs were sorted from the same tumor fragment and co-cultured with aC1qbp-blocking antibody or isotype (ISO) control. Absolute (Abs.) numbers of live T cells were assessed by FACS with counting beads (n = 5 patients). (C) Peripheral blood (PB) CD4 T cells from a healthy donor were sorted and activated with aCD3/aCD2/aCD28 beads before undergoing serum starvation with or without purified C1q. Representative FACS plots of two experiments. (D) As in C, plus aC1qbp-blocking antibody or isotype control. Cumulative data of cell viability measured by Annexin V//dead stain by FACS (n = 6 donors). Representative FACS plots of caspase-3 activity. (E) CD4 T cells, total CAFs, and MHCII CAFs were sorted from the same tumor fragment. T-CAFs were co-cultured with aC1qbp-blocking antibody or isotype control. T cell apoptosis was assessed using Annexin V and PI staining. Representative FACS plots and cumulative data are shown (n = 3 patients). (A–E) *, P < 0.05; ***, P < 0.001; ****, P < 0.0001. Error bars, mean ± SEM; one–tailed unpaired or paired t test. FSC-A, forward scatter-A; PBMC, peripheral blood mononuclear cell.
Figure 7.
Figure 7.
In vivo MHCII tumor immunity depends on apCAF C1q, CD4 T cell C1qbp. (A) C1q was knocked out of primary lung apCAFs via CRISPR-Cas9. MHCII+CAFc1qa KO versus control (CTL) MHCII+CAFs were co-cultured with OTII T cells. Apoptosis was measured by Annexin V/dead staining. Representative FACS plots of two experiments. (B) MHCII+CAFc1qa KO versus control MHCII+CAFs were cotransplanted with LLCmcherryOva cells in syngeneic mice. Tumor growth was measured. Cumulative data of CD4 T cell numbers normalized to cancer cell numbers. Absolute numbers were assessed by FACS with counting beads. (n = 3 or 4 mice per group, pooled from two experiments). (C) C1qbp overexpressing OTII T cells were adoptively transferred in LLCmcherryOva lung tumor–bearing mice. Representative FACS plots of LLCmcherryOva cells and OTII cells in digested lung tumors. Cumulative data (n = 4 per group, pooled from two experiments). (A–C) *, P < 0.05; **, P < 0.01. Error bars, mean ± SEM; two-tailed unpaired t test. FSC-A, forward scatter-A; sgRNA, single-guide RNA.

Comment in

  • Presenting fibroblasts.
    Dart A. Dart A. Nat Rev Cancer. 2022 Apr;22(4):193. doi: 10.1038/s41568-022-00457-2. Nat Rev Cancer. 2022. PMID: 35217766 No abstract available.

References

    1. Ahrends, T., Busselaar J., Severson T.M., Bąbała N., de Vries E., Bovens A., Wessels L., van Leeuwen F., and Borst J.. 2019. CD4+ T cell help creates memory CD8+ T cells with innate and help-independent recall capacities. Nat. Commun. 10:5531. 10.1038/s41467-019-13438-1 - DOI - PMC - PubMed
    1. Alspach, E., Lussier D.M., Miceli A.P., Kizhvatov I., DuPage M., Luoma A.M., Meng W., Lichti C.F., Esaulova E., Vomund A.N., et al. . 2019. MHC-II neoantigens shape tumour immunity and response to immunotherapy. Nature. 574:696–701. 10.1038/s41586-019-1671-8 - DOI - PMC - PubMed
    1. Armaka, M., Apostolaki M., Jacques P., Kontoyiannis D.L., Elewaut D., and Kollias G.. 2008. Mesenchymal cell targeting by TNF as a common pathogenic principle in chronic inflammatory joint and intestinal diseases. J. Exp. Med. 205:331–337. 10.1084/jem.20070906 - DOI - PMC - PubMed
    1. Barkauskas, C.E., Cronce M.J., Rackley C.R., Bowie E.J., Keene D.R., Stripp B.R., Randell S.H., Noble P.W., and Hogan B.L.. 2013. Type 2 alveolar cells are stem cells in adult lung. J. Clin. Invest. 123:3025–3036. 10.1172/JCI68782 - DOI - PMC - PubMed
    1. Becht, E., McInnes L., Healy J., Dutertre C.-A., Kwok I.W.H., Ng L.G., Ginhoux F., and Newell E.W.. 2019. Dimensionality reduction for visualizing single-cell data using UMAP. Nat. Biotechnol. 37:38–44. 10.1038/nbt.4314 - DOI - PubMed

Publication types

MeSH terms