

A Stanford Conference on Social Media, Ethics, and COVID-19 Misinformation (INFODEMIC): Qualitative Thematic Analysis
- PMID: 35030089
- PMCID: PMC8849255
- DOI: 10.2196/35707
A Stanford Conference on Social Media, Ethics, and COVID-19 Misinformation (INFODEMIC): Qualitative Thematic Analysis
Abstract
Background: The COVID-19 pandemic continues to challenge the world's population, with approximately 266 million cases and 5 million deaths to date. COVID-19 misinformation and disinformation led to vaccine hesitancy among the public, particularly in vulnerable communities, which persists today. Social media companies are attempting to curb the ongoing spread of an overwhelming amount of COVID-19 misinformation on their platforms. In response to this problem, the authors hosted INFODEMIC: A Stanford Conference on Social Media and COVID-19 Misinformation (INFODEMIC) to develop best practices for social media companies to mitigate online misinformation and disinformation.
Objective: The primary aim of this study was to develop recommendations for social media companies to address the COVID-19 infodemic. We report the methods used to execute the INFODEMIC conference, conference attendee engagement and analytics, and a qualitative thematic analysis of the conference presentations. The primary study outcomes were the identified themes and corresponding recommendations.
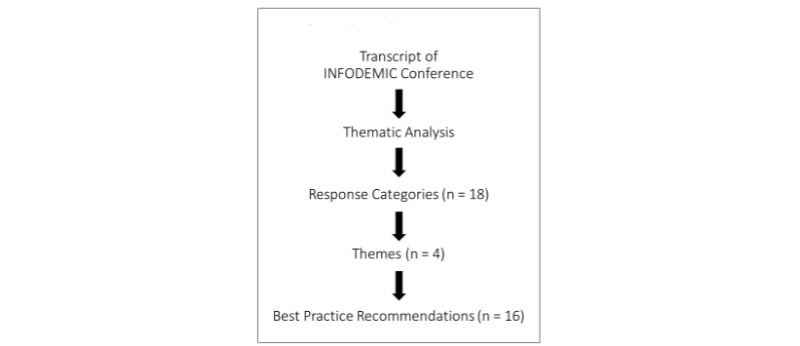
Methods: Using a constructivist paradigm, we conducted a thematic analysis of the 6-hour conference transcript to develop best practice recommendations. The INFODEMIC conference was the study intervention, the conference speakers were the study participants, and transcripts of their presentations were the data for this study. We followed the 6-step framework for thematic analysis described by Braun and Clarke. We also used descriptive statistics to report measures of conference engagement including registrations, viewership, post-conference asynchronous participation, and conference evaluations.
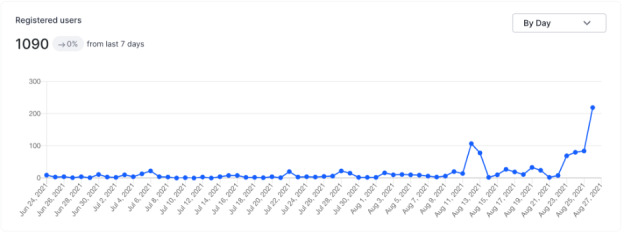
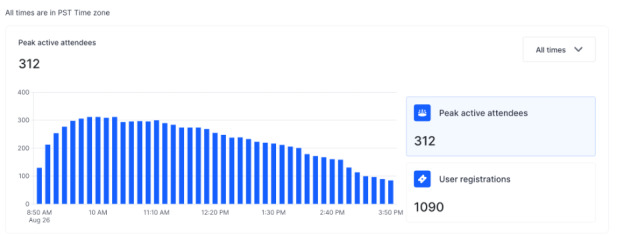
Results: A total of 26 participants spoke at the virtual conference and represented a wide array of occupations, expertise, and countries of origin. From their remarks, we identified 18 response categories and 4 themes: trust, equity, social media practices, and interorganizational partnerships. From these, a total of 16 best practice recommendations were formulated for social media companies, health care organizations, and the general public. These recommendations focused on rebuilding trust in science and medicine among certain communities, redesigning social media platforms and algorithms to reduce the spread of misinformation, improving partnerships between key stakeholders, and educating the public to critically analyze online information. Of the 1090 conference registrants, 587 (53.9%) attended the live conference, and another 9996 individuals viewed or listened to the conference recordings asynchronously. Conference evaluations averaged 8.9 (best=10).
Conclusions: Social media companies play a significant role in the COVID-19 infodemic and should adopt evidence-based measures to mitigate misinformation on their platforms.
Keywords: COVID-19; disinformation; infodemic; misinformation; qualitative; social media; thematic analysis; vaccine.
©Michael A Gisondi, Daniel Chambers, Tatum Minh La, Alexa Ryan, Adyant Shankar, Athena Xue, Rachel Anne Barber. Originally published in the Journal of Medical Internet Research (https://www.jmir.org), 15.02.2022.
Conflict of interest statement
Conflicts of Interest: None declared.
Figures
References
-
- COVID-19 Dashboard. Johns Hopkins Coronavirus Research Center. [2021-12-01]. https://coronavirus.jhu.edu/map.html .
-
- Average number of daily deaths in the United States among the leading causes of death from March 2020 to November 2021. Statista. 2021. Dec, [2022-01-30]. https://www.statista.com/statistics/1254560/leading-causes-of-death-in-t...
-
- COVID Data Tracker. Centers for Disease Control and Prevention. [2022-01-30]. https://covid.cdc.gov/covid-data-tracker/#datatracker-home .
-
- Ortaliza J, Orgera K, Amin K, Cox C. COVID-19 preventable mortality and leading cause of death ranking. Peterson Center on Healthcare and Kaiser Family Foundation. 2021. Dec 10, [2022-01-30]. https://www.healthsystemtracker.org/brief/covid19-and-other-leading-caus...
-
- Healy M. CDC shifts pandemic goals away from reaching herd immunity. Los Angeles Times. 2021. Nov 12, [2022-01-30]. https://www.latimes.com/science/story/2021-11-12/cdc-shifts-pandemic-goa... .
MeSH terms
LinkOut - more resources
Full Text Sources
Medical
