

The Compressed Sensing MP2RAGE as a Surrogate to the MPRAGE for Neuroimaging at 3 T
- PMID: 35030106
- PMCID: PMC9390231
- DOI: 10.1097/RLI.0000000000000849
The Compressed Sensing MP2RAGE as a Surrogate to the MPRAGE for Neuroimaging at 3 T
Abstract
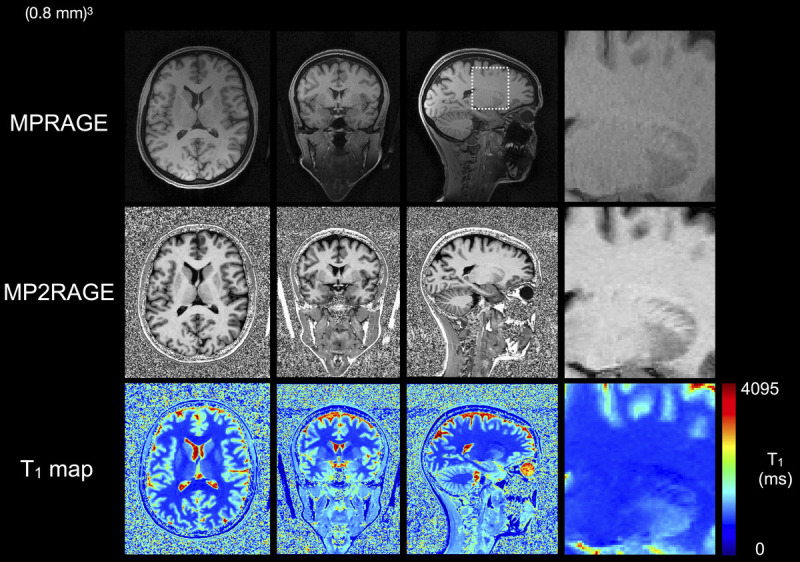
Objectives: The magnetization-prepared 2 rapid acquisition gradient echo (MP2RAGE) sequence provides quantitative T1 maps in addition to high-contrast morphological images. Advanced acceleration techniques such as compressed sensing (CS) allow its acquisition time to be compatible with clinical applications. To consider its routine use in future neuroimaging protocols, the repeatability of the segmented brain structures was evaluated and compared with the standard morphological sequence (magnetization-prepared rapid gradient echo [MPRAGE]). The repeatability of the T1 measurements was also assessed.
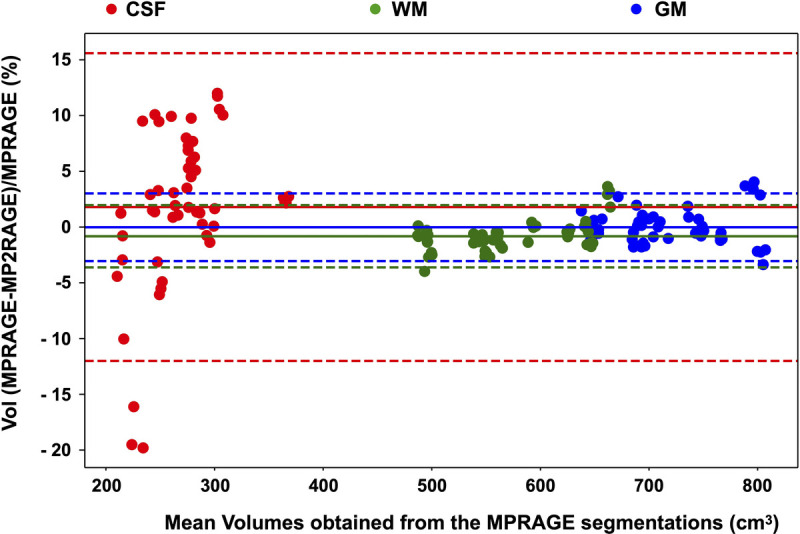
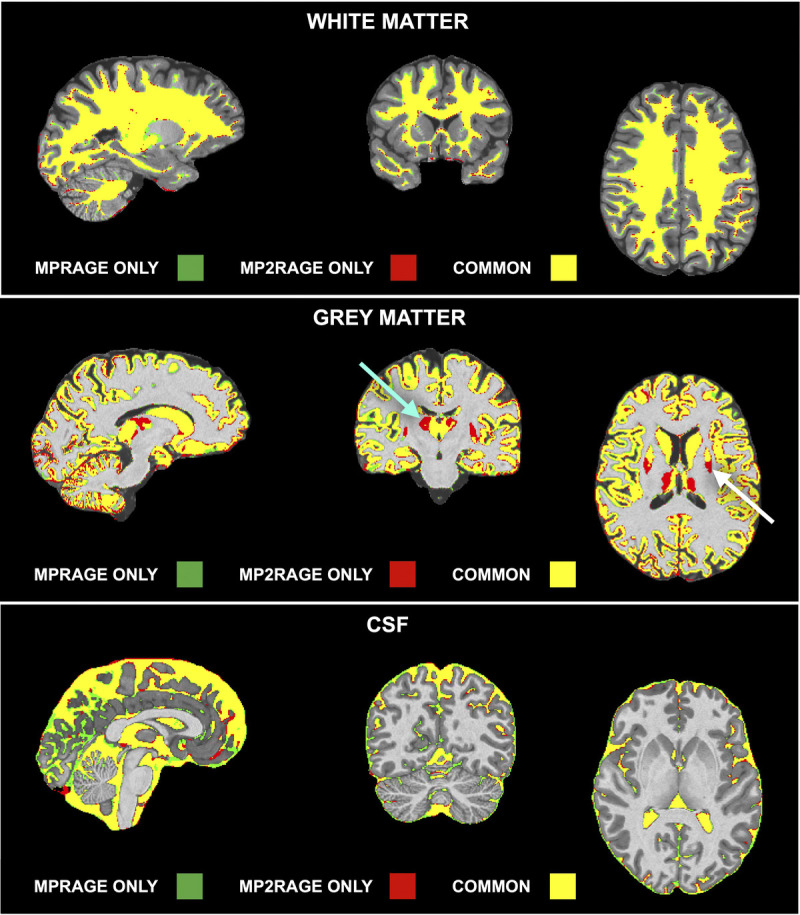
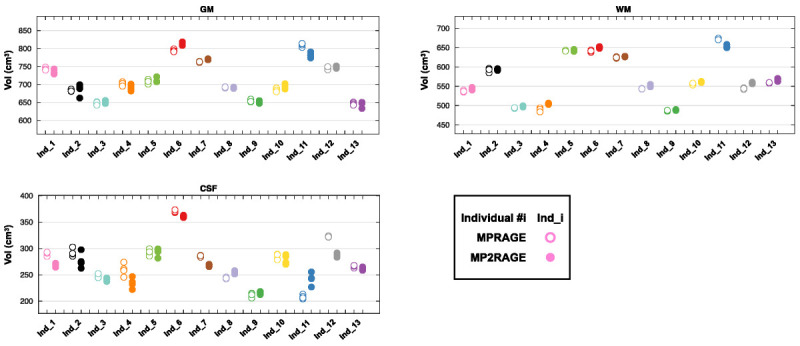
Materials and methods: Thirteen healthy volunteers were scanned either 3 or 4 times at several days of interval, on a 3 T clinical scanner, with the 2 sequences (CS-MP2RAGE and MPRAGE), set with the same spatial resolution (0.8-mm isotropic) and scan duration (6 minutes 21 seconds). The reconstruction time of the CS-MP2RAGE outputs (including the 2 echo images, the MP2RAGE image, and the T1 map) was 3 minutes 33 seconds, using an open-source in-house algorithm implemented in the Gadgetron framework.Both precision and variability of volume measurements obtained from CAT12 and VolBrain were assessed. The T1 accuracy and repeatability were measured on phantoms and on humans and were compared with literature.Volumes obtained from the CS-MP2RAGE and the MPRAGE images were compared using Student t tests (P < 0.05 was considered significant).
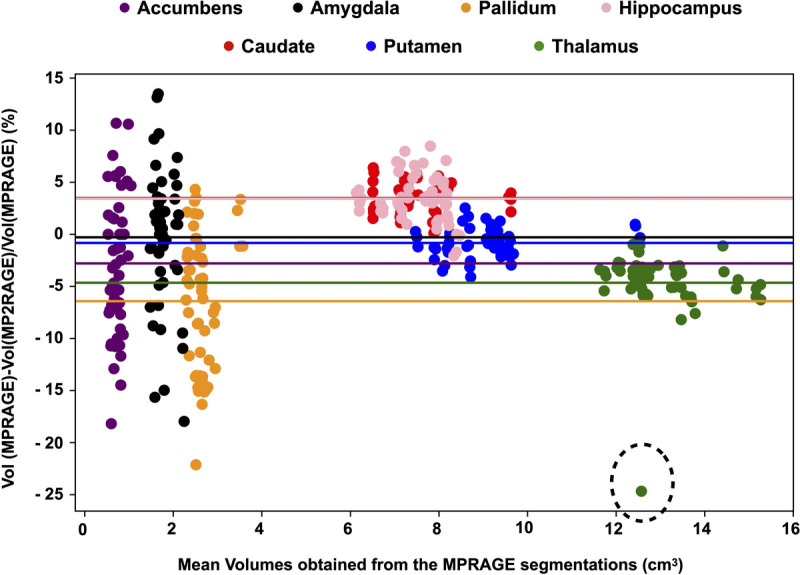
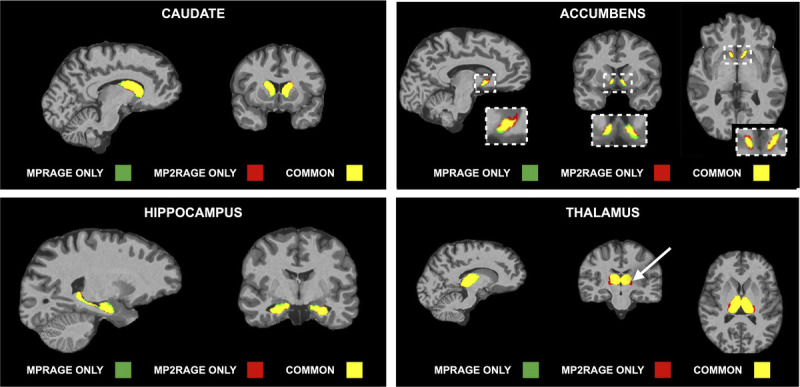
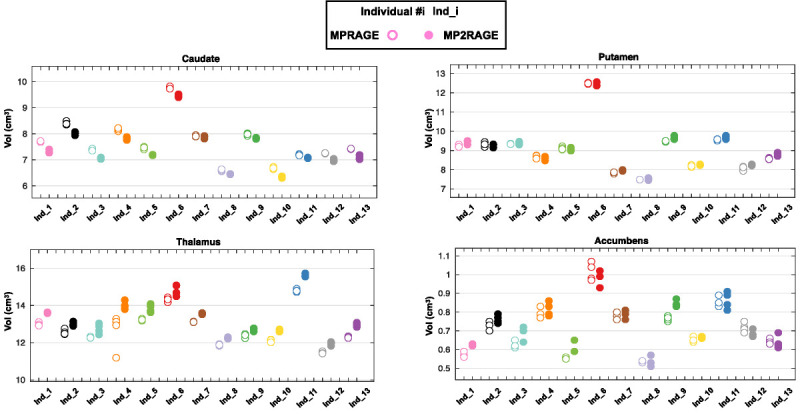
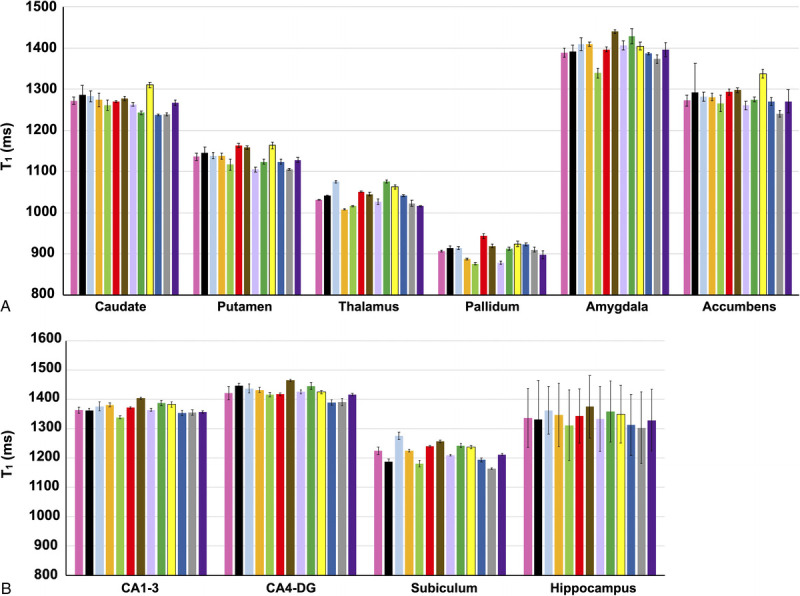
Results: The CS-MP2RAGE acquisition provided morphological images of the same quality and higher contrasts than the standard MPRAGE images. Similar intravolunteer variabilities were obtained with the CS-MP2RAGE and the MPRAGE segmentations. In addition, high-resolution T1 maps were obtained from the CS-MP2RAGE. T1 times of white and gray matters and several deep gray nuclei are consistent with the literature and show very low variability (<1%).
Conclusions: The CS-MP2RAGE can be used in future protocols to rapidly obtain morphological images and quantitative T1 maps in 3-dimensions while maintaining high repeatability in volumetry and relaxation times.
Copyright © 2022 The Author(s). Published by Wolters Kluwer Health, Inc.
Conflict of interest statement
Conflicts of interest and sources of funding: None of the authors have any conflict of interest to declare. This study was achieved within the context of the Laboratory of Excellence TRAIL ANR-10-LABX-57. This work was also supported by the French National Research Agency (ANR-19-CE19-0014).
Figures
Similar articles
-
Compressed sensing (CS) MP2RAGE versus standard MPRAGE: A comparison of derived brain volume measurements.Phys Med. 2022 Nov;103:166-174. doi: 10.1016/j.ejmp.2022.10.023. Epub 2022 Nov 8. Phys Med. 2022. PMID: 36368208
-
MP2RAGE for deep gray matter measurement of the brain: A comparative study with MPRAGE.J Magn Reson Imaging. 2016 Jan;43(1):55-62. doi: 10.1002/jmri.24960. Epub 2015 Jun 1. J Magn Reson Imaging. 2016. PMID: 26032895
-
Fast automatic segmentation of thalamic nuclei from MP2RAGE acquisition at 7 Tesla.Magn Reson Med. 2021 May;85(5):2781-2790. doi: 10.1002/mrm.28608. Epub 2020 Dec 3. Magn Reson Med. 2021. PMID: 33270943
-
Whole brain and deep gray matter structure segmentation: Quantitative comparison between MPRAGE and MP2RAGE sequences.PLoS One. 2021 Aug 6;16(8):e0254597. doi: 10.1371/journal.pone.0254597. eCollection 2021. PLoS One. 2021. PMID: 34358242 Free PMC article.
-
Radiofrequency Bias Correction of Magnetization Prepared Rapid Gradient Echo MRI at 7.0 Tesla Using an External Reference in a Sequential Protocol.Tomography. 2021 Sep 13;7(3):434-451. doi: 10.3390/tomography7030038. Tomography. 2021. PMID: 34564300 Free PMC article.
Cited by
-
Corpus callosum in children with neurodevelopmental delay: MRI standard qualitative assessment versus automatic quantitative analysis.Eur Radiol Exp. 2023 Oct 13;7(1):61. doi: 10.1186/s41747-023-00375-4. Eur Radiol Exp. 2023. PMID: 37833469 Free PMC article.
-
Shortening 7T MP2RAGE acquisition with compressed sensing: Evaluating quantitative accuracy and structural consistency.PLoS One. 2025 Jun 16;20(6):e0325783. doi: 10.1371/journal.pone.0325783. eCollection 2025. PLoS One. 2025. PMID: 40522990 Free PMC article.
-
Simultaneous Optimization of MP2RAGE T1 -weighted (UNI) and FLuid And White matter Suppression (FLAWS) brain images at 7T using Extended Phase Graph (EPG) Simulations.Magn Reson Med. 2023 Mar;89(3):937-950. doi: 10.1002/mrm.29479. Epub 2022 Nov 9. Magn Reson Med. 2023. PMID: 36352772 Free PMC article.
-
Clinical feasibility of CS-VIBE accelerates MRI techniques in diagnosing intracranial metastasis.Sci Rep. 2023 Jun 20;13(1):10012. doi: 10.1038/s41598-023-37148-3. Sci Rep. 2023. PMID: 37340077 Free PMC article.
-
Visualizing the Habenula Using 3T High-Resolution MP2RAGE and QSM: A Preliminary Study.AJNR Am J Neuroradiol. 2024 Apr 8;45(4):504-510. doi: 10.3174/ajnr.A8156. AJNR Am J Neuroradiol. 2024. PMID: 38453416 Free PMC article.
References
-
- Kupeli A Kocak M Goktepeli M, et al. . Role of T1 mapping to evaluate brain aging in a healthy population. Clin Imaging. 2020;59:56–60. - PubMed
MeSH terms
LinkOut - more resources
Full Text Sources
Medical
