. 2022 Apr 1;28(7):1353-1362.
doi: 10.1158/1078-0432.CCR-21-3726.

Cabozantinib plus Nivolumab Phase I Expansion Study in Patients with Metastatic Urothelial Carcinoma Refractory to Immune Checkpoint Inhibitor Therapy

Affiliations

Cabozantinib plus Nivolumab Phase I Expansion Study in Patients with Metastatic Urothelial Carcinoma Refractory to Immune Checkpoint Inhibitor Therapy

Daniel M Girardi et al. Clin Cancer Res. .

Abstract

Purpose: This study investigated the efficacy and tolerability of cabozantinib plus nivolumab (CaboNivo) in patients with metastatic urothelial carcinoma (mUC) that progressed on checkpoint inhibition (CPI).

Patients and methods: A phase I expansion cohort of patients with mUC who received prior CPI was treated with cabozantinib 40 mg/day and nivolumab 3 mg/kg every 2 weeks until disease progression/unacceptable toxicity. The primary goal was objective response rate (ORR) per RECIST v.1.1. Secondary objectives included progression-free survival (PFS), duration of response (DoR), overall survival (OS), safety, and tolerability.

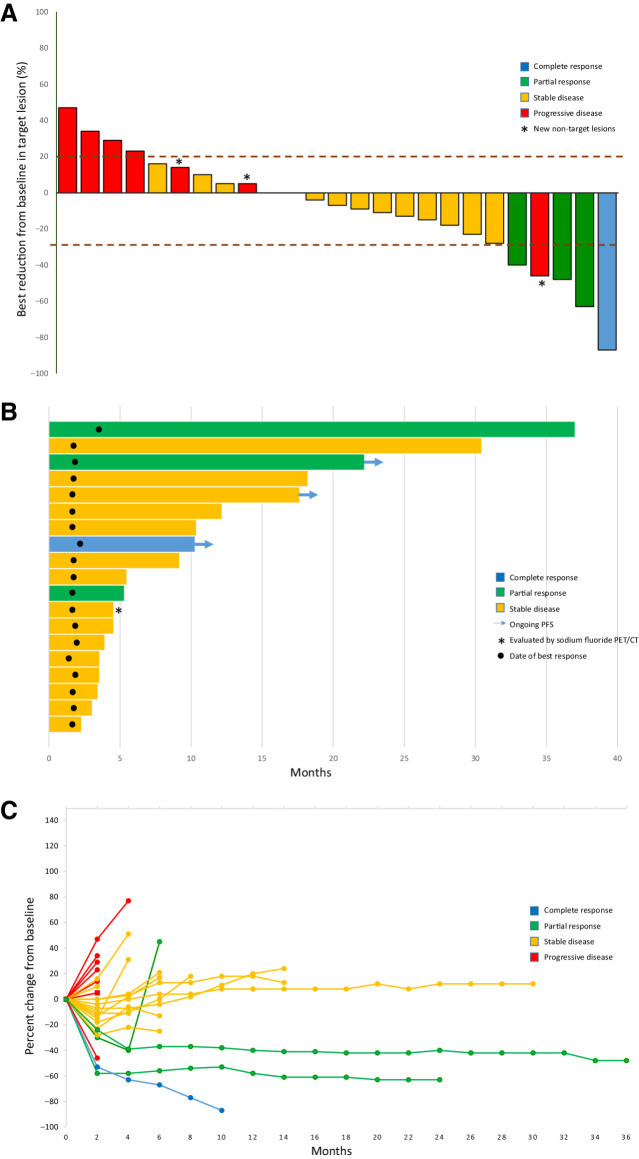
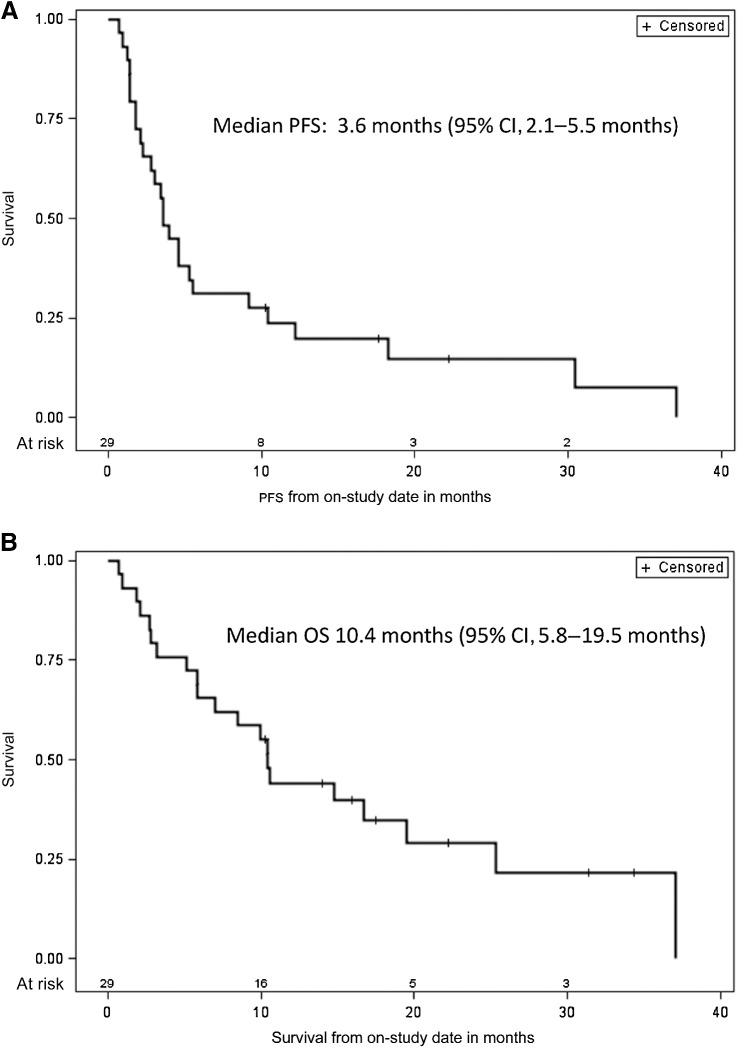
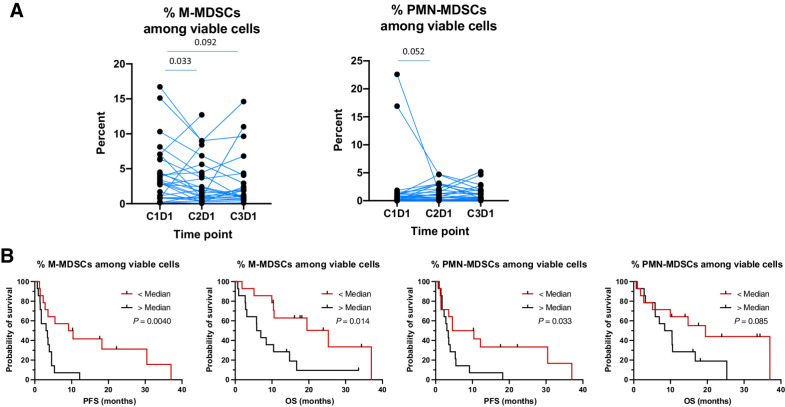
Results: Twenty-nine out of 30 patients enrolled were evaluable for efficacy. Median follow-up was 22.2 months. Most patients (86.7%) received prior chemotherapy and all patients received prior CPI (median seven cycles). ORR was 16.0%, with one complete response and three partial responses (PR). Among 4 responders, 2 were primary refractory, 1 had a PR, and 1 had stable disease on prior CPI. Median DoR was 33.5 months [95% confidence interval (CI), 3.7-33.5], median PFS was 3.6 months (95% CI, 2.1-5.5), and median OS was 10.4 months (95% CI, 5.8-19.5). CaboNivo decreased immunosuppressive subsets such as regulatory T cells (Tregs) and increased potential antitumor immune subsets such as nonclassical monocytes and effector T cells. A lower percentage of monocytic myeloid-derived suppressor cells (M-MDSC) and polymorphonuclear MDSCs, lower CTLA-4 and TIM-3 expression on Tregs, and higher effector CD4+ T cells at baseline were associated with better PFS and/or OS.

Conclusions: CaboNivo was clinically active, well tolerated, and favorably modulated peripheral blood immune subsets in patients with mUC refractory to CPI.

Trial registration: ClinicalTrials.gov NCT03866382 NCT02496208.


Figures

Figure 1. Clinical activity of CaboNivo. A, Plot of confirmed tumor regression from baseline as measured by RECIST in all evaluable patients (n = 25). Upper dotted line represents progression at 20%; lower dotted line represents the RECIST boundary for complete response or partial response at 30%. Red = progressive disease, yellow = stable disease, green = partial response, and blue = complete response. Asterisk represents patients whose scans revealed new nontarget lesions that were considered progression. B, Time to response, duration of treatment, and duration of response to CaboNivo in months for evaluable patients with complete response (blue), partial response (green), and stable disease (yellow; n = 19). Arrows = patients with ongoing response at cutoff date. Circle = date best response was first noted. Asterisk = patient who had no evaluable lesions by RECIST but was considered to have stable disease by sodium fluoride PET/CT. C, Percent change in sum of target lesion diameters from baseline over time for all assessable patients (n = 25), defined as those patients with baseline tumor assessments and at least one post-baseline assessment. Colors represent patients' best response according to RECIST v.1.1. Red = progressive disease as best response, yellow = stable disease, green = partial response, and blue = complete response.
Figure 1.
Clinical activity of CaboNivo. A, Plot of confirmed tumor regression from baseline as measured by RECIST in all evaluable patients (n = 25). Upper dotted line represents progression at 20%; lower dotted line represents the RECIST boundary for complete response or partial response at 30%. Red = progressive disease, yellow = stable disease, green = partial response, and blue = complete response. Asterisk represents patients whose scans revealed new nontarget lesions that were considered progression. B, Time to response, duration of treatment, and duration of response to CaboNivo in months for evaluable patients with complete response (blue), partial response (green), and stable disease (yellow; n = 19). Arrows = patients with ongoing response at cutoff date. Circle = date best response was first noted. Asterisk = patient who had no evaluable lesions by RECIST but was considered to have stable disease by sodium fluoride PET/CT. C, Percent change in sum of target lesion diameters from baseline over time for all assessable patients (n = 25), defined as those patients with baseline tumor assessments and at least one post-baseline assessment. Colors represent patients' best response according to RECIST v.1.1. Red = progressive disease as best response, yellow = stable disease, green = partial response, and blue = complete response.
Figure 2. Kaplan–Meier estimate of overall survival (A) and progression-free survival (B) for overall study population (n = 29). Vertical lines show censored events.
Figure 2.
Kaplan–Meier estimate of overall survival (A) and progression-free survival (B) for overall study population (n = 29). Vertical lines show censored events.
Figure 3. Analysis of monocytic myeloid-derived suppressor cells (M-MDSC) and polymorphonuclear MDSCs (PMN-MDSC). A, Percent decrease of M-MDSCs and PMN-MDSCs with treatment. B, Kaplan–Meier curves of PFS and OS according to the percentage of viable M-MDSCs and PMN-MDSCs at baseline.
Figure 3.
Analysis of monocytic myeloid-derived suppressor cells (M-MDSC) and polymorphonuclear MDSCs (PMN-MDSC). A, Percent decrease of M-MDSCs and PMN-MDSCs with treatment. B, Kaplan–Meier curves of PFS and OS according to the percentage of viable M-MDSCs and PMN-MDSCs at baseline.

References

    1. Siegel RL, Miller KD, Fuchs HE, Jemal A. Cancer statistics, 2021. CA Cancer J Clin 2021;71:7–33. - PubMed
    1. Nadal R, Bellmunt J. Management of metastatic bladder cancer. Cancer Treat Rev 2019;76:10–21. - PubMed
    1. Galsky MD, Arija JA, Bamias A, Davis ID, De Santis M, Kikuchi E, et al. Atezolizumab with or without chemotherapy in metastatic urothelial cancer (IMvigor130): a multicentre, randomised, placebo-controlled phase 3 trial. Lancet 2020;395:1547–57. - PubMed
    1. Powles T, Park SH, Voog E, Caserta C, Valderrama BP, Gurney H, et al. Avelumab maintenance therapy for advanced or metastatic urothelial carcinoma. N Engl J Med 2020;383:1218–30. - PubMed
    1. Loriot Y, Necchi A, Park SH, Garcia-Donas J, Huddart R, Burgess E, et al. Erdafitinib in locally advanced or metastatic urothelial carcinoma. N Engl J Med 2019;381:338–48. - PubMed

Publication types

MeSH terms

Associated data