. 2022 Apr 1;12(4):1070-1087.
doi: 10.1158/2159-8290.CD-21-0808.

A Natural Polyphenol Exerts Antitumor Activity and Circumvents Anti-PD-1 Resistance through Effects on the Gut Microbiota

Affiliations

A Natural Polyphenol Exerts Antitumor Activity and Circumvents Anti-PD-1 Resistance through Effects on the Gut Microbiota

Meriem Messaoudene et al. Cancer Discov. .

Abstract

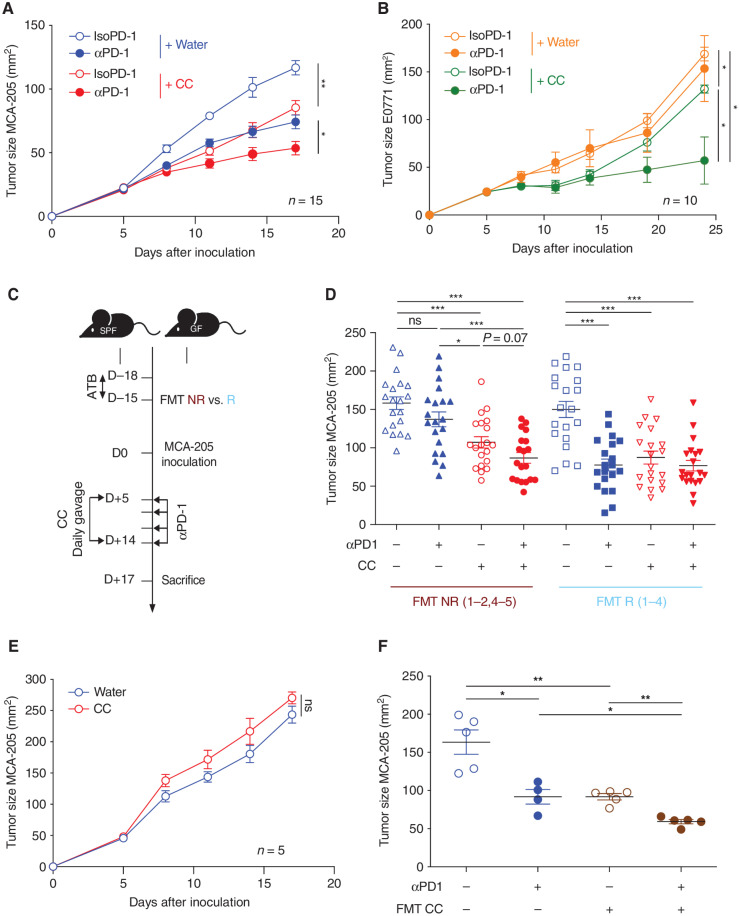
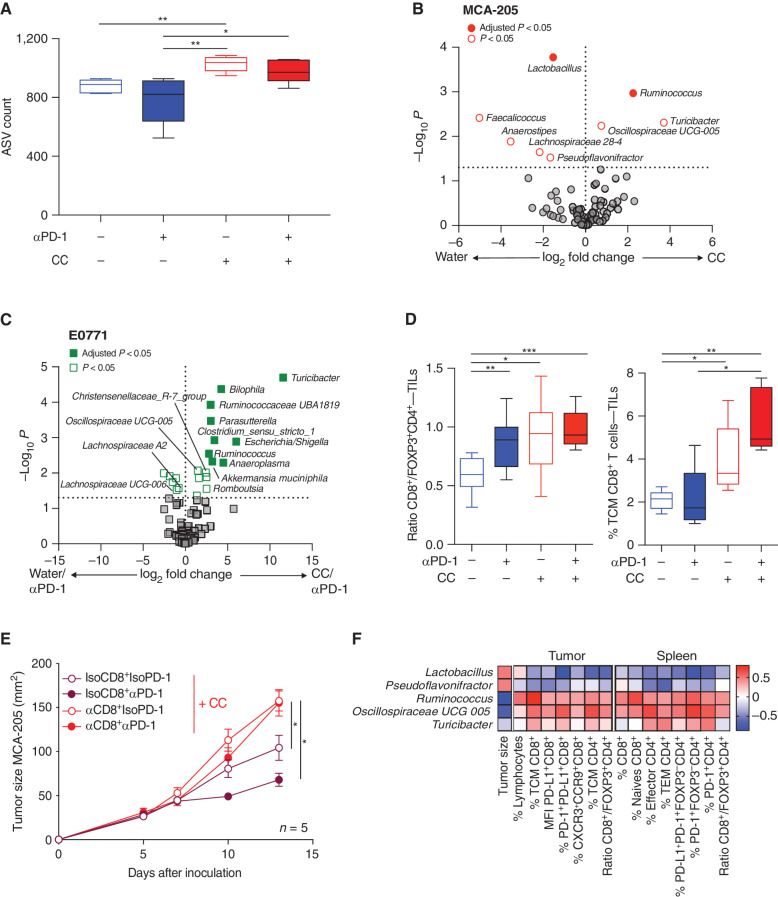
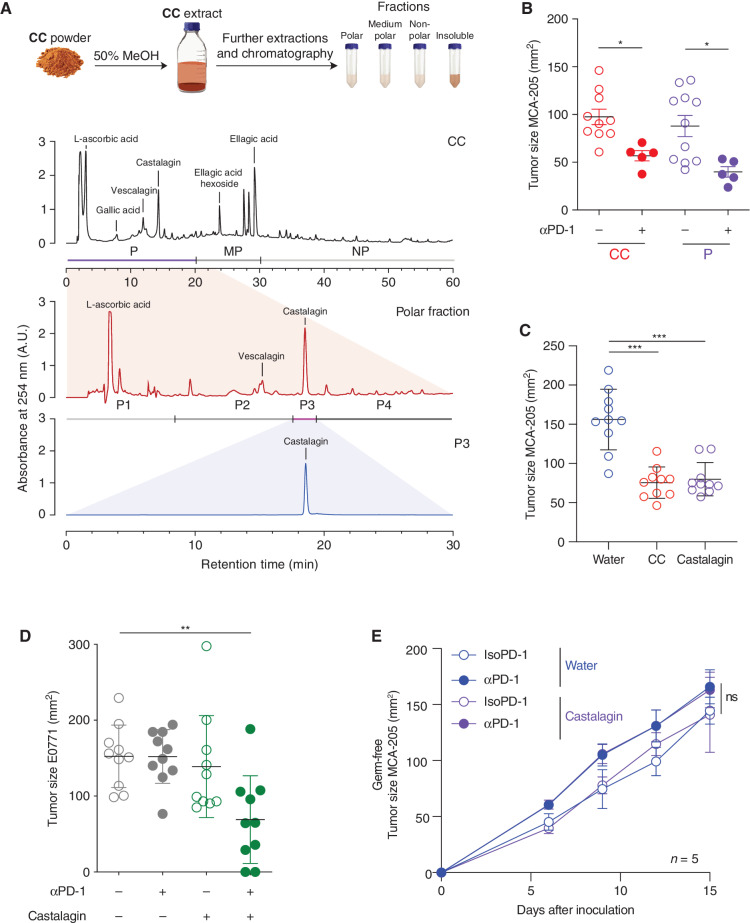
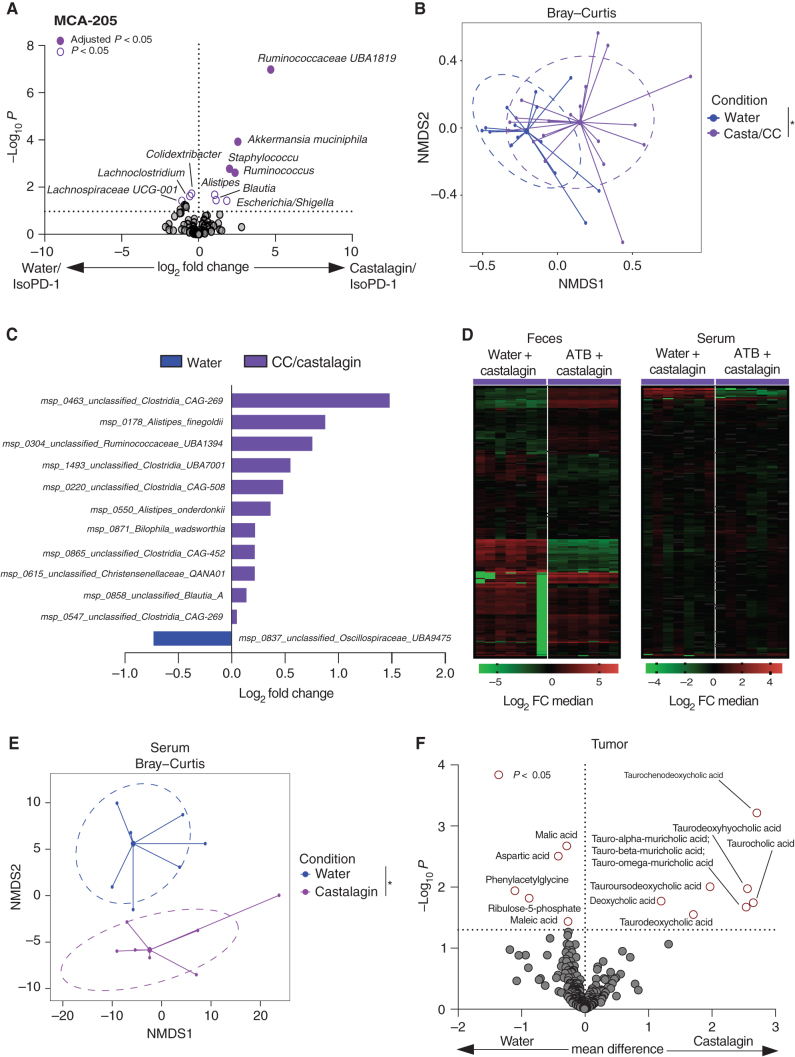
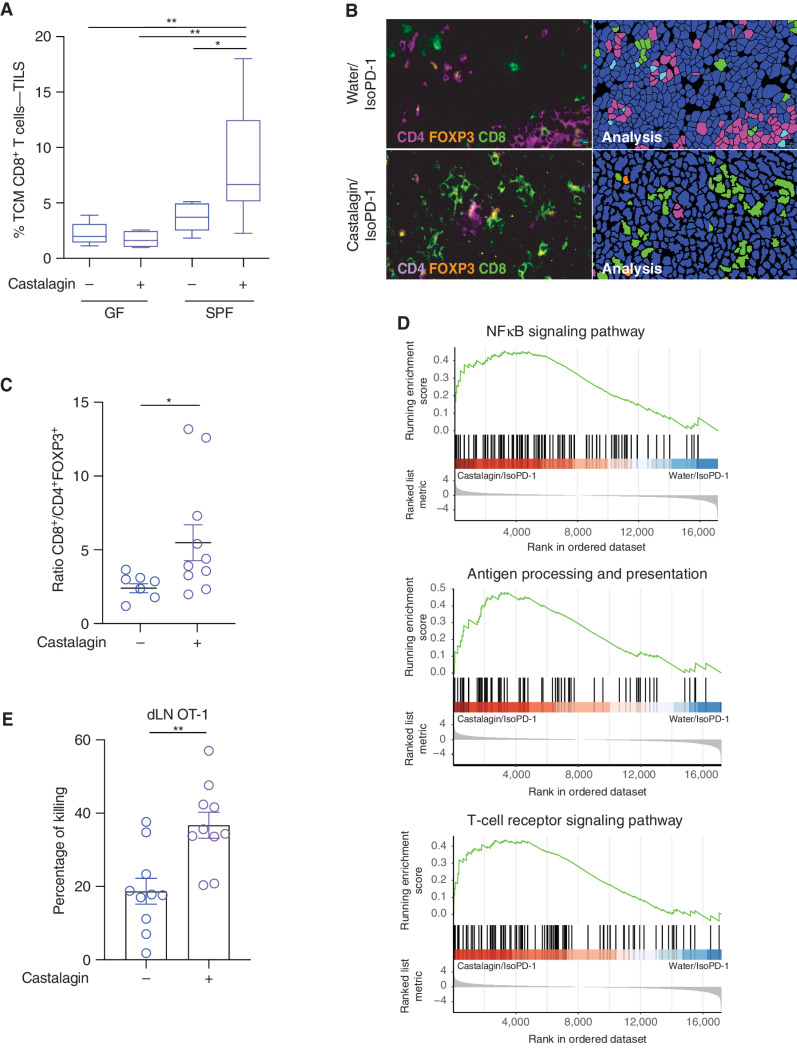
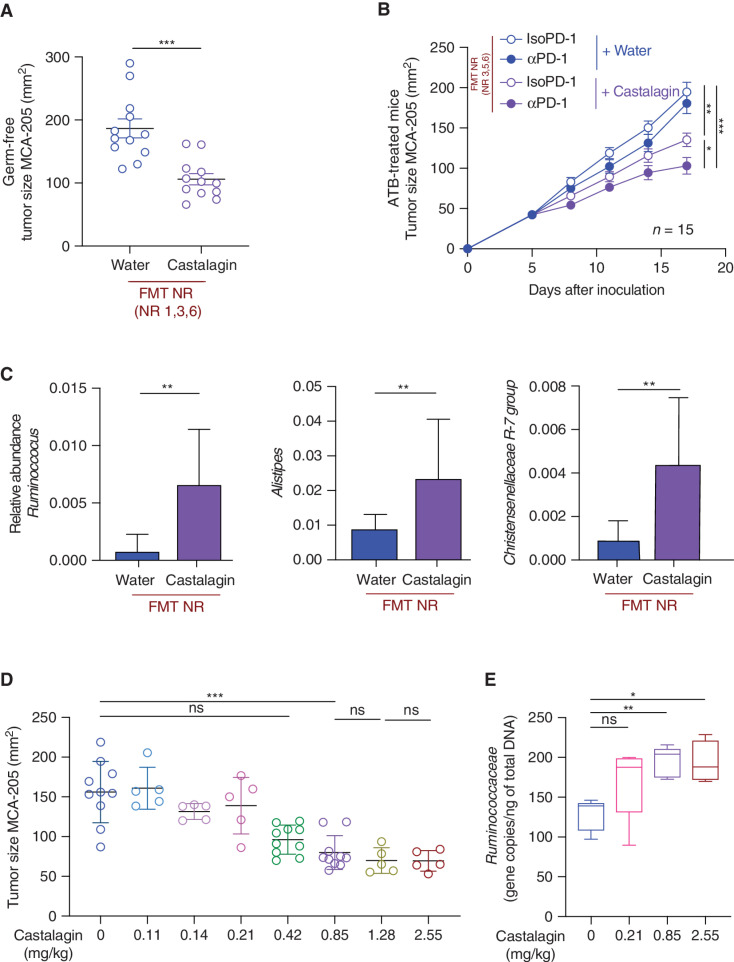
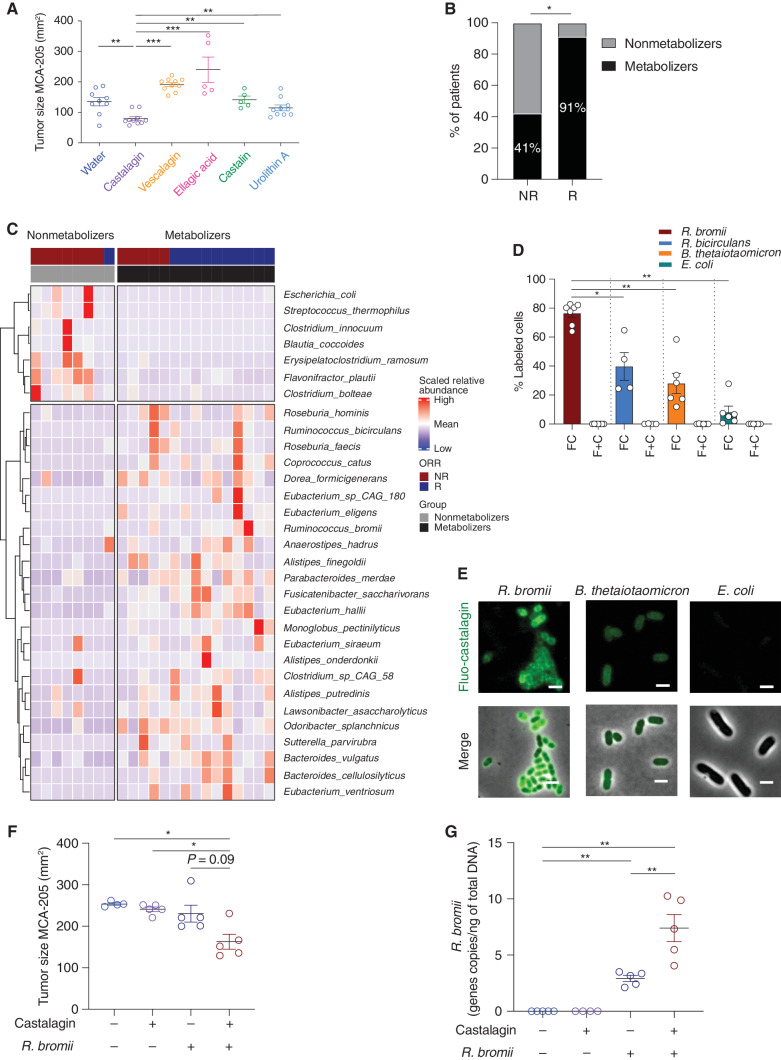
Several approaches to manipulate the gut microbiome for improving the activity of cancer immune-checkpoint inhibitors (ICI) are currently under evaluation. Here, we show that oral supplementation with the polyphenol-rich berry camu-camu (CC; Myrciaria dubia) in mice shifted gut microbial composition, which translated into antitumor activity and a stronger anti-PD-1 response. We identified castalagin, an ellagitannin, as the active compound in CC. Oral administration of castalagin enriched for bacteria associated with efficient immunotherapeutic responses (Ruminococcaceae and Alistipes) and improved the CD8+/FOXP3+CD4+ ratio within the tumor microenvironment. Moreover, castalagin induced metabolic changes, resulting in an increase in taurine-conjugated bile acids. Oral supplementation of castalagin following fecal microbiota transplantation from ICI-refractory patients into mice supported anti-PD-1 activity. Finally, we found that castalagin binds to Ruminococcus bromii and promoted an anticancer response. Altogether, our results identify castalagin as a polyphenol that acts as a prebiotic to circumvent anti-PD-1 resistance.

Significance: The polyphenol castalagin isolated from a berry has an antitumor effect through direct interactions with commensal bacteria, thus reprogramming the tumor microenvironment. In addition, in preclinical ICI-resistant models, castalagin reestablishes the efficacy of anti-PD-1. Together, these results provide a strong biological rationale to test castalagin as part of a clinical trial. This article is highlighted in the In This Issue feature, p. 873.


Figures

Figure 1. CC supplementation is associated with antitumor activity that is microbiome dependent and circumvents the αPD-1 resistance in mice conferred by FMT from NR patients with NSCLC. A and B, Tumor growth kinetics in SPF C57BL/6 mice after sequential injections of αPD-1 or IsoPD-1 and daily oral gavage with CC or water are depicted for (A) MCA-205 sarcoma (n = 15 mice/group) and (B) E0771 breast cancer (n = 10 mice/group). C, Experimental design of avatar mice experiments. FMT from feces samples from NR and R patients with NSCLC were individually performed in GF C57BL/6 mice or after 3 days of ATB in SPF C57BL/6 mice. Two weeks later, MCA-205 tumors were inoculated, and daily gavage with CC or water was performed in combination with sequential injections of αPD-1 or IsoPD-1. D, Pooled analysis of the mean tumor size ± SEM at sacrifice post-FMT from four NR (NR1–2, 4–5) and four R (R1–4) groups for each CC and water group. Each symbol represents one mouse. E, MCA-205 tumor kinetics in mice reared in GF conditions and receiving daily oral gavage with CC or water (n = 5 mice/group). F, Tumor size at sacrifice of mice bearing MCA-205 treated with αPD-1 or IsoPD-1 in combination with daily FMT with mouse feces previously supplemented with CC. Each circle represents one mouse. Means ± SEM are represented in all experiments. ns, nonsignificant; *, P < 0.05; **, P < 0.01; ***, P < 0.001.
Figure 1.
CC supplementation is associated with antitumor activity that is microbiome dependent and circumvents the αPD-1 resistance in mice conferred by FMT from NR patients with NSCLC. A and B, Tumor growth kinetics in SPF C57BL/6 mice after sequential injections of αPD-1 or IsoPD-1 and daily oral gavage with CC or water are depicted for (A) MCA-205 sarcoma (n = 15 mice/group) and (B) E0771 breast cancer (n = 10 mice/group). C, Experimental design of avatar mice experiments. FMT from feces samples from NR and R patients with NSCLC were individually performed in GF C57BL/6 mice or after 3 days of ATB in SPF C57BL/6 mice. Two weeks later, MCA-205 tumors were inoculated, and daily gavage with CC or water was performed in combination with sequential injections of αPD-1 or IsoPD-1. D, Pooled analysis of the mean tumor size ± SEM at sacrifice post-FMT from four NR (NR1–2, 4–5) and four R (R1–4) groups for each CC and water group. Each symbol represents one mouse. E, MCA-205 tumor kinetics in mice reared in GF conditions and receiving daily oral gavage with CC or water (n = 5 mice/group). F, Tumor size at sacrifice of mice bearing MCA-205 treated with αPD-1 or IsoPD-1 in combination with daily FMT with mouse feces previously supplemented with CC. Each circle represents one mouse. Means ± SEM are represented in all experiments. ns, nonsignificant; *, P < 0.05; **, P < 0.01; ***, P < 0.001.
Figure 2. Impact of CC on microbiome composition and association with CD8+ T-cell antitumor activity. A, 16S rRNA analysis of the fecal samples from mice from the four groups in the MCA-205 experiments, and representation of the alpha diversity measured by the amplicon sequence variant (ASV) count in each group. B and C, Volcano plot representation of differential abundance analysis comparing (B) pooled CC vs. water (αPD-1 and IsoPD-1) groups in the MCA-205 model and (C) the water/αPD-1 vs. CC/αPD-1 groups in the E0771 model (n = 10 and 5 mice/group, respectively). Bacteria enriched in each group are represented using adjusted P value (fill shape symbol) and P value (no fill shape symbol; false discovery rate: 0.05). D, Flow cytometry analysis of the ratio of CD8+/FOXP3+CD4+ T cells and CD8+ T central memory (TCM) cell (CD45RB−CD62L+) subpopulations in MCA-205 TILs in the four experimental groups (n = 10 mice/group). E, Effects of anti-CD8 (αCD8) depletion or its isotype control (IsoCD8) on MCA-205 tumor growth kinetics with daily oral gavage of CC (n = 5 mice/group) treated or not with αPD-1 or its isotype control. F, Pairwise Spearman rank correlation heat map between significantly different bacteria enriched in CC/IsoPD-1 vs. water/IsoPD-1 groups with positively correlated TILs or splenocyte cytometry and matching tumor size in the MCA-205 experiment. MFI, mean fluorescence intensity; TEM, T effector memory. *, P < 0.05; **, P < 0.01; ***, P < 0.001.
Figure 2.
Impact of CC on microbiome composition and association with CD8+ T-cell antitumor activity. A, 16S rRNA analysis of the fecal samples from mice from the four groups in the MCA-205 experiments, and representation of the alpha diversity measured by the amplicon sequence variant (ASV) count in each group. B and C, Volcano plot representation of differential abundance analysis comparing (B) pooled CC vs. water (αPD-1 and IsoPD-1) groups in the MCA-205 model and (C) the water/αPD-1 vs. CC/αPD-1 groups in the E0771 model (n = 10 and 5 mice/group, respectively). Bacteria enriched in each group are represented using adjusted P value (fill shape symbol) and P value (no fill shape symbol; false discovery rate: 0.05). D, Flow cytometry analysis of the ratio of CD8+/FOXP3+CD4+ T cells and CD8+ T central memory (TCM) cell (CD45RBCD62L+) subpopulations in MCA-205 TILs in the four experimental groups (n = 10 mice/group). E, Effects of anti-CD8 (αCD8) depletion or its isotype control (IsoCD8) on MCA-205 tumor growth kinetics with daily oral gavage of CC (n = 5 mice/group) treated or not with αPD-1 or its isotype control. F, Pairwise Spearman rank correlation heat map between significantly different bacteria enriched in CC/IsoPD-1 vs. water/IsoPD-1 groups with positively correlated TILs or splenocyte cytometry and matching tumor size in the MCA-205 experiment. MFI, mean fluorescence intensity; TEM, T effector memory. *, P < 0.05; **, P < 0.01; ***, P < 0.001.
Figure 3. Identification of castalagin as the bioactive compound of CC with similar antitumor activity. A, Schematic of the CC fractionation procedure and summary of chromatograms (λ = 254 nm) showing the isolation of bioactive fractions from CC: CC extract (top chromatogram) containing fractions polar (P), medium polar (MP), and nonpolar (NP). Representation of the polar fraction (middle chromatogram) containing subfractions P1–4 and polar subfraction 3 (P3; bottom chromatogram). B, Tumor size at sacrifice of mice bearing MCA-205 treated with daily oral gavage with CC or P fraction (n = 10 mice/group). C, Tumor size at sacrifice in the MCA-205 model after daily oral supplementation with CC, castalagin at the standard concentration (0.85 mg/kg per mouse), or water (n = 10 mice/group). D, Tumor size at sacrifice of E0771-bearing SPF mice after sequential injections of αPD-1 or IsoPD-1 and a daily oral gavage with water or castalagin at the standard concentration (0.85 mg/kg per mouse; n = 10 mice/group). E, MCA-205 tumor kinetics in mice reared under GF conditions treated with sequential injections of αPD-1 or IsoPD-1 and a daily oral gavage with water or castalagin (n = 5 mice/group). Means ± SEM are represented in B–E. ns, nonsignificant; *, P < 0.05; **, P < 0.01; ***, P < 0.001.
Figure 3.
Identification of castalagin as the bioactive compound of CC with similar antitumor activity. A, Schematic of the CC fractionation procedure and summary of chromatograms (λ = 254 nm) showing the isolation of bioactive fractions from CC: CC extract (top chromatogram) containing fractions polar (P), medium polar (MP), and nonpolar (NP). Representation of the polar fraction (middle chromatogram) containing subfractions P1–4 and polar subfraction 3 (P3; bottom chromatogram). B, Tumor size at sacrifice of mice bearing MCA-205 treated with daily oral gavage with CC or P fraction (n = 10 mice/group). C, Tumor size at sacrifice in the MCA-205 model after daily oral supplementation with CC, castalagin at the standard concentration (0.85 mg/kg per mouse), or water (n = 10 mice/group). D, Tumor size at sacrifice of E0771-bearing SPF mice after sequential injections of αPD-1 or IsoPD-1 and a daily oral gavage with water or castalagin at the standard concentration (0.85 mg/kg per mouse; n = 10 mice/group). E, MCA-205 tumor kinetics in mice reared under GF conditions treated with sequential injections of αPD-1 or IsoPD-1 and a daily oral gavage with water or castalagin (n = 5 mice/group). Means ± SEM are represented in B–E. ns, nonsignificant; *, P < 0.05; **, P < 0.01; ***, P < 0.001.
Figure 4. Castalagin influences the microbiome composition and metabolite production. A, Volcano plot representation of differential abundance analysis results after 16S rRNA sequencing analysis of water/IsoPD-1 vs. castalagin/IsoPD-1 groups of the MCA-205 model (n = 10 mice/group). Bacteria enriched in each group are represented using adjusted P value (fill shape symbol) and P value (no fill shape symbol; false discovery rate: 0.05). B, Metagenomics sequencing with representation of species richness in fecal samples from MCA-205 experiment in water (IsoPD-1 and αPD-1) vs. castalagin/CC (IsoPD-1 and αPD-1) groups. Bray–Curtis representation for beta diversity. C, Bar plot representation of differential abundance analysis results after metagenomics sequencing analysis between water (IsoPD-1 and αPD-1) and castalagin/CC (IsoPD-1 and αPD-1) groups. D, Heat map of change in metabolite relative abundance in the feces and serum. Hierarchical clustering (Euclidean distance, Ward linkage method) of the metabolite abundance is shown (n = 7 mice/group). E, Metabolites’ principal coordinate analysis between water and castalagin in serum. F, Volcano plot representation for the differential metabolite difference from the tumor of mice receiving water or castalagin (n = 7 mice/group). The horizontal dotted black line shows where P = 0.05 with points above indicating metabolites with significantly different abundance (P < 0.05). *, P < 0.05.
Figure 4.
Castalagin influences the microbiome composition and metabolite production. A, Volcano plot representation of differential abundance analysis results after 16S rRNA sequencing analysis of water/IsoPD-1 vs. castalagin/IsoPD-1 groups of the MCA-205 model (n = 10 mice/group). Bacteria enriched in each group are represented using adjusted P value (fill shape symbol) and P value (no fill shape symbol; false discovery rate: 0.05). B, Metagenomics sequencing with representation of species richness in fecal samples from MCA-205 experiment in water (IsoPD-1 and αPD-1) vs. castalagin/CC (IsoPD-1 and αPD-1) groups. Bray–Curtis representation for beta diversity. C, Bar plot representation of differential abundance analysis results after metagenomics sequencing analysis between water (IsoPD-1 and αPD-1) and castalagin/CC (IsoPD-1 and αPD-1) groups. D, Heat map of change in metabolite relative abundance in the feces and serum. Hierarchical clustering (Euclidean distance, Ward linkage method) of the metabolite abundance is shown (n = 7 mice/group). E, Metabolites’ principal coordinate analysis between water and castalagin in serum. F, Volcano plot representation for the differential metabolite difference from the tumor of mice receiving water or castalagin (n = 7 mice/group). The horizontal dotted black line shows where P = 0.05 with points above indicating metabolites with significantly different abundance (P < 0.05). *, P < 0.05.
Figure 5. Immune-potentiating effect of castalagin. A, Flow cytometry analysis of MCA-205 TIL and CD8+ TCM cell (CD45RB− CD62L+) subpopulation in the GF and SPF experiments comparing castalagin vs. water (n = 10 mice/group). B, Representative immunofluorescence images of MCA-205 tumors for CD8+, CD4+, and FOXP3+ cells in castalagin/IsoPD-1 and water/IsoPD-1 groups. C, Tumor immunofluorescence for CD8+/FOXP3+CD4+ cell ratio results for both groups shown in B. Each circle represents one tumor. D, Pathway classification from RNA-seq results using gene set enrichment analysis based on the KEGG database comparing castalagin/IsoPD-1 vs. water/IsoPD-1 groups of MCA-205 tumors. E, Percentage of killing of CD8+ T OT-1 cells from the draining lymph node (dLN) in mice treated with castalagin or water and immunized with CpG/OVA (n = 10 mice/group). *, P < 0.05; **, P < 0.01.
Figure 5.
Immune-potentiating effect of castalagin. A, Flow cytometry analysis of MCA-205 TIL and CD8+ TCM cell (CD45RB CD62L+) subpopulation in the GF and SPF experiments comparing castalagin vs. water (n = 10 mice/group). B, Representative immunofluorescence images of MCA-205 tumors for CD8+, CD4+, and FOXP3+ cells in castalagin/IsoPD-1 and water/IsoPD-1 groups. C, Tumor immunofluorescence for CD8+/FOXP3+CD4+ cell ratio results for both groups shown in B. Each circle represents one tumor. D, Pathway classification from RNA-seq results using gene set enrichment analysis based on the KEGG database comparing castalagin/IsoPD-1 vs. water/IsoPD-1 groups of MCA-205 tumors. E, Percentage of killing of CD8+ T OT-1 cells from the draining lymph node (dLN) in mice treated with castalagin or water and immunized with CpG/OVA (n = 10 mice/group). *, P < 0.05; **, P < 0.01.
Figure 6. Castalagin circumvents αPD-1 resistance in mice conferred by FMT from NR patients with NSCLC and influences the microbiome composition in a dose-dependent manner. A, FMT of stool sample from three NR patients with NSCLC (NR 1, 3, and 6) was performed in GF C57BL/6 mice (n = 12/group). Two weeks later, MCA-205 sarcoma cells were inoculated, and mice received a daily oral gavage with castalagin or water. B, MCA-205 tumor growth kinetics in the ATB-avatar model after FMT from three NR patients (NR 3, 5, and 6) with daily oral supplementation with castalagin or water in combination with αPD-1 or IsoPD-1. C, Relative abundance analysis results after 16S rRNA sequencing analysis of Ruminococcus, Alistipes, and Christensenellaceae R-7 group between castalagin and water groups in the NR FMT experiments. D, MCA-205 tumor size at sacrifice of mice that received daily oral gavage of castalagin with increasing concentrations from 0 mg/kg to 2.55 mg/kg. E, Real-time PCR of DNA extracted from mouse feces after 6 days of oral gavage with water or castalagin at 0.21, 0.85, and 2.55 mg/kg, using specific primers for Ruminococcaceae detection in the MCA-205 experiment (n = 5/group). Means ± SEM are represented. ns, nonsignificant; *, P < 0.05; **, P < 0.01; ***, P < 0.001.
Figure 6.
Castalagin circumvents αPD-1 resistance in mice conferred by FMT from NR patients with NSCLC and influences the microbiome composition in a dose-dependent manner. A, FMT of stool sample from three NR patients with NSCLC (NR 1, 3, and 6) was performed in GF C57BL/6 mice (n = 12/group). Two weeks later, MCA-205 sarcoma cells were inoculated, and mice received a daily oral gavage with castalagin or water. B, MCA-205 tumor growth kinetics in the ATB-avatar model after FMT from three NR patients (NR 3, 5, and 6) with daily oral supplementation with castalagin or water in combination with αPD-1 or IsoPD-1. C, Relative abundance analysis results after 16S rRNA sequencing analysis of Ruminococcus, Alistipes, and Christensenellaceae R-7 group between castalagin and water groups in the NR FMT experiments. D, MCA-205 tumor size at sacrifice of mice that received daily oral gavage of castalagin with increasing concentrations from 0 mg/kg to 2.55 mg/kg. E, Real-time PCR of DNA extracted from mouse feces after 6 days of oral gavage with water or castalagin at 0.21, 0.85, and 2.55 mg/kg, using specific primers for Ruminococcaceae detection in the MCA-205 experiment (n = 5/group). Means ± SEM are represented. ns, nonsignificant; *, P < 0.05; **, P < 0.01; ***, P < 0.001.
Figure 7. Castalagin and not its metabolites provides antitumor activity and directly interacts with the cellular envelope of Ruminococcus. A, Tumor size at sacrifice of mice that received castalagin or its downstream metabolites or its diastereomer vescalagin. Structures of these compounds are shown in Supplementary Fig. S13. B, Relative proportion of castalagin metabolizers and nonmetabolizers based on ex vivo castalagin metabolism assays using fecal samples from NSCLC ICI-responder (R; N = 11) and ICI-nonresponder (NR; N = 12) patients. Associations between ex vivo castalagin metabolism and patient response status were determined using the Fisher exact test on the number of patients in each category (P = 0.0272). Detailed assignments of metabolic phenotypes (metabotypes) for patients are reported in Supplementary Fig. S15B. C, Heat map representation of metagenomic microbiome sequencing from 23 patients with NSCLC amenable to ICI and segregated between castalagin nonmetabolizer and metabolizers. ORR, objective response rate. D, Labeling experiments on R. bromii, R. bicirculans, E. coli, and B. thetaiotaomicron. Cells were incubated with either 2 μmol/L fluo-castalagin (FC) or 2 μmol/L free fluorescein and free castalagin (F + C) for 1 hour at 37°C. Each circle represents one independent experiment. E, Representative epifluorescence microscopy images of fluo-castalagin–labeled R. bromii, E. coli, and B. thetaiotaomicron. Merge represents superimposed images of fluorescence and phase contrast. Scale bar, 2 μm. F, Tumor size at sacrifice of GF mice bearing MCA-205 treated with castalagin or water in combination with oral gavage with R. bromii or PBS. Each circle represents one animal. G, Real-time qPCR of DNA extracted from mouse feces using specific primers for R. bromii detection in GF mice bearing MCA-205 tumors. Mean ± SEM represented. *, P < 0.05; **, P < 0.01; ***, P < 0.001.
Figure 7.
Castalagin and not its metabolites provides antitumor activity and directly interacts with the cellular envelope of Ruminococcus. A, Tumor size at sacrifice of mice that received castalagin or its downstream metabolites or its diastereomer vescalagin. Structures of these compounds are shown in Supplementary Fig. S13. B, Relative proportion of castalagin metabolizers and nonmetabolizers based on ex vivo castalagin metabolism assays using fecal samples from NSCLC ICI-responder (R; N = 11) and ICI-nonresponder (NR; N = 12) patients. Associations between ex vivo castalagin metabolism and patient response status were determined using the Fisher exact test on the number of patients in each category (P = 0.0272). Detailed assignments of metabolic phenotypes (metabotypes) for patients are reported in Supplementary Fig. S15B. C, Heat map representation of metagenomic microbiome sequencing from 23 patients with NSCLC amenable to ICI and segregated between castalagin nonmetabolizer and metabolizers. ORR, objective response rate. D, Labeling experiments on R. bromii, R. bicirculans, E. coli, and B. thetaiotaomicron. Cells were incubated with either 2 μmol/L fluo-castalagin (FC) or 2 μmol/L free fluorescein and free castalagin (F + C) for 1 hour at 37°C. Each circle represents one independent experiment. E, Representative epifluorescence microscopy images of fluo-castalagin–labeled R. bromii, E. coli, and B. thetaiotaomicron. Merge represents superimposed images of fluorescence and phase contrast. Scale bar, 2 μm. F, Tumor size at sacrifice of GF mice bearing MCA-205 treated with castalagin or water in combination with oral gavage with R. bromii or PBS. Each circle represents one animal. G, Real-time qPCR of DNA extracted from mouse feces using specific primers for R. bromii detection in GF mice bearing MCA-205 tumors. Mean ± SEM represented. *, P < 0.05; **, P < 0.01; ***, P < 0.001.

Comment in

  • Cancer Discov. 12:873.
  • Cancer Discov. 12:873.

References

    1. Elkrief A, Joubert P, Florescu M, Tehfe M, Blais N, Routy B. Therapeutic landscape of metastatic non–small-cell lung cancer in Canada in 2020. Curr Oncol Tor Ont 2020;27:52–60. - PMC - PubMed
    1. Gandhi L, Rodríguez-Abreu D, Gadgeel S, Esteban E, Felip E, De Angelis Fet al. . Pembrolizumab plus chemotherapy in metastatic non-small-cell lung cancer. N Engl J Med 2018;378:2078–92. - PubMed
    1. Motzer RJ, Tannir NM, McDermott DF, Arén Frontera O, Melichar B, Choueiri TKet al. . Nivolumab plus ipilimumab versus sunitinib in advanced renal-cell carcinoma. N Engl J Med 2018;378:1277–90. - PMC - PubMed
    1. Pitt JM, Vétizou M, Daillère R, Roberti MP, Yamazaki T, Routy Bet al. . Resistance mechanisms to immune-checkpoint blockade in cancer: tumor-intrinsic and -extrinsic factors. Immunity 2016;44:1255–69. - PubMed
    1. Chen DS, Mellman I. Elements of cancer immunity and the cancer-immune set point. Nature 2017;541:321–30. - PubMed

Publication types

Grants and funding