. 2022 Jan 14;12(1):756.
doi: 10.1038/s41598-021-04644-3.

A mutation in transmembrane protein 135 impairs lipid metabolism in mouse eyecups

Affiliations

A mutation in transmembrane protein 135 impairs lipid metabolism in mouse eyecups

Michael Landowski et al. Sci Rep. .

Abstract

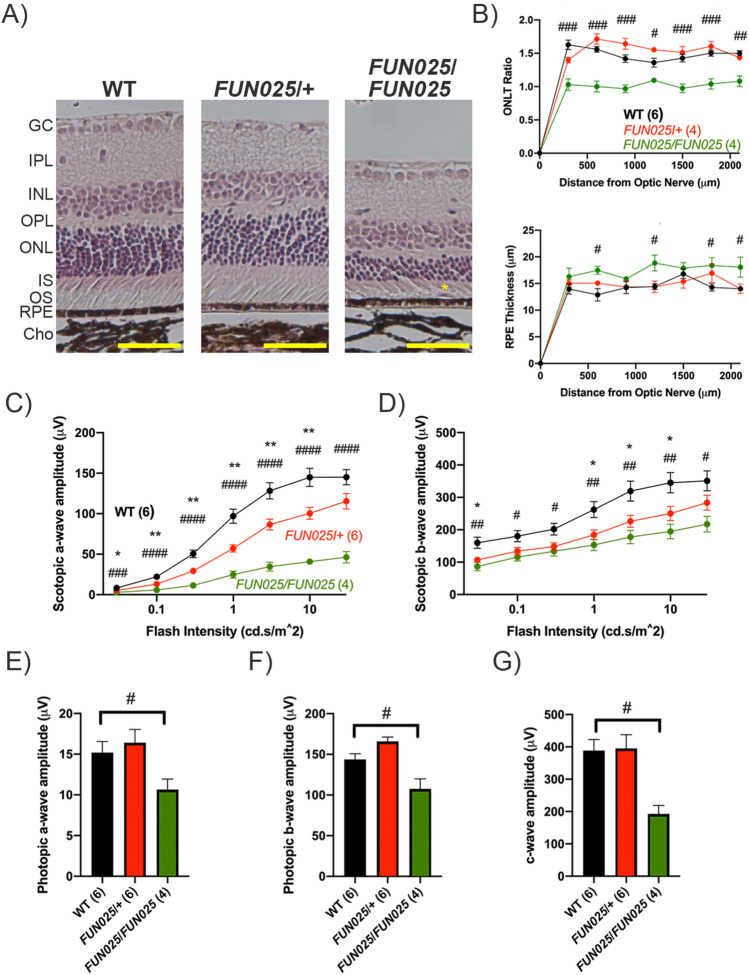
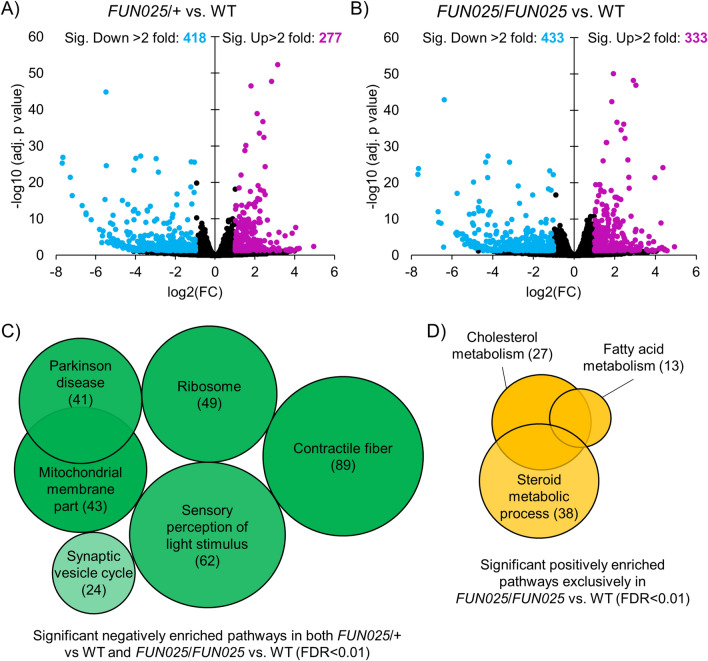
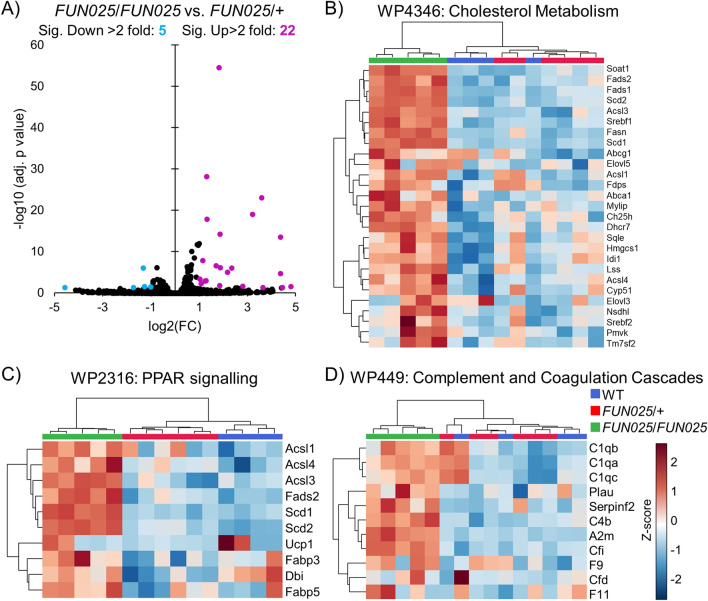
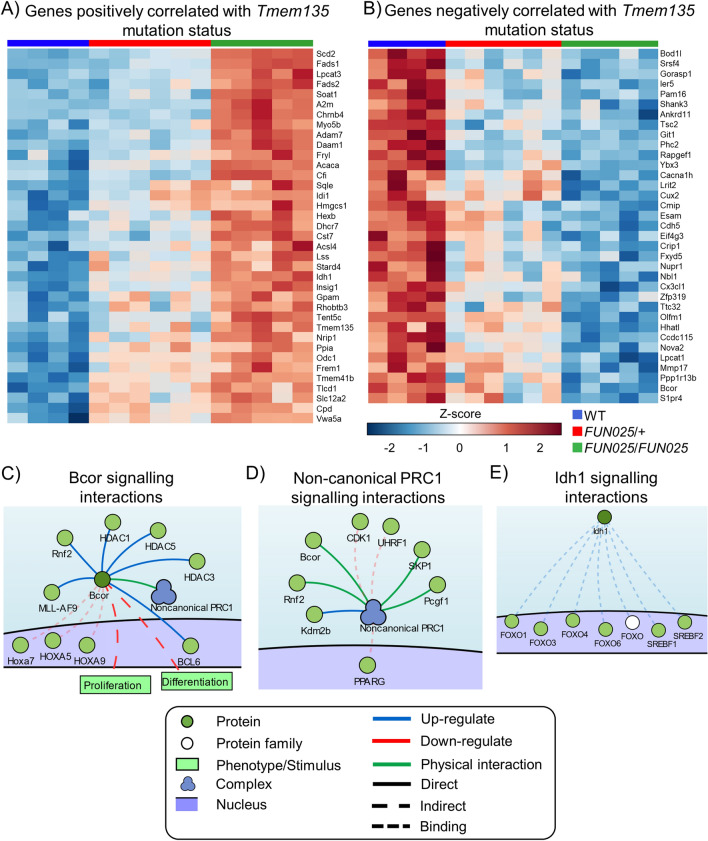
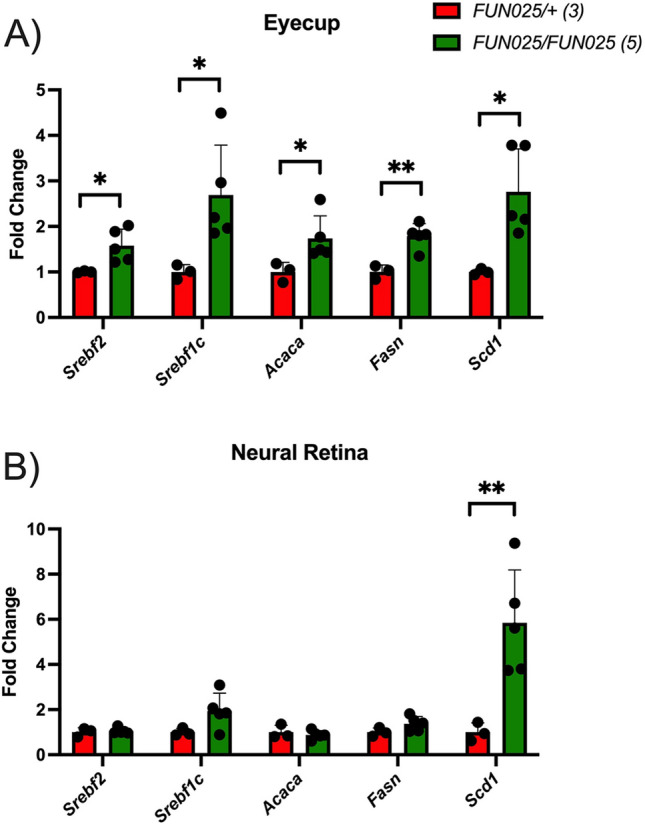
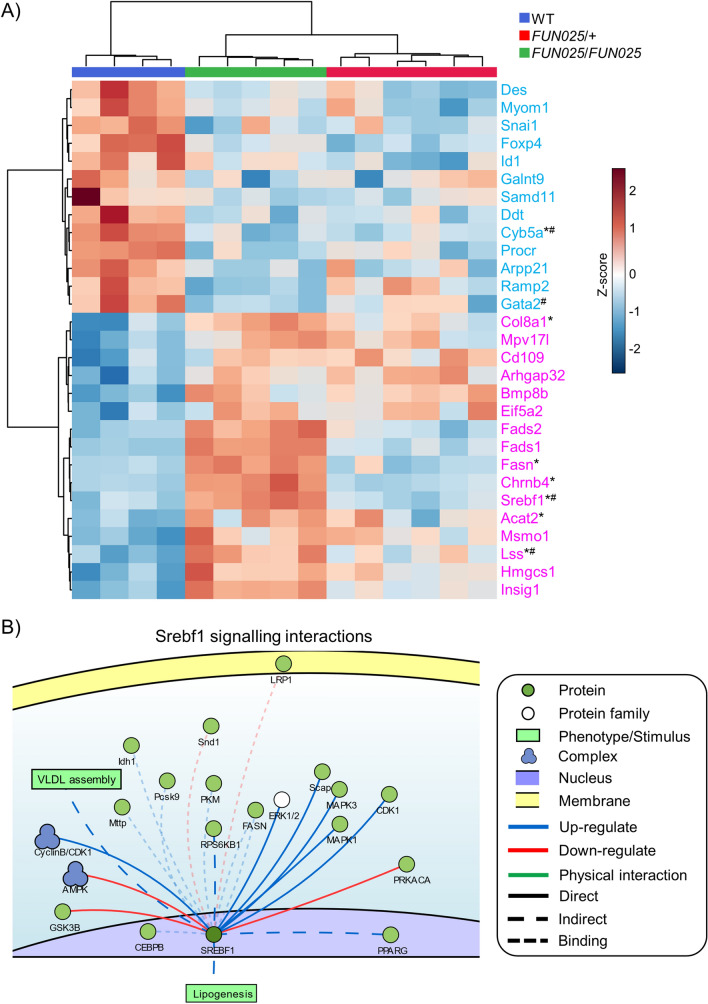
Aging is a significant factor in the development of age-related diseases but how aging disrupts cellular homeostasis to cause age-related retinal disease is unknown. Here, we further our studies on transmembrane protein 135 (Tmem135), a gene involved in retinal aging, by examining the transcriptomic profiles of wild-type, heterozygous and homozygous Tmem135 mutant posterior eyecup samples through RNA sequencing (RNA-Seq). We found significant gene expression changes in both heterozygous and homozygous Tmem135 mutant mouse eyecups that correlate with visual function deficits. Further analysis revealed that expression of many genes involved in lipid metabolism are changed due to the Tmem135 mutation. Consistent with these changes, we found increased lipid accumulation in mutant Tmem135 eyecup samples. Since mutant Tmem135 mice have similar ocular pathologies as human age-related macular degeneration (AMD) eyes, we compared our homozygous Tmem135 mutant eyecup RNA-Seq dataset with transcriptomic datasets of human AMD donor eyes. We found similar changes in genes involved in lipid metabolism between the homozygous Tmem135 mutant eyecups and AMD donor eyes. Our study suggests that the Tmem135 mutation affects lipid metabolism as similarly observed in human AMD eyes, thus Tmem135 mutant mice can serve as a good model for the role of dysregulated lipid metabolism in AMD.


Conflict of interest statement

The authors declare no competing interests.

Figures

Figure 1
Figure 1
Retinal Phenotype of 12-Month-Old Tmem135FUN025/+ mice. (A) Representative images of the retinas of 12-month-old WT, Tmem135FUN025/+ (FUN025/+) and Tmem135FUN025/FUN025 (FUN025/FUN025) mice. Note the decreased ONL thickness and subretinal immune cell (denoted with a yellow asterisk) in the 12-month-old Tmem135FUN025/FUN025 retina which are not present in the 12-month-old Tmem135FUN025/+ mice. Magnification = 20×. Scale bar = 100 microns. (B) ONLT and RPE ratios. No significant differences were noted between the WT and Tmem135FUN025/+ mice. (C-G) ERG recordings for 12-month-old WT, Tmem135FUN025/+ and Tmem135FUN025/FUN025 mice during scotopic and photopic conditions. * and ** indicates a P < 0.05 and P < 0.01 significance by post hoc Tukey test following a significant difference detected by one-way ANOVA between WT and Tmem135FUN025/+. #, ##, ###, and #### indicates a P < 0.05, P < 0.01, P < 0.001, and P < 0.0001significance by post hoc Tukey test following a significant difference detected by one-way ANOVA between WT and Tmem135FUN025/FUN025 mice. All data are mean ± s.e.m.
Figure 2
Figure 2
RNA-Seq analysis of 2.5-month-old heterozygous and homozygous Tmem135 mutant eyecups compared to WT eyecups. Volcano plot highlighting differentially-expressed genes with fold changes greater than 2 that reach statistical significance (p < 0.05) between (A) Tmem135FUN025/+ (FUN025/+) and WT eyecups as well as (B) Tmem135FUN025/FUN025 (FUN025/FUN025) and WT eyecups. Genes that are upregulated and downregulated are highlighted in magenta and cyan, respectively. Gene Set Enrichment Analysis (GSEA) results of significantly enriched gene sets (FDR < 0.01) of (C) downregulated genes and (D) upregulated in Tmem135FUN025/+ and Tmem135FUN025/FUN025 eyecups compared to WT eyecups. The numbers within brackets indicate the number of genes in the leading edge in the gene set and the colour indicates the normalized enrichment score where the lighter tone means less enrichment and darker tone means more enrichment.
Figure 3
Figure 3
RNA-Seq analysis of 2.5-month-old homozygous Tmem135 mutant eyecups compared to heterozygous Tmem135 mutant eyecups. (A) Volcano plot highlighting differentially-expressed genes with fold changes greater than 2 that reach statistical significance (p < 0.05) between Tmem135FUN025/FUN025 (FUN025/FUN025) and Tmem135FUN025/+ (FUN025/+) eyecups. Genes that are upregulated and downregulated are highlighted in magenta and cyan, respectively. Heatmaps of differentially-expressed genes in the leading edge with greater than log2 fold changes between Tmem135FUN025/FUN025 and Tmem135FUN025/+ eyecups involved in (B) cholesterol metabolism, (C) PPAR signalling, and (D) complement and coagulation cascades which were identified using gene set enrichment analysis. These genes were unchanged between Tmem135FUN025/+ and WT eyecups.
Figure 4
Figure 4
Correlation analysis highlights important signalling pathways affected by Tmem135 mutations. Heatmap of genes which are significantly (A) positively and (B) negatively correlated (FDR < 0.01) with the number of mutant Tmem135 alleles in 2.5-month-old WT, Tmem135FUN025/+, and Tmem135FUN025/FUN025 eyecups. Signalling network highlights interactions of (C) BCL6 corepressor (Bcor), (D) non-canonical polycomb recessive complex 1 (PRC1), and (E) isocitrate dehydrogenase 1 (Idh1). Network generated using the SIGnalling Network Open Resource (SIGNOR 2.0).
Figure 5
Figure 5
Lipid Levels in WT, Heterozygous and Homozygous Tmem135 Mutant Eyecups. Cholesterol levels in eyecups of (A) 3-month-old and (B) 12-month-old WT, Tmem135FUN025/+ (FUN025/ +), and Tmem135FUN025/FUN025 (FUN025/FUN025) mice. * indicates a P < 0.05 significance by post hoc Tukey test following a significant difference detected by one-way ANOVA. Numbers with brackets denote number of mice used for experiment. Each dot represents each individual sample. Data is presented as mean ± s.d.. (C) Representative RPE flat mount images after labelling for tight junctions (green) and staining for neutral lipids (red) and nuclei (blue). Mag = 20×, Scale Bar = 25 microns.
Figure 6
Figure 6
Lipid Metabolic Gene Expression in Eyecup and Neural Retinas of 2.5-month-old Heterozygous and Homozygous Tmem135 Mutant Mice. Quantitative PCR analysis of lipid metabolic transcription factors (Srebf2 and Srebf1c) and lipid synthesis genes (Acaca, Fasn, and Scd1) in the (A) eyecups and (B) neural retinas of 2.5-month-old male Tmem135FUN025/+ (FUN025/ +) and Tmem135FUN025/FUN025 (FUN025/FUN025) mice. Numbers in brackets denote number of mice used in experiment. Each dot represents each individual sample. * and ** indicates a P < 0.05 and P < 0.01 significance by Student’s T-test.
Figure 7
Figure 7
Comparison of Tmem135FUN025/FUN025 eyecup and AMD-afflicted RPE/choroid transcriptional profiles. (A) Heatmap showing the significantly altered genes from Tmem135FUN025/FUN025 vs. WT which are affected in a similar direction (up [magenta] or down [cyan]) when compared with integrated expression analysis from microarray and RNA-Seq data (GSE29801 and GSE135092) from AMD patients. Genes which are affected in *intermediate and #advanced stage of AMD are also highlighted. (B) Signalling network highlights interactions of Sterol Regulatory Element Binding Transcription Factor 1 (SREBF1). Network generated using the SIGnalling Network Open Resource (SIGNOR 2.0).

References

    1. Van Cauwenberghe C, Van Broeckhoven C, Sleegers K. The genetic landscape of Alzheimer disease: Clinical implications and perspectives. Genet. Med. 2016;18:421–430. doi: 10.1038/gim.2015.117. - DOI - PMC - PubMed
    1. Fritsche LG, et al. Age-related macular degeneration: Genetics and biology coming together. Annu. Rev. Genomics Hum. Genet. 2014;15:151–171. doi: 10.1146/annurev-genom-090413-025610. - DOI - PMC - PubMed
    1. Lee WH, et al. Mouse Tmem135 mutation reveals a mechanism involving mitochondrial dynamics that leads to age-dependent retinal pathologies. Elife. 2016;5:1–29. doi: 10.7554/eLife.19264. - DOI - PMC - PubMed
    1. Žárský V, Doležal P. Evolution of the Tim17 protein family. Biol Direct. 2016;11:1–13. doi: 10.1186/s13062-016-0157-y. - DOI - PMC - PubMed
    1. Exil VJ, et al. Stressed-induced TMEM135 protein is part of a conserved genetic network involved in fat storage and longevity regulation in Caenorhabditis elegans. PLoS ONE. 2010;5:1–11. doi: 10.1371/journal.pone.0014228. - DOI - PMC - PubMed

Publication types

LinkOut - more resources