. 2022 Jan 5:9:uhab045.
doi: 10.1093/hr/uhab045.

Alternative transcription and feedback regulation suggest that SlIDI1 is involved in tomato carotenoid synthesis in a complex way

Affiliations

Alternative transcription and feedback regulation suggest that SlIDI1 is involved in tomato carotenoid synthesis in a complex way

Ming Zhou et al. Hortic Res. .

Abstract

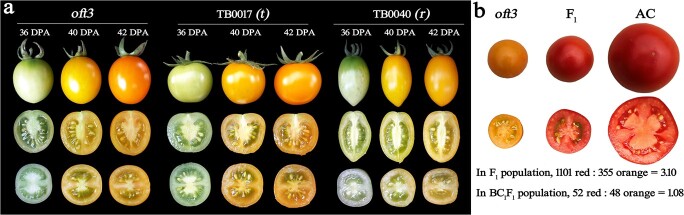
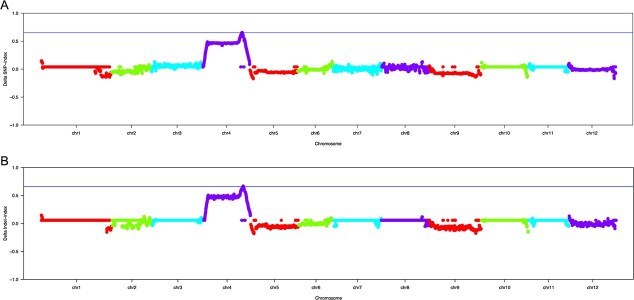
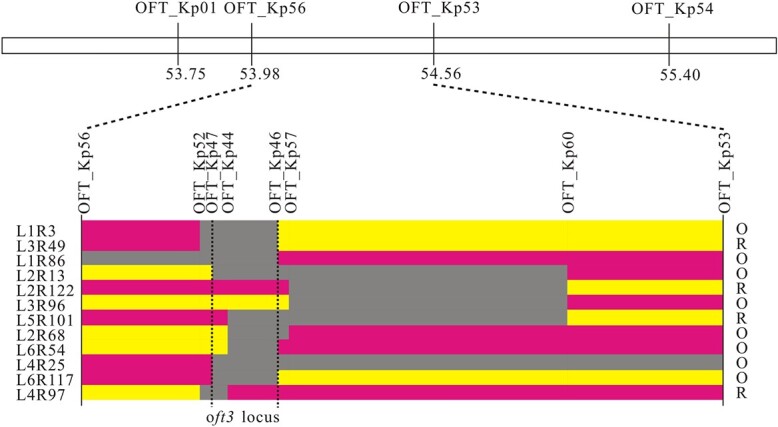
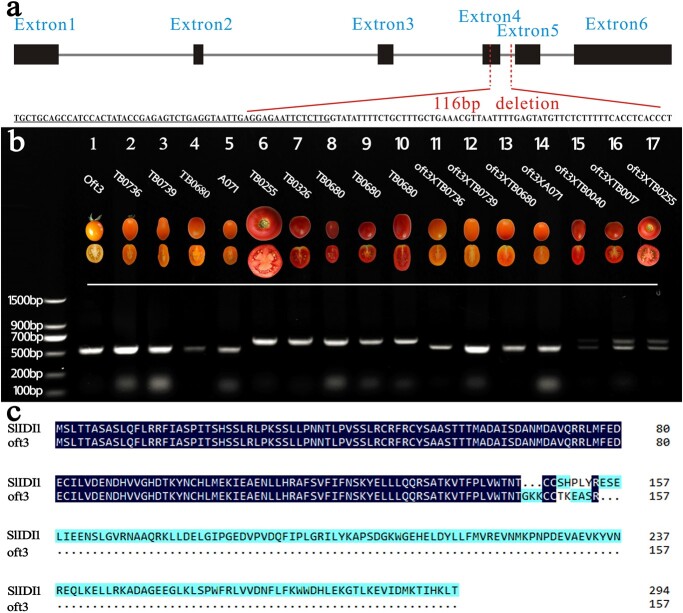
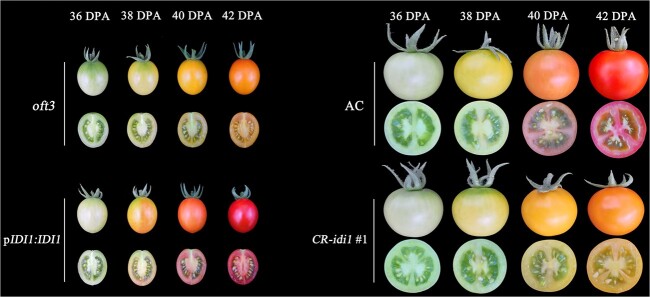
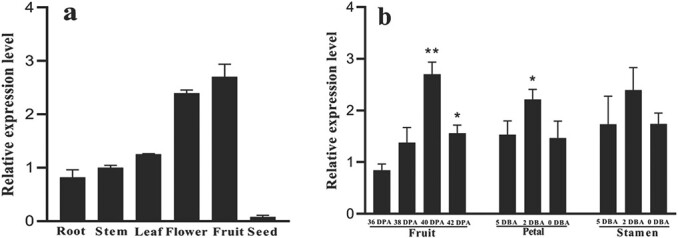
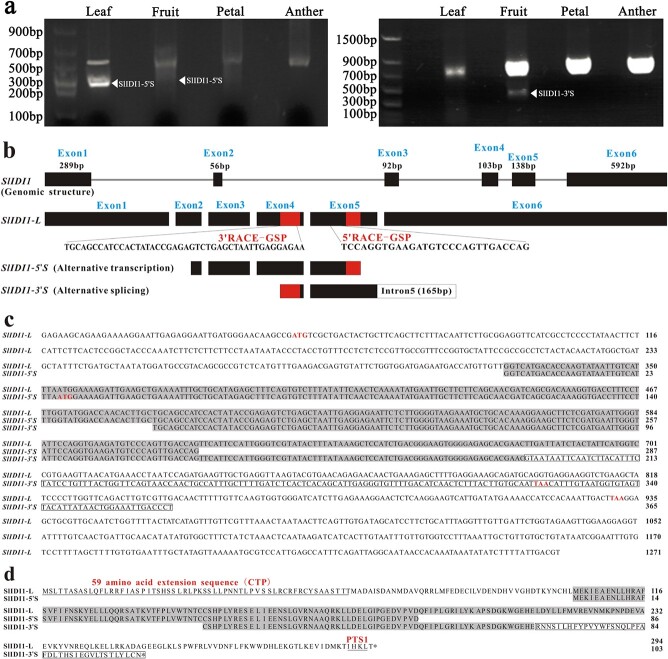
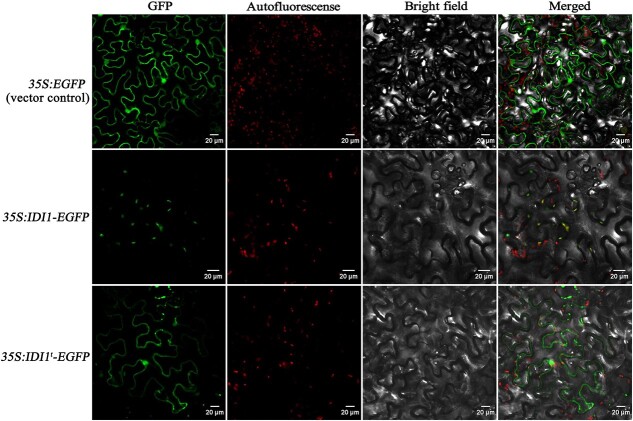
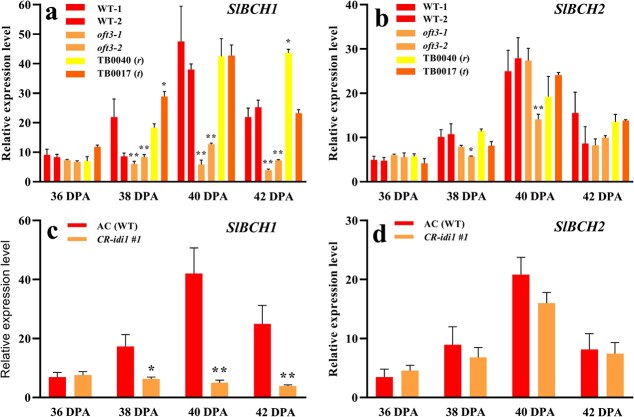
Carotenoid pigments confer photoprotection and visual attraction and serve as precursors for many important signaling molecules. Herein, the orange-fruited phenotype of a tomato elite inbred line resulting from sharply reduced carotenoid levels and an increased β-carotene-to-lycopene ratio in fruit was shown to be controlled by a single recessive gene, oft3. BSA-Seq combined with fine mapping delimited the oft3 gene to a 71.23 kb interval on chromosome 4, including eight genes. Finally, the oft3 candidate gene SlIDI1, harboring a 116 bp deletion mutation, was identified by genome sequence analysis. Further functional complementation and CRISPR-Cas9 knockout experiments confirmed that SlIDI1 was the gene underlying the oft3 locus. qRT-PCR analysis revealed that the expression of SlIDI1 was highest in flowers and fruit and increased with fruit ripening or flower maturation. SlIDI1 simultaneously produced long and short transcripts by alternative transcription initiation and alternative splicing. Green fluorescent protein fusion expression revealed that the long isoform was mainly localized in plastids and that an N-terminal 59-amino acid extension sequence was responsible for plastid targeting. Short transcripts were identified in leaves and fruit by 5' RACE and in fruit by 3' RACE, which produced corresponding proteins lacking transit peptides and/or putative peroxisome targeting sequences, respectively. In SlIDI1 mutant fruit, SlBCH1 transcription involved in β-carotenoid catabolism was obviously suppressed, which may be responsible for the higher β-carotene-to-lycopene ratio and suggested potential feedback regulatory mechanisms involved in carotenoid pathway flux.


Figures

Figure 1
Figure 1
Fruit color development and genetic analysis of oft3. a Fruit color development. The tomato inbred lines oft3, the tangerine (t) mutant TB0017, and the r mutant TB0040 were originally developed in our lab. Fruit color (top), cross-sections (middle) and longitudinal sections (bottom) of these lines are shown at three different ripening stages. DPA: days post-anthesis. b Genetic analysis of oft3 conducted in the F2 and BC1F1 populations. Emasculated oft3 flowers were pollinated using AC (WT) pollen to produce the F1 generation. The F2 population was obtained from F1 self-pollinated plants, and the BC1F1 population was obtained by backcrossing using oft3 as a recurrent parent. The fruit color of each plant in the F2 and BC1F1 populations was confirmed when the fruit ripened.
Figure 2
Figure 2
Preliminary mapping of oft3 by using BSA-seq analysis. a Identification of the oft3 candidate region through the ΔSNP index association analysis method. b Identification of the oft3 candidate region through the ΔInDel index association analysis method. The X-axis represents the positions of twelve tomato chromosomes, and the Y-axis represents the Δ index. The colored dots represent the index value of every SNP/InDel locus. The blue imaginary lines indicate the association threshold of the Δ index.
Figure 3
Figure 3
Fine mapping of oft3. The ten KASP markers shown above were used to screen recombinant individuals from the F2 population and the F3 population. The number of each individual recombinant plant is indicated to the left of the figure, and the fruit color phenotype is indicated to the right. Yellow blocks represent homozygosity, red blocks represent heterozygosity, and gray blocks represent the interval where crossover took place. The oft3 locus was refined to a 71.23 kb interval (54 083 697 ~ 54 154 931 bp) between markers OFT_Kp46 and OFT_Kp47 on chromosome 4. R: red-fruited phenotype; O: orange-fruited phenotype.
Figure 4
Figure 4
Sequence analysis of oft3. a The genomic DNA structure of SlIDI1 and the deleted fragment in oft3. Black boxes and gray lines represent the exons and introns of SlIDI1, respectively. The deleted fragment encompassed 55 bp in exon 5 (underlined) and 61 bp in intron 5. b Genotyping of tomato varieties using the markers developed based on the SlIDI1 deletion mutation of oft3. One 520 bp band was amplified by PCR in five orange-fruited inbred lines (Lanes 1–5), and their corresponding F1 hybrids (Lanes 11–14) were obtained by crossing with oft3, whereas a 636 bp band was amplified in five wild-type red-fruited inbred lines (Lanes 6–10). The two bands were produced by PCR in the three F1 hybrids between oft3 and the r mutant TB0040 (Lane 15), t mutant TB0017 (Lane 16) and wild-type AC (Lane 17). c Deduced protein sequence of SlIDI1 in oft3. SlIDI1 in oft3 was deduced to produce a truncated protein (157 aa) terminated by the premature translational stop signal resulting from the deletion mutation.
Figure 5
Figure 5
Functional complementation and knockout analysis of oft3. Functional complementation analysis was conducted in oft3 by transforming oft3 plants with SlIDI1 driven by its native promoter, and all the transformants (pIDI:IDI1 #1 ~ 12) were restored to the red-fruited phenotype, as observed in wild-type AC (left). CR-idi1 #1 was generated by knocking out SlIDI1 in wild-type AC using the CRISPR–Cas9 system. CR-idi1 #1 plants from the T1 generation that were shown to be homozygous for mutated SlIDI1 by genotyping showed an orange-fruited phenotype, similar to that of oft3 (right). Fruit color and longitudinal sections from four different ripening stages are shown. DPA: days post-anthesis.
Figure 6
Figure 6
Spatiotemporal specific expression analysis of SlIDI1 in wild-type AC by qRT–PCR. a Tissue-specific expression analysis of SlIDI1 in different tissues of wild-type AC. b Stage-specific expression analysis of SlIDI1 in the fruit, petals and stamens of wild-type AC at different ripening or maturation stages. Values are the means of four biological replicates ± SD. For stage-specific expression analysis, values were compared among different stages of each tissue, and asterisks denote significance by Student’s t-test (*P < 0.05, **P < 0.01). DPA: days post-anthesis, DBA: days before anthesis.
Figure 7
Figure 7
Alternative transcripts of SlIDI1 identified by RACE-PCR. a RACE-PCR products amplified from the leaves, fruit, petals and anthers of wild-type AC. For 5’ RACE-PCR (left), two identical short products were amplified from leaves and fruit. For 3’ RACE-PCR (right), one short product was amplified from fruit. b Schematic representation of the structures of DNA, the full-length cDNA of SlIDI1 (SlIDI1-L) and two short RACE-PCR products (SlIDI1–5’S and SlIDI1–3’S) identified by 5’ RACE-PCR and 3’ RACE-PCR. SlIDI1-L: long transcripts with the longest 5’-UTR (44 bp) and 3’-UTR (338 bp). Exons and introns are represented by boxes and lines. The 5′ and 3’ UTR are represented by gray boxes. The two specific primers used for 5’-RACE and 3’-RACE (5’RACE-GSP and 3’RACE-GSP) are represented by red boxes. In alternative transcription-generated SlIDI1–5’S, a 274 bp deletion occurred in the CDS region, including exon 1 and part of exon 2. In alternative-splicing-generated SlIDI1–3’S, 254 bp of exon 6 was replaced by 165 bp of intron 5 (white box). c Aligned sequences of the full-length cDNA of SlIDI1 (SlIDI1-L) and two short RACE-PCR products (SlIDI1–5’S and SlIDI1–3’S). The putative initiation codons and stop codons are indicated in red. The retained 165 bp of intron 5 in SlIDI1–3’S is boxed. d Aligned protein sequences deduced from SlIDI1-L, SlIDI1–5’S and SlIDI1–3’S. SlIDI1 is 294 amino acids in length. The putative CTP and type 1 peroxisome targeting sequence (PTS1) are underlined.
Figure 8
Figure 8
Subcellular location of SlIDI1. 35S:SlIDI1-EGFP, with the full-length SlIDI1 CDS, and 35S:SlIDI1t-EGFP, with a truncated SlIDI1 CDS lacking the 59-amino acid extension sequence at the N-terminus, were agroinfiltrated into tobacco leaves, and the agroinfiltrated leaf epidermal cells were examined under a confocal microscope. 35S:EGFP served as the vector control
Figure 9
Figure 9
Expression analysis of SlBCH1 and SlBCH2 by qRT–PCR in the fruit of the SlIDI1 mutant at four ripening stages. a and b Expression analysis of SlBCH1 and SlBCH2 in two wild-type (WT-1 and WT-2) and two oft3 genotyped individuals (oft3–1 and oft3–2) from the segregating BC1F2 population. c and d Expression analysis of SlBCH1 and SlBCH2 in the CRISPR–Cas9-generated SlIDI1 mutant CR-idi1 #1 compared with its parental line AC. Values are the means of four biological replicates ± SD and were compared between genotypes at the same ripening stage. Asterisks denote significance by Student’s t-test (*P < 0.05, **P < 0.01). DPA: days post-anthesis.

References

    1. Demmig-Adams B, Adams WW 3rd.. Antioxidants in photosynthesis and human nutrition. Science. 2002;298:2149–53. - PubMed
    1. Ronen G, Carmel-Goren L, Zamir Det al. . An alternative pathway to β-carotene formation in plant chromoplasts discovered by map-based cloning of Beta and old-gold color mutations in tomato. Proc Natl Acad Sci U S A. 2000;97:11102–7. - PMC - PubMed
    1. Schwartz SH, Qin X, Zeevaart JA. Elucidation of the indirect pathway of abscisic acid biosynthesis by mutants, genes, and enzymes. Plant Physiol. 2003;131:1591–601. - PMC - PubMed
    1. Story EN, Kopec RE, Schwartz SJet al. . An update on the health effects of tomato lycopene. Annu Rev Food Sci Technol. 2010;1:189–210. - PMC - PubMed
    1. Fray RG, Grierson D. Identification and genetic analysis of normal and mutant phytoene synthase genes of tomato by sequencing, complementation and co-suppression. Plant Mol Biol. 1993;22:589–602. - PubMed