. 2022 May;94(5):2067-2078.
doi: 10.1002/jmv.27591. Epub 2022 Jan 26.

N protein-based ultrasensitive SARS-CoV-2 antibody detection in seconds via 3D nanoprinted, microarchitected array electrodes

Affiliations

N protein-based ultrasensitive SARS-CoV-2 antibody detection in seconds via 3D nanoprinted, microarchitected array electrodes

Md Azahar Ali et al. J Med Virol. 2022 May.

Abstract

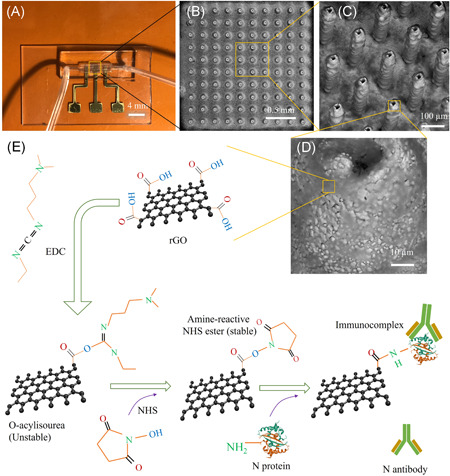
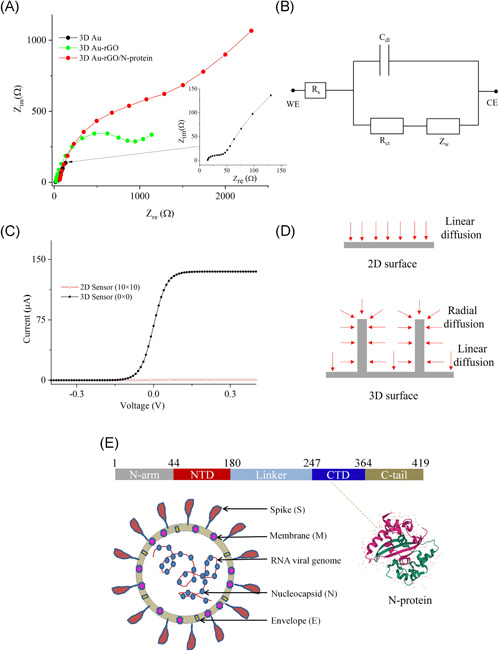
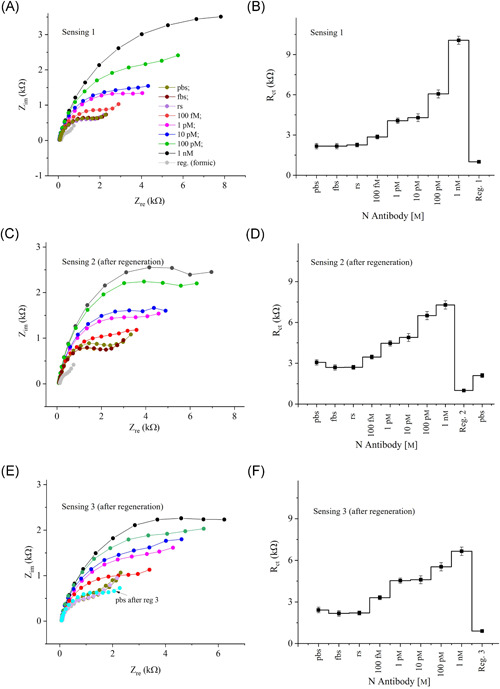
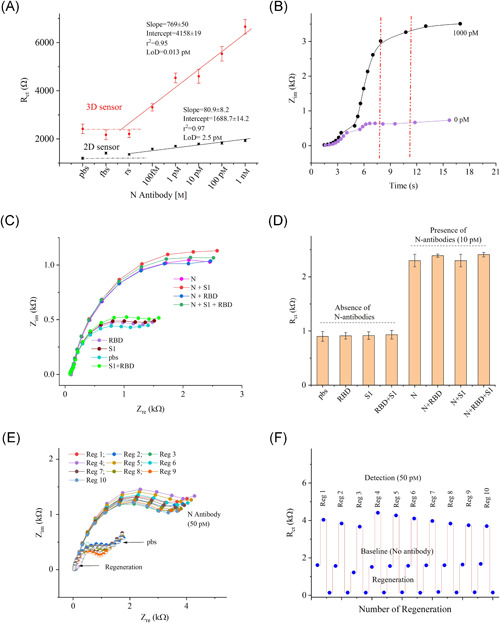
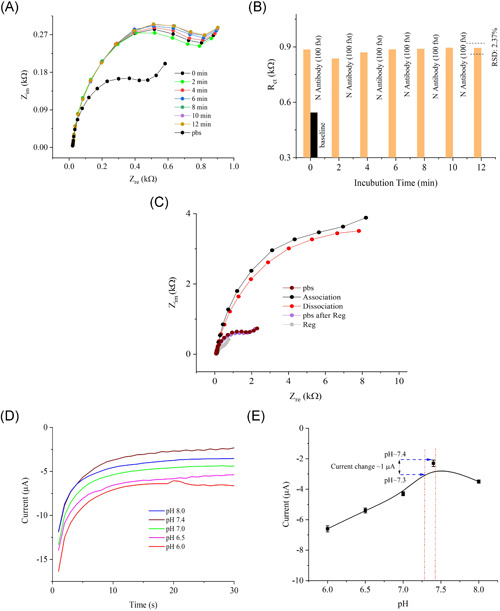
Rapid detection of antibodies to SARS-CoV-2 is critical for COVID-19 diagnostics, epidemiological research, and studies related to vaccine evaluation. It is known that the nucleocapsid (N) is the most abundant protein of SARS-CoV-2 and can serve as an excellent biomarker due to its strong immunogenicity. This paper reports a rapid and ultrasensitive 3D biosensor for quantification of COVID-19 antibodies in seconds via electrochemical transduction. This sensor consists of an array of three-dimensional micro-length-scale electrode architecture that is fabricated by aerosol jet 3D printing, which is an additive manufacturing technique. The micropillar array is coated with N proteins via an intermediate layer of nano-graphene and is integrated into a microfluidic channel to complete an electrochemical cell that uses antibody-antigen interaction to detect the antibodies to the N protein. Due to the structural innovation in the electrode geometry, the sensing is achieved in seconds, and the sensor shows an excellent limit of detection of 13 fm and an optimal detection range of 100 fm to 1 nm. Furthermore, the sensor can be regenerated at least 10 times, which reduces the cost per test. This work provides a powerful platform for rapid screening of antibodies to SARS-CoV-2 after infection or vaccination.

Keywords: 3D printing and functional sensors; N protein; SARS-CoV-2; antibody.


Conflict of interest statement

The authors declare that there are no conflict of interests.

Figures

Figure 1
Figure 1
Device structure for the detection of antibodies to N protein of SARS‐CoV‐2 (i.e., N antibodies). (A) An optical image of the AJ printed 3D sensor. A 10 × 10 array of Au micropillars was printed and then coated with rGO sheets and N protein to form the working electrode of the device. The working electrode was assembled into a microfluidic channel. (B) SEM image showing the top‐view of rGO‐coated Au array (rGO‐Au). (C) High magnification SEM image (tilted at 45°) of the 3D rGO‐Au array. (D) Representative close‐up SEM image showing the surface texture of a micropillar. All the micropillars are hollow in construction. (E) Stepwise process of functionalization of the surface of rGO‐Au micropillars for N‐protein conjugation via EDC‐NHS coupling chemistry. SEM, scanning electron microscope
Figure 2
Figure 2
Electrochemical characterization of the biosensor. (A) Nyquist plots of the 3D sensors with 3D Au, 3D Au‐rGO, and 3D Au‐rGO/N‐protein electrodes. This experiment was conducted in presence of pbs with an equimolar concentration (1 mm) of ferro/ferricyanide. The frequency was set to 1–10 000 Hz while the amplitude was maintained at 1 mV. Inset of (A) shows the impedance spectra for 3D Au electrode. (B) An equivalent circuit between WE and CE for the calculation of Rct, solution resistance (Rs) and Warburg resistance (Zw), and double‐layer capacitance (Cdl). (C) Total current (one‐dimensional) obtained via COMSOL simulation for both 2D (0 × 0) and 3D (10 × 10) sensors. (D) Radial and linear diffusion of redox species for 3D and planar (2D) electrode surface. (E) Schematic showing the structure of N protein of SARS‐CoV‐2, which is also shown in the novel coronavirus (COVID‐19). The crystal structure of SARS‐CoV‐2 nucleocapsid C‐terminal domain (CTD) protein (pdb#7CE0) is also shown
Figure 3
Figure 3
Sensing results of N antibodies. (A) Impedance response (Nyquist plots) of the 3D sensor for the detection of N antibodies. The concentration of N antibodies was varied from 100 fm to 1 nm by adding pbs. Rabbit serum (rs) and fetal bovine serum (fbs) were used for control measurements. The detection frequency and ac signal amplitude were set at 1–10 000 Hz, and 1 mV, respectively. An equimolar concentration of ferro/ferricyanide (1 mm) was used as a redox marker. (B) The Rct obtained from the Nyquist plots in (A) are plotted against the N‐antibody concentration. Once the titrate measurements were completed, the sensor was regenerated using a low‐pH chemistry. The sensing graphs shown in (C) and (D) are similar in trend to that of (A) and (B) respectively, but with some signal degradation. Another regeneration of N‐antibody sensing is shown in (E) and (F). Each error bar represents data from three measurements
Figure 4
Figure 4
Limit‐of‐detection, detection time, selectivity, and regeneration studies of the 3D sensor. (A) Sensor calibration plots for both 2D and 3D sensors with information showing the regression coefficient (r2) and limit‐of‐detection. Error bars in these plots represent three measurements. (B) Detection time as a function of impedance (Zim) for N antibodies. The sensor reached to ~95% of signal within 8 s. (C, D) Selectivity studies of the sensor where the impedance responses (Nyquist plots) are shown in (C) and Rct values are shown in (D). This study was conducted in presence of a fixed concentration of N antibodies (10.0 pm), spike S1 antibodies (10.0 pm), and RBD antibodies (10.0 pm). Results indicate a good selectivity of the sensor. (E, F) Regeneration study of the sensor where the sensor was exposed to 1.0 m solution of the formic acid assay (pH 2.5). The sensor showed 10× regeneration capability for detection of N antibodies
Figure 5
Figure 5
Incubation time and kinetic analysis of the 3D biosensor. (A, B) Incubation time of the sensor for 100 fm concentration of N antibodies. The graph shows the sensor responses at different times after injection of the N‐antibody solution. (B) Rct values for the plots in (A) as a function of the incubation time in minutes. The sensor signal shows a deviation of only 2.3% from the initial signal after 12 min. This indicates that the sensor signal exhibits minimal degradation even for a long incubation time. (C) Association/dissociation (binding) study of the sensor. (D) pH studies of the 3D‐printed bioelectrode (N protein/rGO‐Au). The study shows chronoamperometric responses of the N‐sensor as a function of pH (6.0–8.0). Five identical buffer solutions were prepared for this study at different pH values and tested using the same sensor. (E) Saturated currents obtained at 30 s are plotted against the pH values. Each error bar represents data from three replicate measurements (n= 3) of the sensor

References

    1. Kuzmina A, Khalaila Y, Voloshin O, et al. SARS‐CoV‐2 spike variants exhibit differential infectivity and neutralization resistance to convalescent or post‐vaccination sera. Cell Host Microbe. 2021;29(4):522‐528 e522. - PMC - PubMed
    1. Weissman D, Alameh MG, de Silva T, et al. D614G spike mutation increases SARS CoV‐2 susceptibility to neutralization. Cell Host Microbe. 2021;29(1):23‐31 e24. - PMC - PubMed
    1. Tegally H, Wilkinson E, Giovanetti M, et al. Detection of a SARS‐CoV‐2 variant of concern in South Africa. Nature. 2021;592(7854):438‐443. - PubMed
    1. Li Z, Yi Y, Luo X, et al. Development and clinical application of a rapid IgM‐IgG combined antibody test for SARS‐CoV‐2 infection diagnosis. J Med Viro. 2020;92(9):1518‐1524. - PMC - PubMed
    1. Zhao J, Yuan Q, Wang H, et al. Antibody responses to SARS‐CoV‐2 in patients with novel coronavirus disease 2019. Clin Infect Diseas. 2020;71(16):2027‐2034. - PMC - PubMed

Publication types

Substances