. 2022 Feb 3;185(3):493-512.e25.
doi: 10.1016/j.cell.2021.12.040. Epub 2021 Dec 28.

Complement activation induces excessive T cell cytotoxicity in severe COVID-19

Affiliations

Complement activation induces excessive T cell cytotoxicity in severe COVID-19

Philipp Georg et al. Cell. .

Abstract

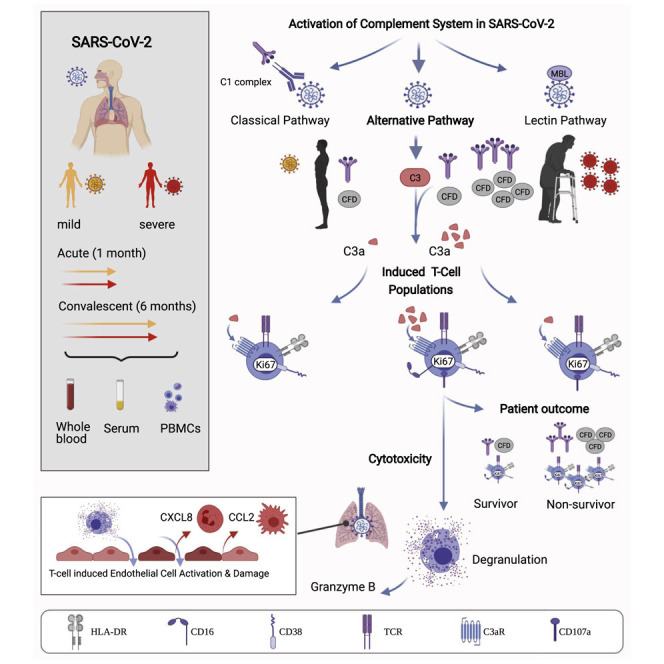
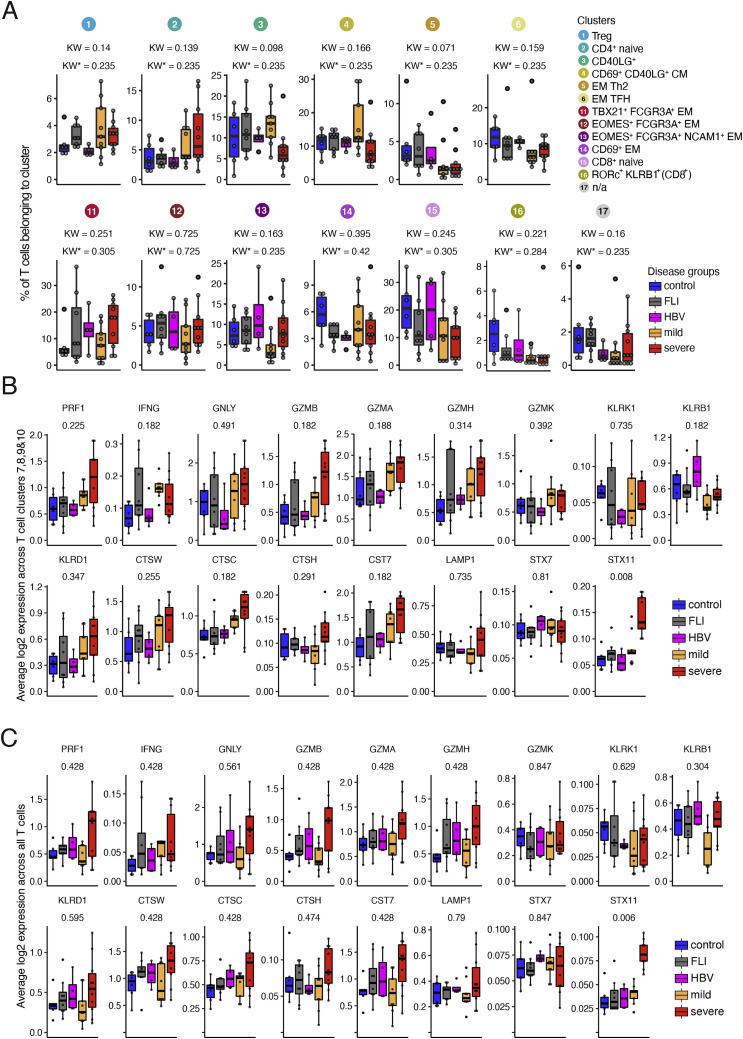
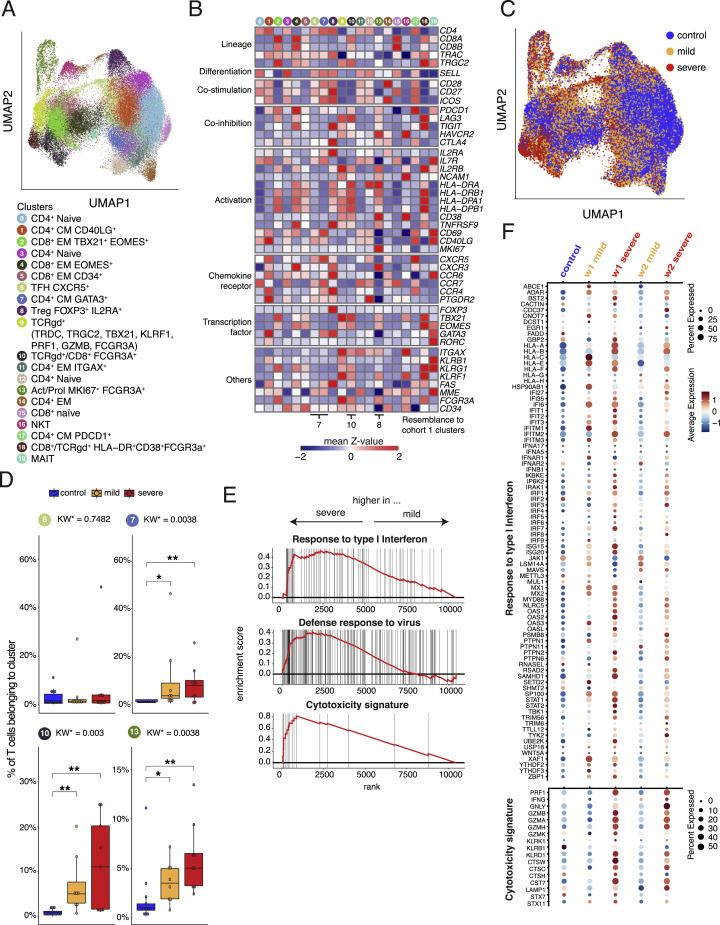
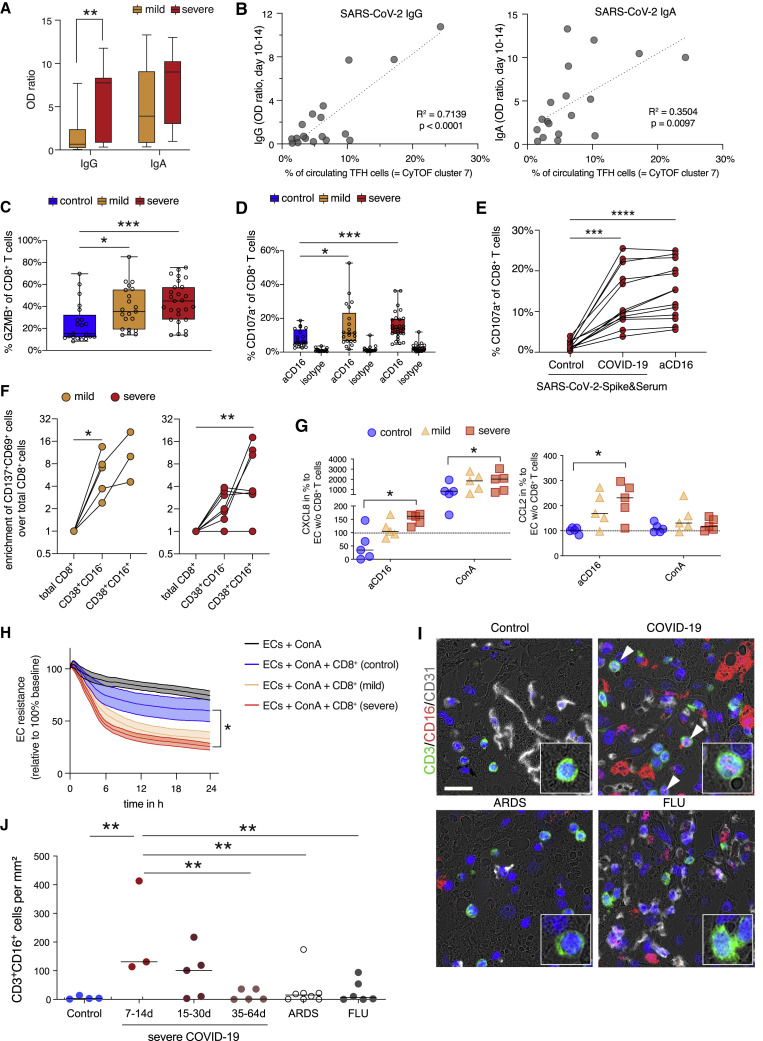
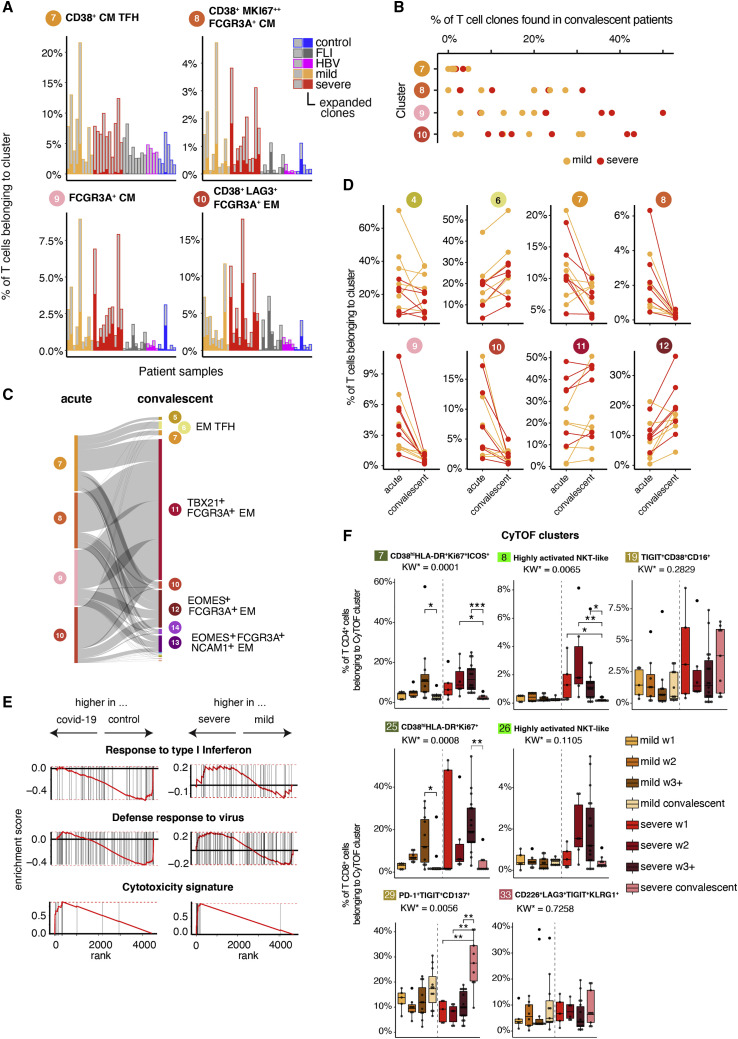
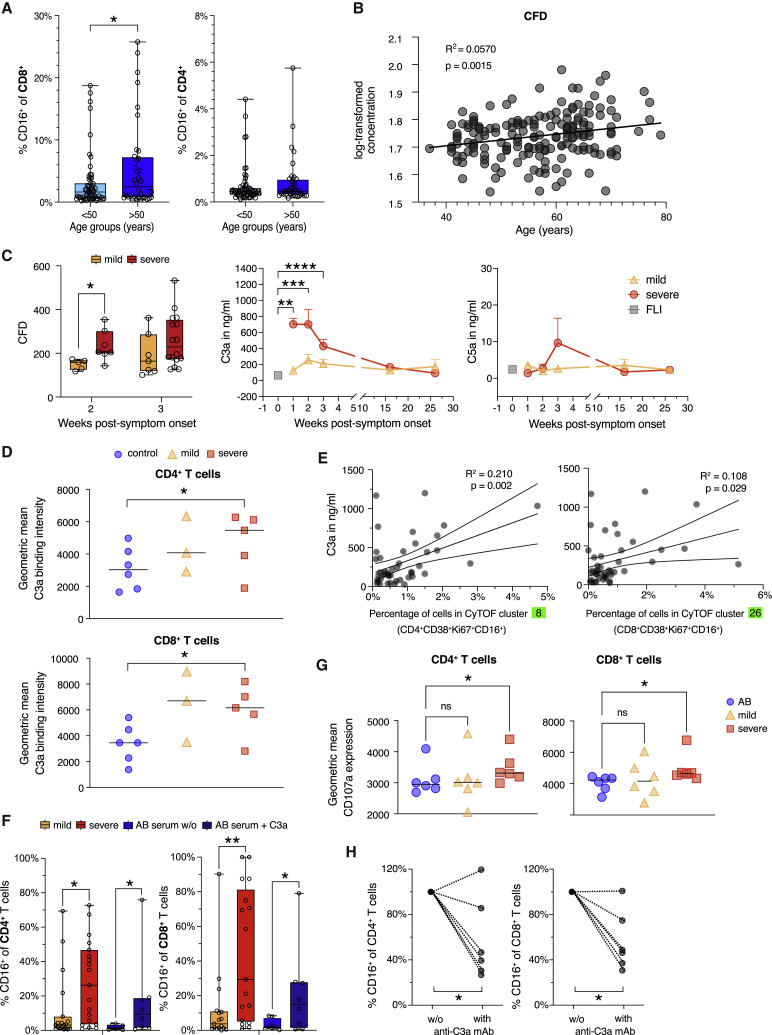
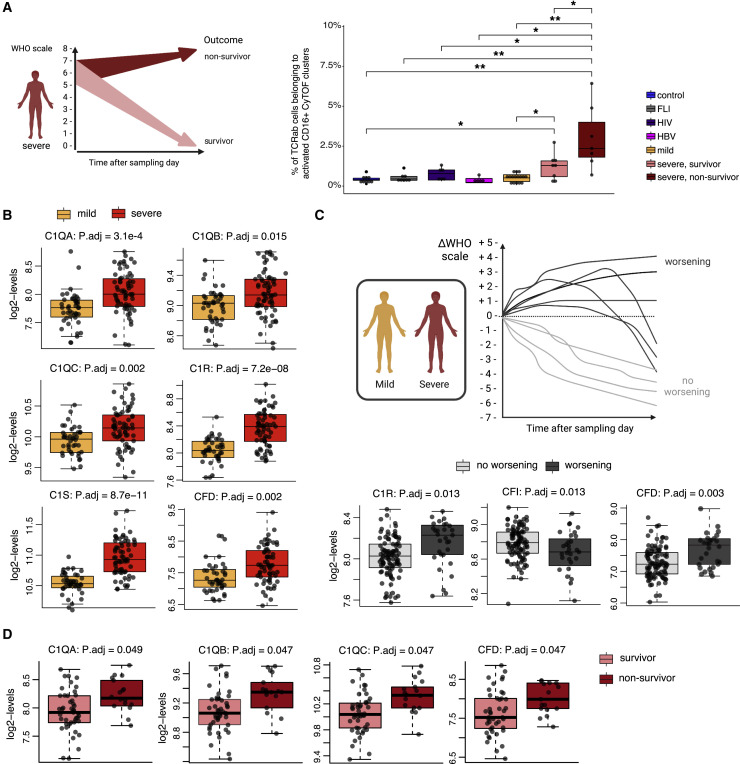
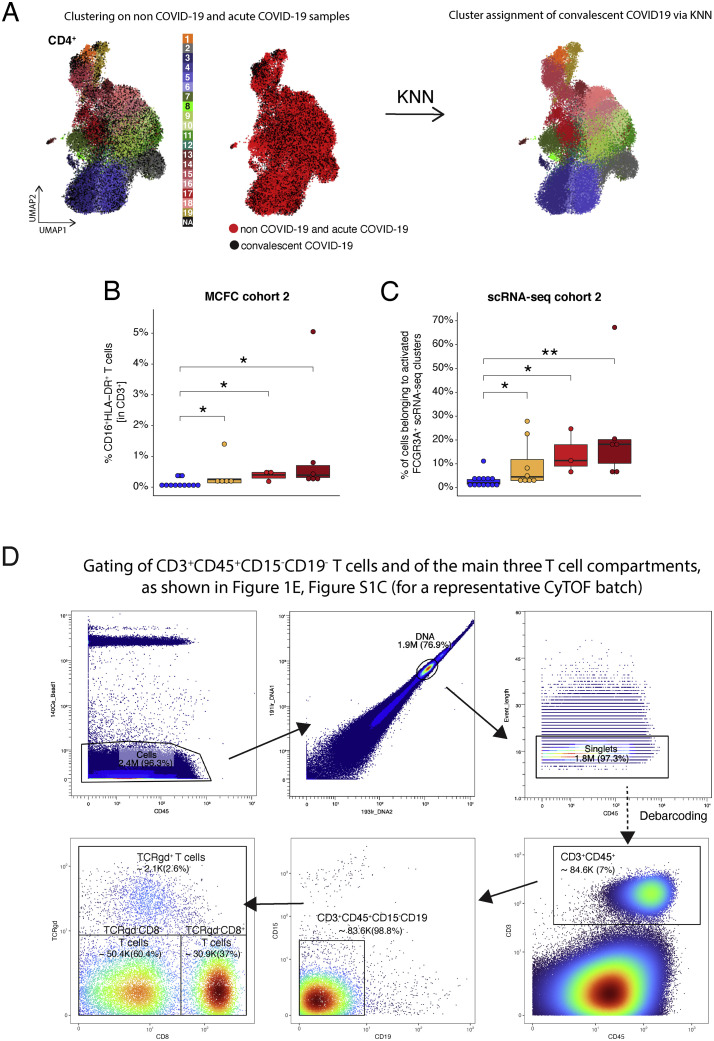
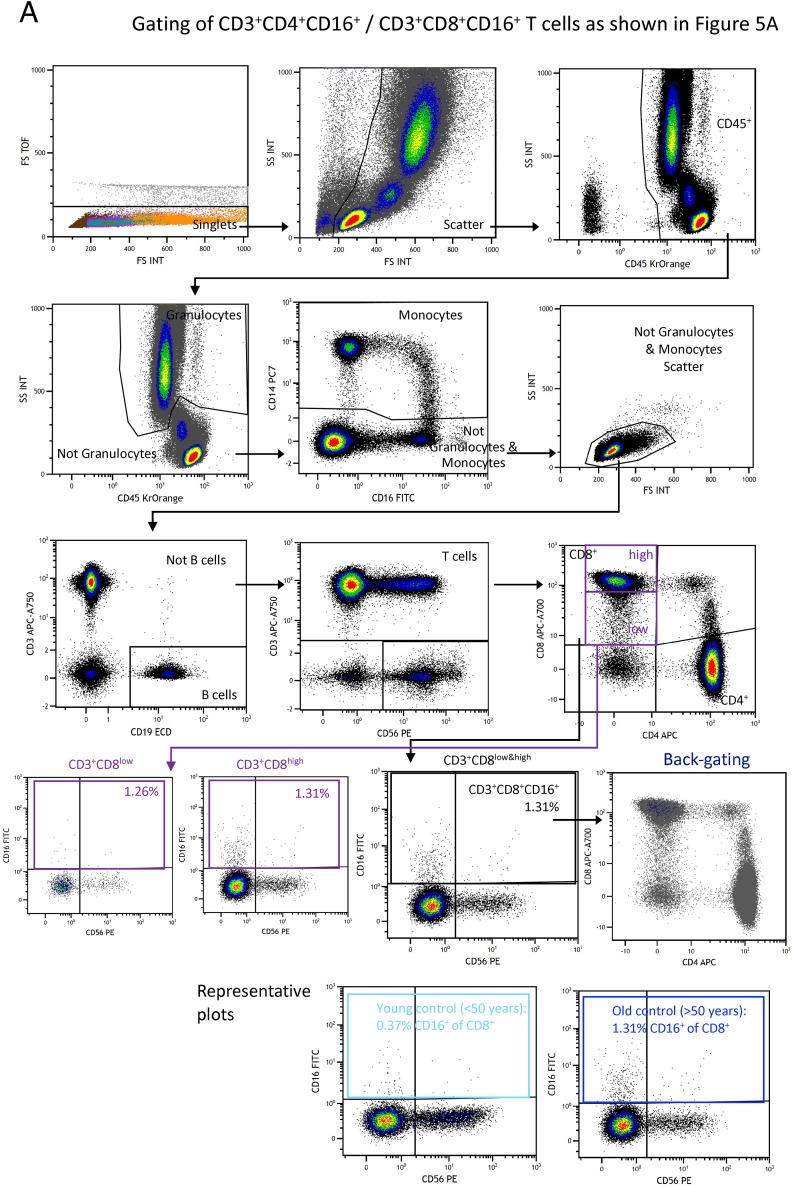
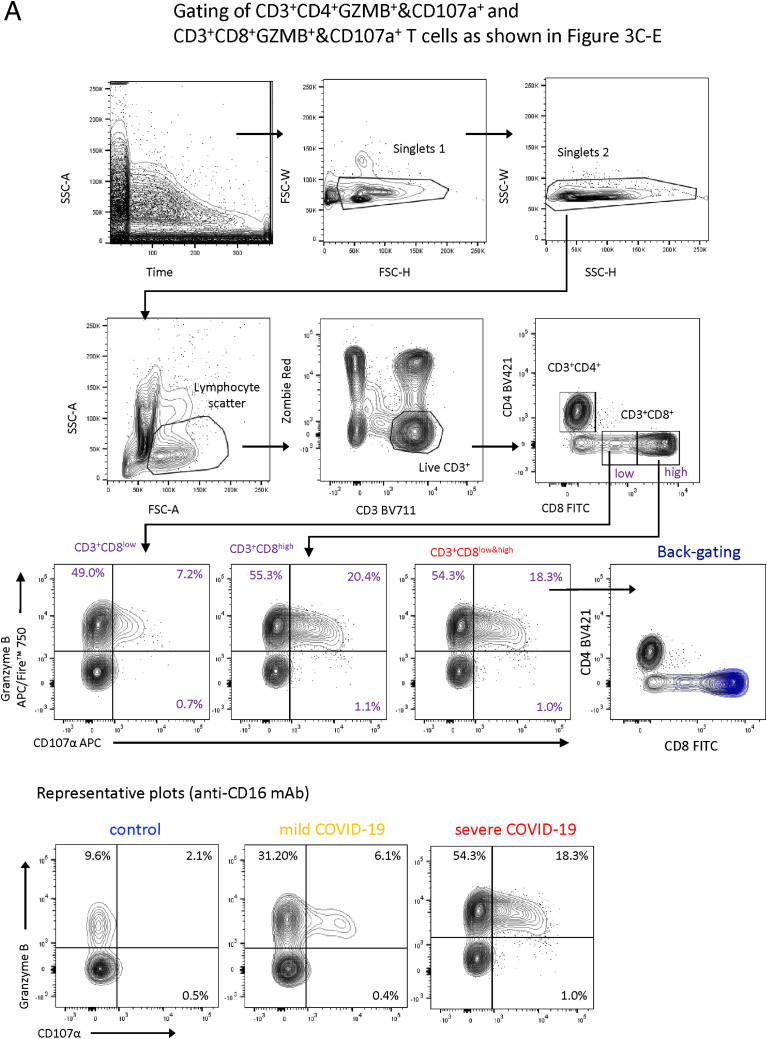
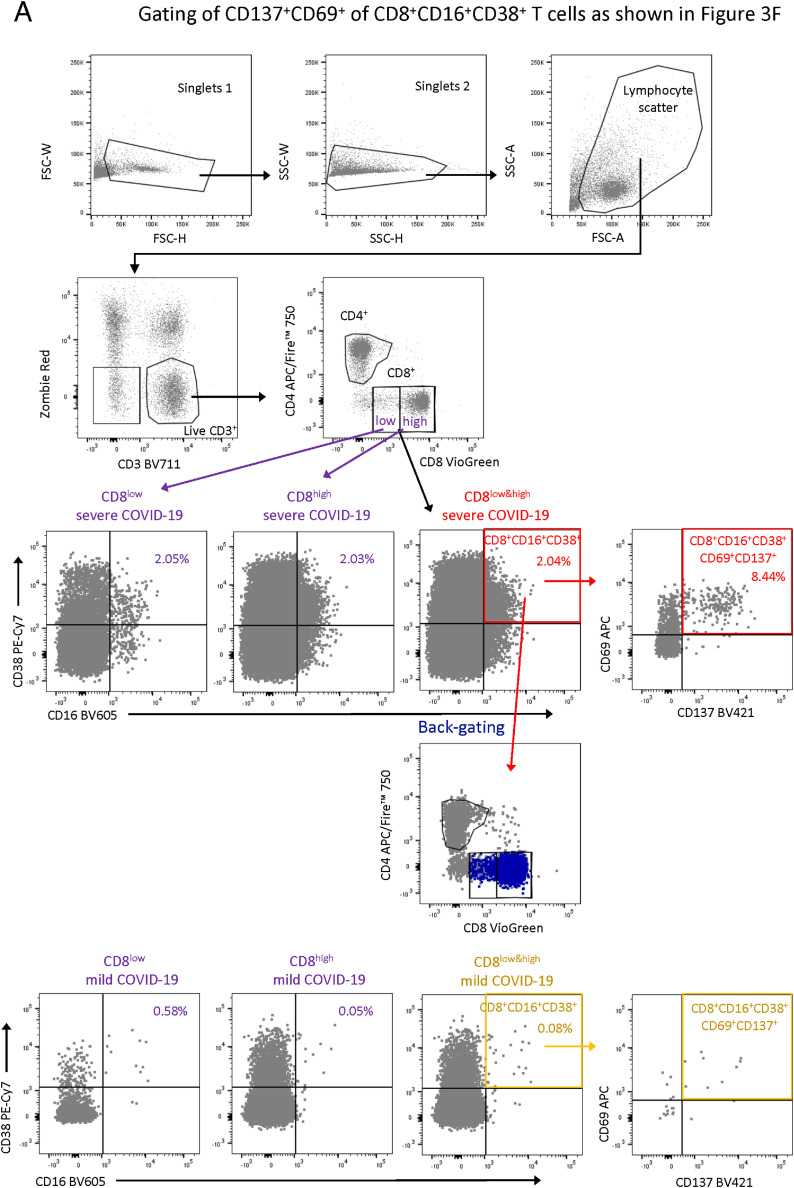
Severe COVID-19 is linked to both dysfunctional immune response and unrestrained immunopathology, and it remains unclear whether T cells contribute to disease pathology. Here, we combined single-cell transcriptomics and single-cell proteomics with mechanistic studies to assess pathogenic T cell functions and inducing signals. We identified highly activated CD16+ T cells with increased cytotoxic functions in severe COVID-19. CD16 expression enabled immune-complex-mediated, T cell receptor-independent degranulation and cytotoxicity not found in other diseases. CD16+ T cells from COVID-19 patients promoted microvascular endothelial cell injury and release of neutrophil and monocyte chemoattractants. CD16+ T cell clones persisted beyond acute disease maintaining their cytotoxic phenotype. Increased generation of C3a in severe COVID-19 induced activated CD16+ cytotoxic T cells. Proportions of activated CD16+ T cells and plasma levels of complement proteins upstream of C3a were associated with fatal outcome of COVID-19, supporting a pathological role of exacerbated cytotoxicity and complement activation in COVID-19.

Keywords: COVID-19; T cells; complement; cytotoxicity; immunopathology.


Conflict of interest statement

Declaration of interests V.M.C. is named together with Euroimmun GmbH on a patent application filed recently regarding SARS-CoV-2 diagnostics via antibody testing. A.R.S. and H.E.M. are listed as inventors on a patent application by the DRFZ Berlin in the field of mass cytometry.

Figures

None
Graphical abstract
Figure 1
Figure 1
Accumulation of HLA-DRhiCD38hi highly activated but also CD16 expressing CD4+ and CD8+ T cells in severe COVID-19 (A) Overview of the study cohort and methodological pipeline. Samples were collected from mild and severe COVID-19 patients during the acute and convalescent phase enrolled in Berlin (cohort 1), Bonn (cohort 2), or Aachen (cohort 3), patients suffering from other acute respiratory infections (FLI, being chronically infected HIV, or HBV, patients with non-infectious ARDS as well as controls. CyTOF and scRNA-seq combined with VDJ-seq-based T cell clonotype identification were used to determine COVID-19 as well as severity-specific alterations in the T cell compartment. The obtained results together with serum proteomics and in situ immunofluorescence data were used to develop hypotheses on their functional properties and inducing mechanisms, which were tested in ex vivo cultures. Detailed sample information included in all reported assays can be found in Table S1. (B and C) UMAPs generated of CD4+ (left), CD8+ (middle), and TCRgd+ (right) T cells from CyTOF. Cells are colored according to donor (B) or cluster (C) origin. For visualization purposes, each UMAP shows 30,000 cells. (D) Heatmap of CyTOF data (covering CD4+ (left panel), CD8+ (middle panel), and TCRgd+ (right panel) T cells. Z score standardized staining intensity of each marker (rows) per cluster (1–48, in columns, lower part). Clusters were grouped into metaclusters, as defined by the numbers 1–13 (in columns, upper part). Significance levels of differential cluster frequency for the following groups: controls (n = 9), FLI (n = 8), HIV (n = 6), HBV (n = 5), mild acute COVID-19 (n = 28), and severe acute COVID-19 (n = 35). Kruskall-Wallis test and post hoc Dunn’s multiple comparison test. All combinations where tested, only comparisons with healthy controls are shown. (E) Box plots of CD4+ (7, 8, 18) and CD8+ (25, 26) T cell clusters determined by CyTOF generated from controls (n = 9), FLI (n = 8), HIV (n = 6), HBV (n = 5), mild acute COVID-19 (n = 20), and severe acute COVID-19 (n = 23) patient samples. Kruskall-Wallis test and post hoc Dunn’s multiple comparison test. KW: adjusted p value (Benjamini-Hochberg) of a Kruskal-Wallis test. All combinations where tested, only comparisons with healthy controls are shown (p < 0.1, ∗∗p < 0.01,∗∗∗p < 0.001,∗∗∗∗p < 0.0001).
Figure S1
Figure S1
Weekly changes in CD4+ and CD8+ T cell cluster composition in mild versus severe COVID-19, related to Figure 1 (A) Percentage of variance in the frequency of activated CD16+ CyTOF clusters C8 and C26 explained by age and severity. (B) Box plots of CD16+HLA-DR+ CD3+ T cells determined by flow cytometry (cohort 2) of samples from controls (n = 11) as well as mild COVID-19 acute (n = 5) and severe COVID-19 acute (n = 9) patients collected during the acute infection (for each donor the first sample available was selected) or samples collected during week two and three post-symptom onset only (right panel, control = 11, mild week 2 = 1, mild week 3+ = 4, severe week 2 = 4, severe week 3+ = 8). KW shows the adjusted p value (Benjamini-Hochberg) of a Kruskal-Wallis test. The abundance of each cluster was compared between severity groups via adjusted Dunn’s post hoc test (Benjamini-Hochberg). (C) UMAPs generated of CD4+ and CD8+ T cells from mass cytometry data of samples from COVID-19 patients collected during week one, two, and three post-symptom onset. Cells are colored according to (left) disease severity (yellow, mild COVID-19 acute phase; red, severe COVID-19 acute phase), and (right) patient ID. (D) Box plots of CD4+ (7, 8, 18) and CD8+ (25, 26) T cell clusters determined by mass cytometry (whole blood, cohort 1) of samples from controls (n = 9), FLI (n = 8), HIV (n = 6), HBV (n = 5) as well as acute mild COVID-19 week 1, (n = 5), week 2 (n = 8), week 3+ (n = 11), and acute severe COVID-19 week 1 (n = 5), week 2 (n = 6), week 3+ (n = 18) patients collected during week 1, 2, and 3 post-symptom onset. KW shows the adjusted p value (Benjamini-Hochberg) of a Kruskal-Wallis test. The abundance of each cluster was compared between severity groups via adjusted Dunn’s (Benjamini-Hochberg) for clusters with KW < 0.1. All combinations where tested, only comparisons with healthy controls and within COVID-19 disease are shown (p < 0.1, ∗∗p < 0.01, ∗∗∗p < 0.001,∗∗∗∗p < 0.0001).
Figure 2
Figure 2
Single-cell transcriptomics of T cells during acute mild and severe COVID-19 (A) UMAP of T cell clusters from controls (n = 6), FLI (n = 8), HBV (n = 4), mild COVID-19 (n = 9), and severe COVID-19 (n = 10) patients. (B) Heatmap showing the Z score standardized gene expression (rows) per T cell cluster (columns). (C and D) UMAPs as shown in (A) with superimposed CD4, CD8A, FCGR3A, MKI67, CD38, and HLA-DRA expression (C), with cells colored according to disease group origin. For visualization purposes, cells were downsampled to 10,000 cells per disease group. (E) Box plots of a selection of scRNA-seq T cell clusters whose abundances are higher in both mild and severe COVID-19 compared with other severity groups (the analyzed number of patients are specified in the legend of ). KW, KW: raw and adjusted p value (Benjamini-Hochberg) of a Kruskal-Wallis test, respectively. (F) Bar plot indicating the negative log2-transformed adjusted p value (Benjamini-Hochberg) of the 20 most significant enriched pathways that are (top) upregulated in mild COVID-19 acute phase, compared with severe COVID-19 acute phase, (bottom) vice versa. Pseudobulk gene expression was calculated per sample among scRNA-seq T cell clusters 7, 8, 9, and 10. (G) Enrichment plots from GSEA performed on the ranked gene list of the comparison severe versus mild COVID-19. The graph shows the mapping of the signature genes on the ranked gene list. The curve corresponds to the running sum of the weighted enrichment score (ES). The ranked gene list was calculated from the normalized pseudobulk expression data of severe and mild COVID-19 acute phase among scRNA-seq T cell clusters 7, 8, 9, and 10. (H) Box plots of the average log2-transformed expression among T cell clusters 7, 8, 9, and 10 from mild (n = 9) and severe (n = 10) COVID-19 acute samples, for three genes included in the cytotoxicity signature (LAMP1, GZMB, and PRF1).
Figure S2
Figure S2
scRNA-seq T cell clusters and their cytotoxic gene signature in samples from COVID-19 patients or patients with other infections, related to Figure 2 (A) Box plots of the percentage of cells in the remaining scRNA-seq T cell clusters generated from controls (n = 6), FLI (n = 8), HBV (n = 4), mild COVID-19 (n = 9), and severe COVID-19 (n = 10) patient samples of cohort 1. KW shows the adjusted p value (Benjamini-Hochberg) of a Kruskal-Wallis test. (B) Box plots of the average log2-transformed expression of all genes defining the cytotoxicity gene signature in cells belonging to clusters 7, 8, 9, and 10, generated from controls (n = 6), FLI (n = 8), HBV (n = 4), mild COVID-19 acute phase (n = 9), and severe COVID-19 acute (n = 10) patient samples of cohort 1. (C) Box plots of the average log2-transformed expression of all genes defining the cytotoxicity gene signature in cells belonging to all T cell clusters generated from controls (n = 6), FLI (n = 8), HBV (n = 4), mild COVID-19 (n = 9), and severe COVID-19 (n = 10) patient samples of cohort 1.
Figure S3
Figure S3
scRNA-seq T cell cluster and their cytotoxic gene signature in samples from COVID-19 patients or controls of cohort 2, related to “scRNA-seq data analysis of Rhapsody data (cohort 2)” in STAR Methods (A) UMAP of the T cell subset from the PBMC dataset of Schulte-Schrepping et al. (2020), including controls (n = 13), mild COVID-19 (n = 21) and severe COVID-19 (n = 29) patients. (B) Heatmap of selected marker expression of the T cell subset from the PBMC dataset of Schulte-Schrepping et al. (2020), including controls (n = 13), mild COVID-19 (n = 21) and severe COVID-19 (n = 29) patients. (C) UMAP of T cell clusters as shown in (A) with cells colored according to disease group origin: blue, controls (n = 13); yellow, mild COVID-19 acute phase (n = 21); red, severe COVID-19 acute phase (n = 29). (D) Box and whisker (10–90 percentile) plots of a selection of cohort 2 scRNA-seq T cell clusters, generated from controls (n = 13), mild COVID-19 acute phase (n = 8) and severe COVID-19 acute phase (n = 9) patient samples. Selected clusters show a TFH phenotype (cluster 6 and 7) or display FCGR3A expression and increased frequency in severe COVID-19 (cluster 10 and 13) generated from controls (n = 13), mild COVID-19 acute phase (n = 8) and severe COVID-19 acute phase (n = 9) patient samples. KW shows the adjusted p value (Benjamini-Hochberg) of a Kruskal-Wallis test. The abundance of each cluster was compared between severity groups via adjusted Dunn’s post hoc test (Benjamini-Hochberg). When multiple samples for the sample patients were available only the earliest sample was used for visualization and statistical testing. All combinations where tested, only comparisons with healthy controls are shown (p < 0.05, ∗∗p < 0.01, ∗∗∗p < 0.001). (E) GSEA performed on the ranked gene list of the comparison severe versus mild COVID-19. The graph shows the mapping of the signature genes on the ranked gene list. The curve corresponds to the running sum of the weighted enrichment score (ES). The ranked gene list was calculated from the normalized pseudobulk expression data of severe and mild samples weeks 1 and 2 post symptoms onset across clusters 6, 7, 10, and 13. (F) Dot plot of the expression of the genes included in the “cytotoxicity” and “response to type I interferon” signatures in control, mild COVID-19, and severe COVID-19 samples in weeks 1 and 2 post symptoms onset across clusters 6, 7, 10, and 13. The dots are colored by the scaled gene expression across the groups and the size is proportional to the ratio of cells expressing the specific gene.
Figure 3
Figure 3
Increased degranulation and cytotoxic potential of T cells from severe COVID-19 (A) Box and whisker (5–95 percentile) plots of SARS-CoV-2-specific IgG and IgA antibody levels detected in serum samples from mild (n = 15) and severe (n = 17) COVID-19 patients collected between day 10 and 14 post symptom onset. Wilcoxon test ∗∗p < 0.01. (B) Linear regression analysis of TFH cell proportions (CyTOF cluster 7) determined in samples collected from mild (n = 8) and severe (n = 11) COVID-19 (cohort 1) during day 5 and 14 post-symptom onset and SARS-CoV-2-specific IgG and IgA serum levels. (C) Box and whisker (min − max) plots summarizing the intracellular granzyme B expression (unstimulated) of CD8+ T cells from PBMCs of mild (n = 21) and severe (n = 28) COVID-19 patients as well as controls (n = 21). Kruskal-Wallis & post hoc Dunn’s multiple comparison test p < 0.05, ∗∗∗p < 0.001. (D) Box and whisker (5–95 percentile) plots summarizing the degranulation capacity of CD8+ T cells from PBMCs of mild (n = 21) and severe (n = 28) COVID-19 patients as well as controls (n = 20) defined by their increase of cell surface CD107a expression upon stimulation with anti-CD16 antibody-coated or isotype-coated beads. Multiple Mann-Whitney test p < 0.05, ∗∗∗p < 0.001. (E) Scatter plot of the degranulation capacity from PBMCs of severe COVID-19 patients (n = 12) upon stimulation with spike-protein-coated beads pre-incubated with control serum, with spike-protein-coated beads pre-incubated with COVID-19 serum or with anti-CD16 antibody-coated beads. Kruskal-Wallis and post hoc Dunn’s multiple comparison test ∗∗∗p < 0.001, ∗∗∗∗p < 0.0001. (F) Enrichment of CD137+CD69+ cells in activated CD16 (CD38+CD16) and activated CD16+ (CD38+CD16+) over the total CD8+ T cell compartment upon restimulation of PBMC samples from mild (n = 5) and severe (n = 7) COVID-19 patients with a SARS-CoV-2 peptide pool. Enrichment was calculated by dividing the proportions of CD137+CD69+ T cells in non-activated CD16 (CD38+CD16) and activated CD16+ (CD38+CD16+) by the proportions of total CD8+ T cells. Friedmann test & post hoc Dunn’s multiple comparison test. p < 0.05, ∗∗p < 0.01. (G) Box and whisker (5–95 percentile) plots summarizing the normalized release of CXCL8 and CCL2 by primary lung endothelial cells co-cultured with CD8+ T cells enriched from PBMCs of mild (n = 6) and severe (n = 5) COVID-19 patients as well as non-infected controls (n = 5) upon stimulation with ConA or anti-CD16 antibody-coated beads. Wilcoxon test p < 0.05. (H) Endothelial cell resistance upon stimulation with ConA alone (n = 5) or additional co-culture with CD8+ T cells enriched from PBMCs of mild (n = 6) and severe (n = 5) COVID-19 patients as well as non-infected controls (n = 5). Kruskal-Wallis test p < 0.05. (I) Representative immunofluorescence staining of CD3 (green) and CD16 (red) in autopsy lung tissues of patients without lung pathology, with COVID-19, ARDS, or influenza pneumonia. (J) Quantification of CD3/CD16 double-positive T lymphocytes per mm2 in the autopsy cohorts of deceased patients without lung pathology (n = 4) compared with COVID-19 (n = 13), ARDS (n = 8) and influenza pneumonia (n = 6). The COVID-19 cohort was separated into early stage (death after 7–14 days after first symptoms), mid stage (15–30 days after symptom onset), and late stage (>35 days). One-way ANOVA; ∗∗, p < 0.01.
Figure 4
Figure 4
Time-dependent evolution and phenotype of T cell clones expanded during acute COVID-19 (A) Percentage of expanded and non-expanded T cell clones in clusters 7, 8, 9, and 10. A cell that has the same clonotype in more than 1 per 1,000 cells over all T cells per patient was considered as an expanded clone (controls, n = 6; FLI, n = 8; HBV, n = 4; mild COVID-19 acute, n = 9; severe COVID-19 acute, n = 10). (B) Percentage of T cell clones from clusters 7, 8, 9, and 10 acute phase found in convalescent samples (mild COVID-19, n = 7; severe COVID-19, n = 6). (C) Flow diagram representing the cluster trajectory of clones present in acute (left) and convalescent (right) COVID-19 (mild, n = 7; severe, n = 6). (D) Percentage of cells in selected clusters for each COVID-19 sample (mild COVID-19, n = 7; severe COVID-19, n = 6). (E) Enrichment plots from GSEA performed for the comparison (left) control versus convalescent COVID-19 (mild and severe), and (right) severe versus mild convalescent COVID-19. (F) Box plots summarizing the percentage of cells belonging to the indicated CD4+ (7, 8, and 19) and CD8+ (25, 26, 29, and 33) CyTOF cluster in samples from mild and severe patients during the acute (mild n = 24, severe n = 29) and convalescent phase (mild n = 11, severe n = 9). KW: adjusted p value (Benjamini-Hochberg) of a Kruskal-Wallis test. All combinations were tested, only comparisons between the acute and convalescent phase within each COVID-19 severity group are shown (p<0.1, ∗∗p < 0.01, ∗∗∗p < 0.001).
Figure 5
Figure 5
C3a promotes differentiation of CD16 expressing highly cytotoxic T cells (A) Box and whisker (5–95 percentile) plots showing the proportions of CD16 expressing CD8+ and CD4+ T cells in whole blood samples of controls (n = 95) according to their age (<50 n = 59, >50 n = 36). Wilcoxon test p < 0.05. (B) Linear regression analysis of age and plasma CFD levels determined by mass spectrometry in samples from Messner et al. (2020). (C) Box and whisker (5–95 percentile) plots summarizing the CFD plasma levels determined by mass spectrometry in samples collected from mild (week 2, n = 5; week 3, n = 7) and severe (week 2, n = 7; week 3, n = 17) COVID-19 patients during week two or three post-symptom onset. Wilcoxon test p < 0.05. Longitudinal changes of plasma C3a and C5a concentrations in samples from mild (n = 12) and severe (n = 17) COVID-19 and FLI (n = 8). Kruskal-Wallis and Dunn’s multiple comparison test ∗∗p < 0.01, ∗∗∗p < 0.001, ∗∗∗∗p < 0.0001. (D) Scatter plots showing the differences in C3a binding capacity of non-naive CD4+ and CD8+ T cells enriched from PBMCs of mild (n = 3) or severe (n = 5) COVID-19 patients or controls (n = 6) determined by flow cytometry. Wilcoxon test p < 0.05. (E) Linear regression for the proportions of T cells belonging to CyTOF cluster 8 or 26 and plasma C3a levels in acute COVID-19 samples (n = 26). (F) Box and whisker (5–95 percentile) plots showing the percentage of CD16 expressing CD4+ and CD8+ T cells upon stimulation of CD3+ T cells from controls with anti-CD3/CD28 antibodies and IL-2 in medium containing serum from mild (n = 19), severe (n = 19) COVID-19 patients or AB serum in the presence or absence of recombinant C3a (n = 8). Wilcoxon test p < 0.05, ∗∗p < 0.01. (G) Scatter plots showing the cell surface CD107a expression level of CD4+ and CD8+ T cells upon stimulation of CD3+ T cells from controls with anti-CD3/CD28 antibodies and IL-2 in medium containing serum from mild (n = 6), severe (n = 6) COVID-19 patients or AB serum (n = 6). Friedmann and Dunn’s multiple comparison test p < 0.05. (H) Scatter plots revealing the changes in the proportions of CD16 expressing CD4+ and CD8+ T cells upon stimulation of CD3+ T cells from controls with anti-CD3/CD28 antibodies and IL-2 in medium containing serum from mild or severe COVID-19 patients upon neutralization of C3a (n = 6). Wilcoxon test p < 0.05.
Figure 6
Figure 6
Proportion of activated CD16+ T cells and plasma complement protein levels is associated with outcome in COVID-19 (A) Subgroup analysis of activated CD16+ T cell proportions according to survival of severe COVID-19 patients. Left panel, illustration summarizing the data analysis, data obtained from severe COVID-19 patients (WHO 5–7) were divided according to patient survival. Right panel, box plots of proportions of activated CD16+TCRab+ T cells determined by CyTOF (cohort 1) generated from controls (n = 9), FLI (n = 8), HIV (n = 6), HBV (n = 5), mild acute COVID-19 (n = 16), severe surviving acute COVID-19 (n = 8) and severe non-surviving acute COVID-19 (n = 7) (Wilcoxon test with Benjamini-Hochberg correction, p < 0.1, ∗∗p < 0.01). (B) Box plots showing plasma expression levels of complement proteins upstream of C3a generation determined by mass spectrometry, which were significantly different between samples from mild (n = 44) and severe (n = 66) COVID-19 patients of cohort 1 (Wilcoxon and post hoc Benjamini-Hochberg test). (C) Subgroup analysis of plasma complement proteins according to worsening of WHO grade. Upper panel, illustration summarizing the data analysis, data obtained from samples of mild and severe COVID-19 samples were divided according to the subsequent WHO grade progression (delta WHO). Lower panel, box plots showing plasma expression levels of complement proteins, which are significantly different between samples from patients with non-worsening WHO grade (n = 91) and worsening WHO grade (n = 19) of mild or severe COVID-19 patients (cohort 1) (Wilcoxon and post hoc Benjamini-Hochberg test). (D) Subgroup analysis of plasma complement expression levels according to survival of severe COVID-19 patients. Box plots showing plasma expression levels of complement proteins upstream of C3a generation, which are significantly different between samples from severe COVID-19 patients (WHO 5–7) who were divided according to patient survival (survivors, n = 48; non-survivors, n = 18) (Wilcoxon and post hoc Benjamini-Hochberg test).
Figure S4
Figure S4
Assignment of CyTOF clusters to COVID-19 convalescent samples, related to Figure 4, survival data of cohort 2, related to Figure 6, and gating strategy of CyTOF data, related to Figure 1 (A) Exemplary graph visualizing the assignment of CD4+ T cells measured during the convalescent phase to CyTOF T cell clusters identified during acute COVID-19. UMAP generated with CD4+ T cells from mass cytometry data, coming from acute (non-COVID-19 and COVID-19) and convalescent COVID-19 samples. (Left) Cells from acute samples are colored according to the cell cluster origin (see legend), whereas cells from convalescent COVID-19 samples have not been assigned to a specific cluster (NA). (Middle) Cells from acute and convalescent COVID-19 samples are colored in red and black, respectively. (Right) Cells from acute and convalescent COVID-19 samples are colored according to the cell cluster, after assigning clusters to cells from convalescent COVID-19 samples via KNN approach. (B) Box plots of CD16+HLA-DR+ CD3+ T cells determined by flow cytometry (cohort 2) of week 2 or 3+ samples from control (n = 11) mild (n = 5) or surviving (n = 3), non-surviving (n = 6) COVID-19 patients collected during the acute infection. The earliest sample (from week 2 on) was selected per patient in case of repeated measurements. The proportions of T cells between severity groups were compared using the Wilcoxon test with Benjamini-Hochberg correction. (C) Proportions of activated FCGR3A+ T cells (from scRNA-seq clusters 10, 13, and 18, cohort 2) within the whole TCRab+ T cell space from control (n = 13) mild (n = 58) or surviving (n = 36), not-surviving (n = 6) severe COVID-19 patients collected during the acute infection. The earliest sample (from week 2 on) was selected per patient in case of repeated measurements. The proportions of T cells between severity groups were compared using the Wilcoxon test with Benjamini-Hochberg correction. (D) Gating of CD3+CD45+CD19CD15 T cells and the three T cell compartments for a representative CyTOF dataset of cohorts 1 prior to clustering, as shown in Figures 1E and S1C.
Figure S5
Figure S5
Representative plots of gating strategy, related to Figure 5A (A) Gating of CD3+CD4+CD16+ and CD3+CD8+CD16+ T cells, as shown in Figure 5A (age-dependent accumulation of CD16+ T cells in controls).
Figure S6
Figure S6
Representative plots of gating strategy, related to Figures 3C–3E (A) Gating of GZMB expression and degranulation/CD107a expression of CD8+ T cells, also discriminationg between CD8low and CD8high cells, as shown in Figures 3C–3E. Especially the CD8high expressing T cells from patients with severe COVID-19 are characterized by increased GZMB expression and degranulation.
Figure S7
Figure S7
Representative plots of gating strategy, related to Figure 3F (A) Gating of CD137+CD69+ of CD8+CD16+CD38+ T cells, also discriminationg between CD8low and CD8high cells, as shown in Figure 3F. Both, CD8low & CD8high expressing T cells from patients with severe COVID-19 contain high proportions of CD16+CD38+ cells.

References

    1. Aibar S., González-Blas C.B., Moerman T., Huynh-Thu V.A., Imrichova H., Hulselmans G., Rambow F., Marine J.-C., Geurts P., Aerts J., et al. SCENIC: single-cell regulatory network inference and clustering. Nat. Methods. 2017;14:1083–1086. - PMC - PubMed
    1. Angerer P., Haghverdi L., Büttner M., Theis F.J., Marr C., Buettner F. destiny: diffusion maps for large-scale single-cell data in R. Bioinformatics. 2016;32:1241–1243. - PubMed
    1. Aran D., Looney A.P., Liu L., Wu E., Fong V., Hsu A., Chak S., Naikawadi R.P., Wolters P.J., Abate A.R., et al. Reference-based analysis of lung single-cell sequencing reveals a transitional profibrotic macrophage. Nat. Immunol. 2019;20:163–172. - PMC - PubMed
    1. Arbore G., West E.E., Rahman J., Le Friec G., Niyonzima N., Pirooznia M., Tunc I., Pavlidis P., Powell N., Li Y., et al. Complement receptor CD46 co-stimulates optimal human CD8+ T cell effector function via fatty acid metabolism. Nat. Commun. 2018;9:4186. - PMC - PubMed
    1. Bagnato G., Harari S. Cellular interactions in the pathogenesis of interstitial lung diseases. Eur. Respir. Rev. 2015;24:102–114. - PMC - PubMed

Publication types

MeSH terms