. 2022 Jan 15;19(1):1.
doi: 10.1186/s12977-022-00587-3.

Reduced and highly diverse peripheral HIV-1 reservoir in virally suppressed patients infected with non-B HIV-1 strains in Uganda

Affiliations

Reduced and highly diverse peripheral HIV-1 reservoir in virally suppressed patients infected with non-B HIV-1 strains in Uganda

Samira Joussef-Piña et al. Retrovirology. .

Abstract

Background: Our understanding of the peripheral human immunodeficiency virus type 1 (HIV-1) reservoir is strongly biased towards subtype B HIV-1 strains, with only limited information available from patients infected with non-B HIV-1 subtypes, which are the predominant viruses seen in low- and middle-income countries (LMIC) in Africa and Asia.

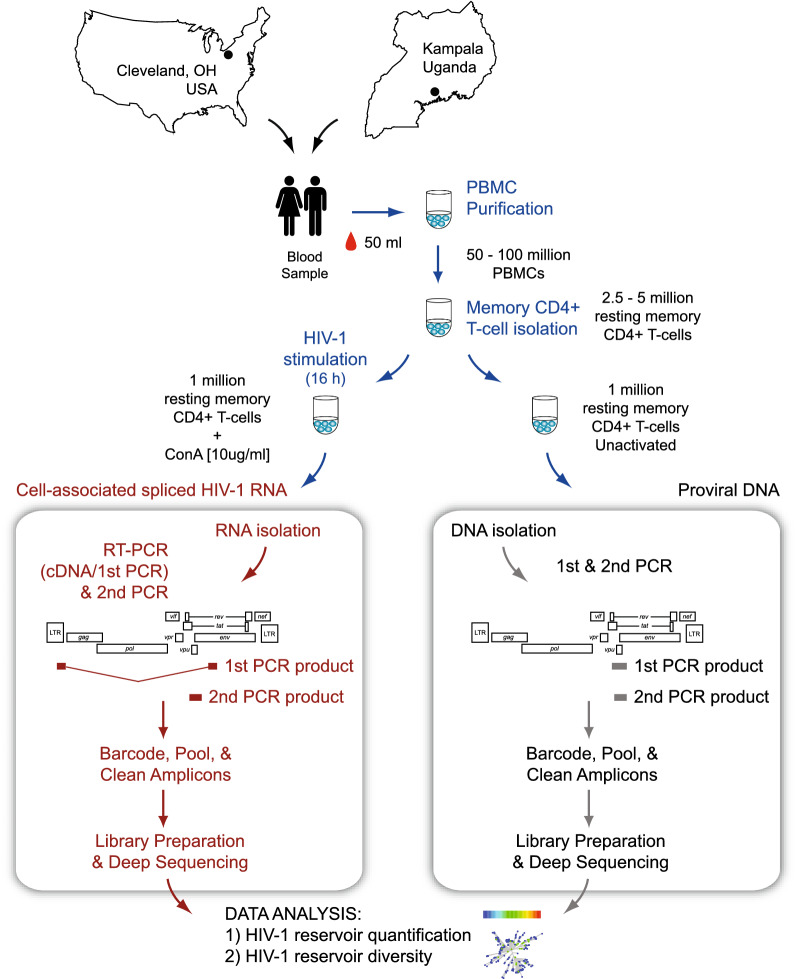
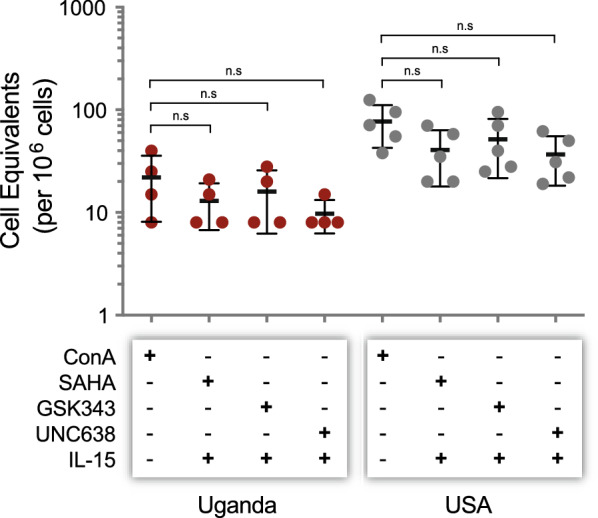
Results: In this study, blood samples were obtained from well-suppressed ART-experienced HIV-1 patients monitored in Uganda (n = 62) or the U.S. (n = 50), with plasma HIV-1 loads < 50 copies/ml and CD4+ T-cell counts > 300 cells/ml. The peripheral HIV-1 reservoir, i.e., cell-associated HIV-1 RNA and proviral DNA, was characterized using our novel deep sequencing-based EDITS assay. Ugandan patients were slightly younger (median age 43 vs 49 years) and had slightly lower CD4+ counts (508 vs 772 cells/ml) than U.S. individuals. All Ugandan patients were infected with non-B HIV-1 subtypes (31% A1, 64% D, or 5% C), while all U.S. individuals were infected with subtype B viruses. Unexpectedly, we observed a significantly larger peripheral inducible HIV-1 reservoir in U.S. patients compared to Ugandan individuals (48 vs. 11 cell equivalents/million cells, p < 0.0001). This divergence in reservoir size was verified measuring proviral DNA (206 vs. 88 cell equivalents/million cells, p < 0.0001). However, the peripheral HIV-1 reservoir was more diverse in Ugandan than in U.S. individuals (8.6 vs. 4.7 p-distance, p < 0.0001).

Conclusions: The smaller, but more diverse, peripheral HIV-1 reservoir in Ugandan patients might be associated with viral (e.g., non-B subtype with higher cytopathicity) and/or host (e.g., higher incidence of co-infections or co-morbidities leading to less clonal expansion) factors. This highlights the need to understand reservoir dynamics in diverse populations as part of ongoing efforts to find a functional cure for HIV-1 infection in LMICs.

Keywords: Co-infection; HIV; Reservoir; Subtype; Uganda.


Conflict of interest statement

The authors report no competing interests.

Figures

Fig. 1
Fig. 1
Overview of the EDITS assay. Blood samples were obtained from HIV-infected individuals in Cleveland, OH, USA and Kampala, Uganda. Peripheral blood mononuclear cells (PBMC) were isolated and CD4+ memory T cells purified, counted and purity verified by flow cytometry. One million CD4+ memory T cells were induced for 16 h with 10 μg/ml of the mitogen Concanavalin A (cell-associated spliced HIV-1 RNA). Total RNA was purified and used as template in a One-Step RT-PCR (external), with primers designed to bind to either side of the HIV-1 Env RNA splice junction, yielding a product of approximately 1.9 kb from the spliced HIV-1 env mRNA. A nested PCR amplification using barcoded primers produced a 369 bp fragment corresponding to vpu/env (HIV-1HXB2 position 6026 to 6394), which was purified, quantified, and deep sequenced (MiSeq Illumina). Reads were analyzed using the DEEPGEN™ Software Tool Suite [51] and converted into the equivalent number of cells harboring HIV-1 per 106 cells using a standard curve as described [32]. The second aliquots of one million CD4+ memory T cells incubated in cell medium alone were used to isolate DNA. External PCR reactions amplified a 584 bp fragment, which was used as template for the nested PCR reaction, library preparation, deep sequencing, and bioinformatics analysis as described for the EDITS assay
Fig. 2
Fig. 2
A Coverage, i.e., number of reads per nucleotide position, obtained by deep sequencing of cell-associated spliced HIV-1 RNA (EDITS assays) and proviral DNA from all Ugandan (n = 62) and U.S. (n = 50) HIV-infected individuals. The position relative to the HIV-1 genome of the vpu/env amplicon amplified in the nested (2nd) PCR reaction is indicated. B Neighbor-joining phylogenetic trees were constructed using the HIV-1 vpu/env consensus sequences generated for each patient-derived virus from deep sequencing reads using DEEPGEN™ Software Tool Suite [51], and rooted using the HIV-1HXB2 sequence (GenBank Accession Number AF033819). Nucleotide sequences from ten HIV-1 strains, two from each one of the HIV-1 subtypes more prevalent in Uganda and/or in the U.S., were used to subtype the patient-derived HIV-1 consensus sequences (A1.AU.03.PS1044_Day0.DQ676872, A1.RW.92.92RW008.AB253421, A2.CD.97.97CDKTB48.AF286238, A2.CM.01.01CM_1445MV.GU201516, B.HXB2_LAI_IIIB_BRU.K03455, B.NL.00.671_00T36.AY423387, C.BR.92.BR025_d.U52953, C.ET.86.ETH2220.U46016, D.CD.83.ELI.K03454, and D.CM.01.01CM_4412HAL.AY371157). HIV-1 subtype-specific clusters are depicted. Bootstrap resampling (1000 data sets) of the multiple alignment tested the statistical robustness of the tree, with percentage values above 75% indicated by an asterisk. s/site, substitutions per nucleotide site
Fig. 3
Fig. 3
Quantification of the peripheral HIV-1 reservoir in patients from Uganda and USA. A The size of the inducible HIV-1 reservoir was determined using memory CD4+ T cells from Ugandan (n = 62) and U.S. (n = 50) patients by measuring cell-associated spliced HIV-1 RNA (EDITS assay). Proviral DNA estimated the number of cells carrying fully or partially activated proviruses. Unpaired t test was used to compare the reservoir size (number of cell equivalents per one million cells) between both cohort of patients. ****p < 0.0001. Median cell equivalents/million cells and interquartile range are depicted. B Comparison of the size of the inducible reservoir (RNA, cell-associated spliced HIV-1 RNA) and the reservoir estimated by quantifying proviral DNA (DNA) in each Ugandan and U.S. patient, as well as the ratio of the size of the peripheral HIV-1 reservoir determined by measuring proviral DNA vs cell-associated spliced RNA (DNA/RNA). Unpaired t test was used to compare the DNA/RNA ratio between Ugandan and U.S. group of patients. ****p < 0.0001; n.s., not significant
Fig. 4
Fig. 4
Effect of different agents to activate the inducible peripheral HIV-1 reservoir. Memory CD4+ T cells from Ugandan (n = 4) and U.S. (n = 5) patients were analyzed with the EDITS assay using, in addition to the standard 10 µg/ml of Concanavalin, a combination of IL-15 50 ng/ml plus SAHA 500 nM, IL-15 50 ng/ml plus GSK343 500 nM, or IL-15 50 ng/ml plus UNC638 500 nM. Unpaired t test was used to compare the reservoir size (number of cell equivalents per one million cells) induced by Concanavalin A vs the combination of agents to induce gene expression. Median cell equivalents/million cells and interquartile range are depicted. n.s., not significant
Fig. 5
Fig. 5
Genetic diversity of the peripheral HIV-1 reservoir in patients from Uganda and the U.S. A Intra-patient HIV-1 diversity of inducible cell-associated spliced HIV-1 RNA and proviral DNA in resting memory CD4+ T cells based on the p-distance model [56]. Unpaired t test was used to assess the statistical significance between the reservoir diversity in both cohorts of patients and between individuals infected with subtype B (U.S.) and non-B (Uganda) HIV-1 subtypes. Median substitutions/site and interquartile range are depicted. ***p < 0.001, ****p < 0.0001, n.s., not significant. B Genetic diversity of the inducible cell-associated spliced HIV-1 RNA and proviral DNA based on the number of viral haplotypes using CliqueSNV (103). Unpaired t test was used to compare the number of unique HIV-1 variants (viral haplotypes) between the reservoir diversity in both cohorts of patients and between individuals infected with subtype B (U.S.) and non-B (Uganda) HIV-1 subtypes. Median substitutions/site and interquartile range are depicted. *p < 0.05, n.s., not significant. C Comparison of the frequency of viral haplotypes in resting memory CD4+ T cells from Ugandan and U.S. patients. Each dot represents the frequency (proportional contribution) of the viral haplotype within the HIV-1 population when present as only one variant in the reservoir (1.0) or part of two or up to a maximum of nine unique sequences (> 0 to < 1) within each sample. Unpaired t test was used to compare the frequency of each viral haplotype present as one or more unique HIV-1 variant in each sample between both cohorts of patients. **p < 0.01, n.s., not significant

Similar articles

Cited by

References

    1. Paredes R, Clotet B. Clinical management of HIV-1 resistance. Antiviral Res. 2010;85(1):245–265. - PubMed
    1. Zolopa AR. The evolution of HIV treatment guidelines: current state-of-the-art of ART. Antiviral Res. 2010;85(1):241–244. - PubMed
    1. Ismail SD, Pankrac J, Ndashimye E, Prodger JL, Abrahams MR, Mann JFS, et al. Addressing an HIV cure in LMIC. Retrovirology. 2021;18(1):21. - PMC - PubMed
    1. Boender TS, Sigaloff KC, McMahon JH, Kiertiburanakul S, Jordan MR, Barcarolo J, et al. Long-term virological outcomes of first-line antiretroviral therapy for HIV-1 in low- and middle-income countries: a systematic review and meta-analysis. Clin Infect Dis. 2015;61(9):1453–1461. - PMC - PubMed
    1. Saksena NK, Potter SJ. Reservoirs of HIV-1 in vivo: implications for antiretroviral therapy. AIDS Rev. 2003;5(1):3–18. - PubMed

Publication types

Substances