. 2022 Jan 15;20(1):27.
doi: 10.1186/s12967-022-03228-7.

Ground truth labels challenge the validity of sepsis consensus definitions in critical illness

Affiliations

Ground truth labels challenge the validity of sepsis consensus definitions in critical illness

Holger A Lindner et al. J Transl Med. .

Abstract

Background: Sepsis is the leading cause of death in the intensive care unit (ICU). Expediting its diagnosis, largely determined by clinical assessment, improves survival. Predictive and explanatory modelling of sepsis in the critically ill commonly bases both outcome definition and predictions on clinical criteria for consensus definitions of sepsis, leading to circularity. As a remedy, we collected ground truth labels for sepsis.

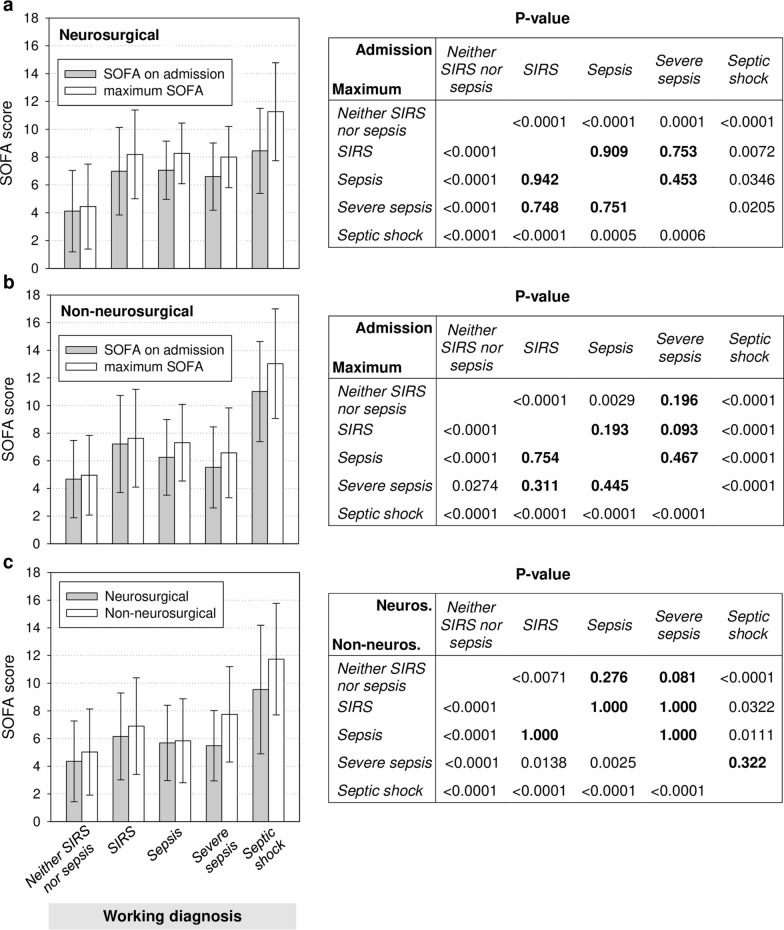
Methods: In the Ground Truth for Sepsis Questionnaire (GTSQ), senior attending physicians in the ICU documented daily their opinion on each patient's condition regarding sepsis as a five-category working diagnosis and nine related items. Working diagnosis groups were described and compared and their SOFA-scores analyzed with a generalized linear mixed model. Agreement and discriminatory performance measures for clinical criteria of sepsis and GTSQ labels as reference class were derived.

Results: We analyzed 7291 questionnaires and 761 complete encounters from the first survey year. Editing rates for all items were > 90%, and responses were consistent with current understanding of critical illness pathophysiology, including sepsis pathogenesis. Interrater agreement for presence and absence of sepsis was almost perfect but only slight for suspected infection. ICU mortality was 19.5% in encounters with SIRS as the "worst" working diagnosis compared to 5.9% with sepsis and 5.9% with severe sepsis without differences in admission and maximum SOFA. Compared to sepsis, proportions of GTSQs with SIRS plus acute organ dysfunction were equal and macrocirculatory abnormalities higher (p < 0.0001). SIRS proportionally ranked above sepsis in daily assessment of illness severity (p < 0.0001). Separate analyses of neurosurgical referrals revealed similar differences. Discriminatory performance of Sepsis-1/2 and Sepsis-3 compared to GTSQ labels was similar with sensitivities around 70% and specificities 92%. Essentially no difference between the prevalence of SIRS and SOFA ≥ 2 yielded sensitivities and specificities for detecting sepsis onset close to 55% and 83%, respectively.

Conclusions: GTSQ labels are a valid measure of sepsis in the ICU. They reveal suspicion of infection as an unclear clinical concept and refute an illness severity hierarchy in the SIRS-sepsis-severe sepsis spectrum. Ground truth challenges the accuracy of Sepsis-1/2 and Sepsis-3 in detecting sepsis onset. It is an indispensable intermediate step towards advancing diagnosis and therapy in the ICU and, potentially, other health care settings.

Keywords: Expert label; Ground truth; Questionnaire survey; SIRS; Sepsis; Sepsis-1/2; Sepsis-3; Suspicion of infection.


Conflict of interest statement

The authors declare that they have no conflict of interest.

Figures

Fig. 1
Fig. 1
Flow diagram of Ground Truth for Sepsis Questionnaire (GTSQ) survey
Fig. 2
Fig. 2
SOFA scores for complete encounters by working diagnosis (Item 3). SOFA scores on admission (gray) and maximum SOFA scores during ICU treatment (white) are represented as mean values (bars) with standard deviations (whiskers). The table shows p-values from the Mann–Whitney-U test for all between-working diagnosis differences in on-admission and maximum SOFA scores, respectively, above and below the diagonal, p-values from t-tests were consistent. The absence of statistical significance is highlighted by bold print of p-values
Fig. 3
Fig. 3
Working diagnosis label distribution in GTSQs from complete encounters by encounter working diagnosis (Item 3). Data include missing labels and is represented as stacked bar chart
Fig. 4
Fig. 4
Distribution of working diagnosis labels (Item 3) during 34 days of follow-up for complete encounters. a Label frequencies and b prevalence. c Color map representation of label sequences and suspicion of infection for 109 incident (left) and 205 present-on-admission (right) sepsis cases. Encounters are sorted by descending length. For each day of follow-up, a rectangle colored as indicated in the legend identifies the working diagnosis (Item 3) and concurrent suspicion of infection with a non-sepsis label (Item 4). A black rectangular subsequent to the last expected rating indicates death in the ICU during this or the next rating interval, or beyond day 34
Fig. 5
Fig. 5
Alluvial plots for day-to-day working diagnosis transitions (Item 3). The day of the first sepsis diagnosis label for all 109 incident sepsis cases in complete encounters is shown on the right and labels for the preceding day on the left
Fig. 6
Fig. 6
Upset plot of the four most frequent acute organ dysfunction labels at the GTSQ level (Item 9). Frequencies for all possible combinations of organ dysfunction labels are displayed as gray shaded bars: no label (white), one label (light gray), two labels (gray), three labels (dark gray) and four labels (black). Horizontal bars represent cumulative numbers
Fig. 7
Fig. 7
Degrees of organ dysfunction across all edited GTSQs by working diagnosis (Item 3). a All between-working diagnosis differences for the proportions of all GTSQs with more than one acute organ dysfunction (Item 9) were statistically significant (p < 0.001 from Chi-squared test). b The same applied to the SOFA scores (p < 0.005 from a generalized linear mixed model) except, as indicated by the p-values, for the SIRS versus sepsis and SIRS versus sever sepsis comparisons. SOFA scores are displayed as mean values (bars) with standard deviations (whiskers). c Absolute numbers of GTSQs with a concurrent SOFA score of 0 (white bars) and 1 (gray bars) and their combined proportions (black dots) are plotted together for each working diagnosis. The proportions in c are connected by lines to aid visual comparison between working diagnoses
Fig. 8
Fig. 8
Individual acute organs dysfunction labels (Item 9) by working diagnosis (Item 3). Proportions of all GTSQs with any (black line-symbol) and with specific (colored line-symbol) acute organ dysfunctions for a all causes and c infectious causes by working diagnosis. b The numbers of encounters underlying the proportions for all cause organ dysfunctions in a. Data points are connected by lines to aid visual comparison between working diagnoses
Fig. 9
Fig. 9
Concurrent labelling of focus localization and acute organ dysfunction. Venn diagram showing the relationships between the groups of GTSQs with a positive label for acute organ dysfunction of infectious (rose) and non-infectious (blue) cause (Item 9) and for a positive focus localization label (yellow) (Item 5)
Fig. 10
Fig. 10
Co-occurrence of acute organ dysfunction (Item 9) and focus localization (Item 5) labels. The frequencies of all GTSQs with a combination of a label for lung, kidney, brain, heart or gastrointestinal dysfunction (rose spheres) and a thoracic, abdominal, bone/joint, skin, or intracranial/meningeal focus localization (cyan spheres) are indicated in the respective Venn diagrams. The bar charts at the right summarize the overlaps of the combinations as proportions of dysfunction labels by organ and at the bottom as proportions of focus localization labels by localization. Because varying numbers of organs could be labelled as dysfunctional and various numbers of localizations be identified as foci, the sum of the bars shown may exceed 100%. And because only a selection of dysfunctions and localizations is shown, the sum may not reach 100%
Fig. 11
Fig. 11
Co-occurrence of circulatory problems and acute organ dysfunction. Venn diagrams of GTSQ labels for acute organ dysfunction (Item 9), macrocirculatory abnormalities (Item 7), and microcirculatory dysfunction (Item 8). Acute dysfunction of any organ is shown on top and, separately, for the four most prevalent acute organ dysfunctions below
Fig. 12
Fig. 12
Working diagnosis distributions in a subgroup analysis. Radar chart of working diagnosis (Item 3) distributions for a 364 neurosurgical (red) and 392 non-neurosurgical (blue) referrals (encounter level) and b 2892 neurosurgical and 4391 non-neurosurgical GTSQs (GTSQ level)
Fig. 13
Fig. 13
SOFA scores for neurosurgical and non-neurosurgical referrals by working diagnosis (Item 3). Mean values for SOFA scores (bars) with standard deviations (whiskers) on admission (gray) and for maximum SOFA scores (white) from complete encounters are shown for a neurosurgical and b non-neurosurgical referrals. The tables to the right show the corresponding p-values from the Mann–Whitney-U test for all between-working diagnosis differences in on-admission and maximum SOFA scores, respectively, above and below the diagonal. c Mean SOFA scores (bars) ± standard deviations (whiskers) of all edited GTSQs are displayed for neurosurgical (gray) and non-neurosurgical (white) referrals. The table shows p-values from a generalized linear mixed model for all between-working diagnosis differences in neurosurgical and non-neurosurgical referrals, respectively, above and below the diagonal. In the tables (ac), the absence of statistically significance is highlighted by p-values printed in bold
Fig. 14
Fig. 14
Individual acute organ dysfunction labels by working diagnosis (Item 3) in the subgroup analysis. The proportions of all GTSQs with any (black line-symbol) and with specific (colored line-symbol) organ dysfunctions are plotted by working diagnosis for all causes in a neurosurgical and b in non-neurosurgical referrals. Data points are connected by lines to aid visual comparison between working diagnoses
Fig. 15
Fig. 15
Comparison of clinical criteria to ground truth labels for detection of the first sepsis episode. Sepsis onset in our 761 complete encounters was determined according to clinical criteria (computer icon) for Sepsis-1/2 (SIRS) and Sepsis-3 (SOFA ≥ 2). This point was compared to the first occurrence of a GTSQ label for sepsis (cross icon) considering either all three sepsis categories together or only severe sepsis and septic shock. a Identifies the four scenarios and according ratings, based on which agreement and test performance were evaluated. b Enumerates the results of the comparisons and the statistical measures of agreement and test performance. The 95% confidence intervals for all test performance measures were within ± 7%. PPV positive predictive value, NPV negative predictive value

References

    1. Rudd KE, Johnson SC, Agesa KM, Shackelford KA, Tsoi D, Kievlan DR, et al. Global, regional, and national sepsis incidence and mortality, 1990–2017: analysis for the Global Burden of Disease Study. Lancet. 2020;395(10219):200–211. doi: 10.1016/S0140-6736(19)32989-7. - DOI - PMC - PubMed
    1. van Vught LA, Klein Klouwenberg PM, Spitoni C, Scicluna BP, Wiewel MA, Horn J, et al. Incidence, risk factors, and attributable mortality of secondary infections in the intensive care unit after admission for sepsis. JAMA. 2016;315(14):1469–1479. doi: 10.1001/jama.2016.2691. - DOI - PubMed
    1. Sakr Y, Jaschinski U, Wittebole X, Szakmany T, Lipman J, Namendys-Silva SA, et al. Sepsis in intensive care unit patients: worldwide data from the Intensive Care over Nations audit. Open Forum Infect Dis. 2018;5(12):ofy313. doi: 10.1093/ofid/ofy313. - DOI - PMC - PubMed
    1. Kumar A, Roberts D, Wood KE, Light B, Parrillo JE, Sharma S, et al. Duration of hypotension before initiation of effective antimicrobial therapy is the critical determinant of survival in human septic shock. Crit Care Med. 2006;34(6):1589–1596. doi: 10.1097/01.CCM.0000217961.75225.E9. - DOI - PubMed
    1. Gaieski DF, Mikkelsen ME, Band RA, Pines JM, Massone R, Furia FF, et al. Impact of time to antibiotics on survival in patients with severe sepsis or septic shock in whom early goal-directed therapy was initiated in the emergency department. Crit Care Med. 2010;38(4):1045–1053. doi: 10.1097/CCM.0b013e3181cc4824. - DOI - PubMed

Publication types