Meta-Analysis
. 2022 Jun 1;49(6):383-397.
doi: 10.1097/OLQ.0000000000001601. Epub 2022 Jan 13.

Risk of Human Immunodeficiency Virus Acquisition Among High-Risk Heterosexuals With Nonviral Sexually Transmitted Infections: A Systematic Review and Meta-Analysis

Affiliations
Meta-Analysis

Risk of Human Immunodeficiency Virus Acquisition Among High-Risk Heterosexuals With Nonviral Sexually Transmitted Infections: A Systematic Review and Meta-Analysis

Erin K Barker et al. Sex Transm Dis. .

Abstract

Background: Nonviral sexually transmitted infections (STIs) increase risk of sexually acquired human immunodeficiency virus (HIV) infection. Updated risk estimates carefully scrutinizing temporality bias of studies are needed.

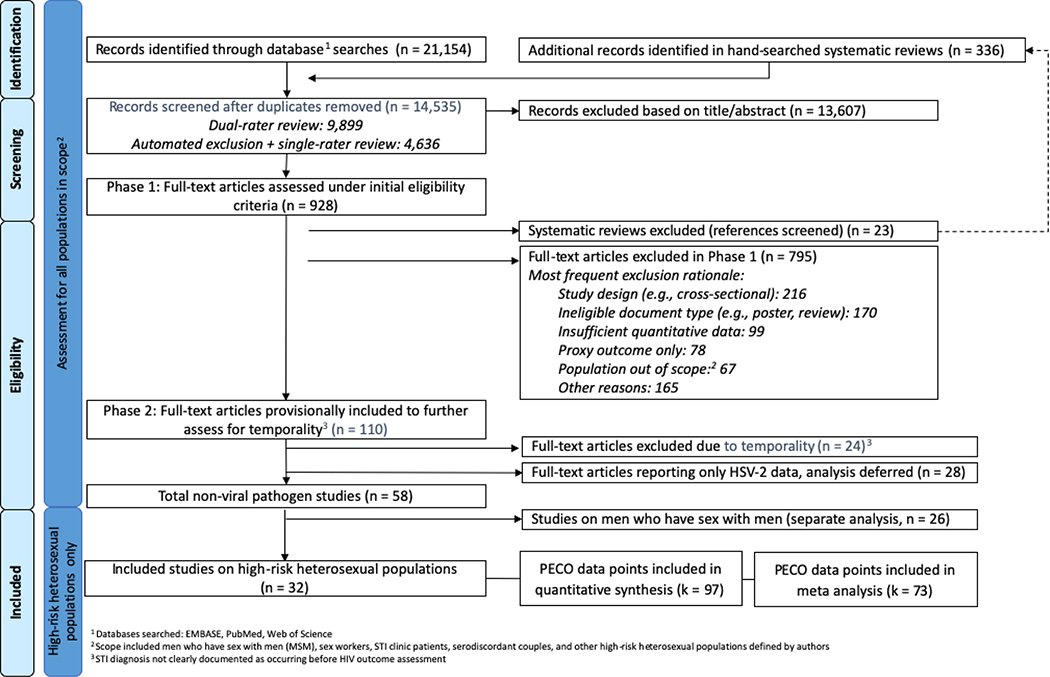
Methods: We conducted a systematic review (PROSPERO CRD42018084299) of peer-reviewed studies evaluating variation in risk of HIV infection among high-risk heterosexuals diagnosed with any of: Chlamydia trachomatis, Mycoplasma genitalium, Neisseria gonorrhoeae, Treponema pallidum, and/or Trichomonas vaginalis. We searched PubMed, Web of Science, and Embase databases through December 2017 and included studies where STIs and HIV were assessed using laboratory tests or medical examinations and where STI was diagnosed before HIV. After dual screening, data extraction, and risk of bias assessment, we meta-analytically pooled risk ratios (RRs).

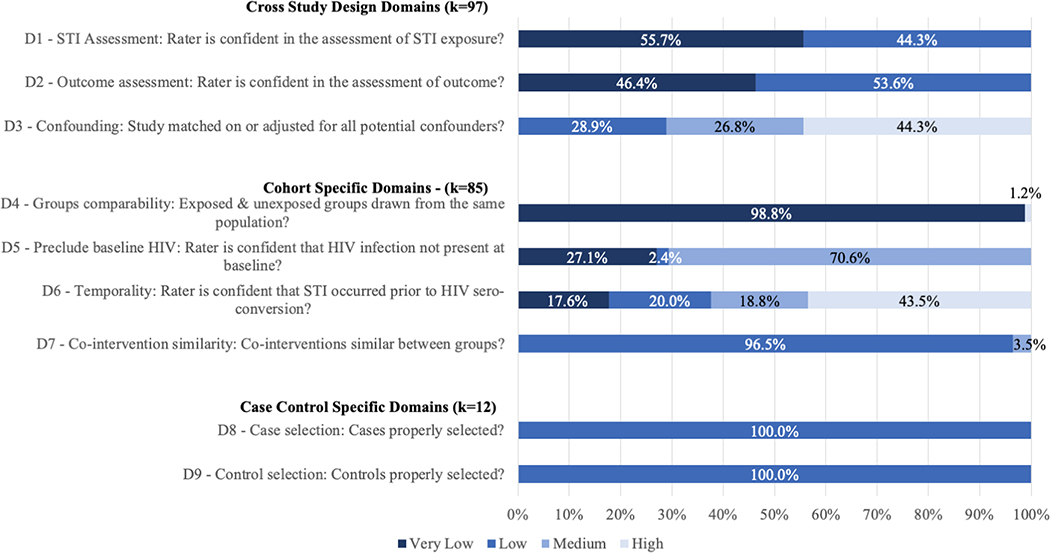
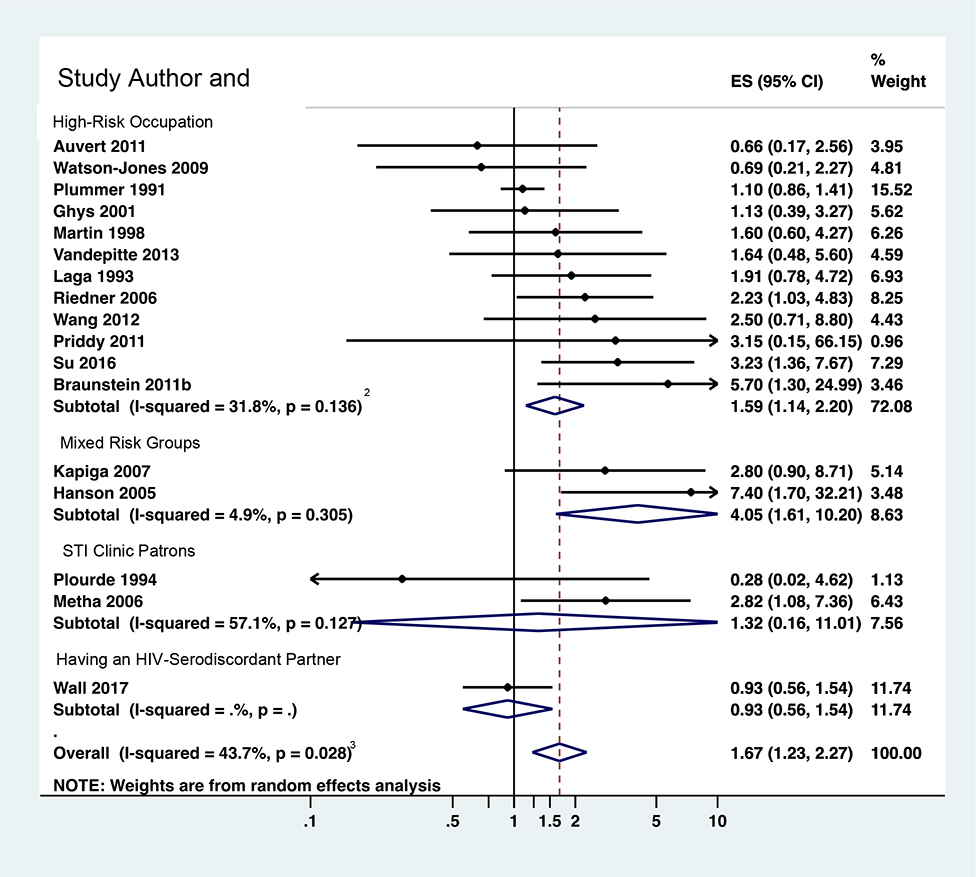
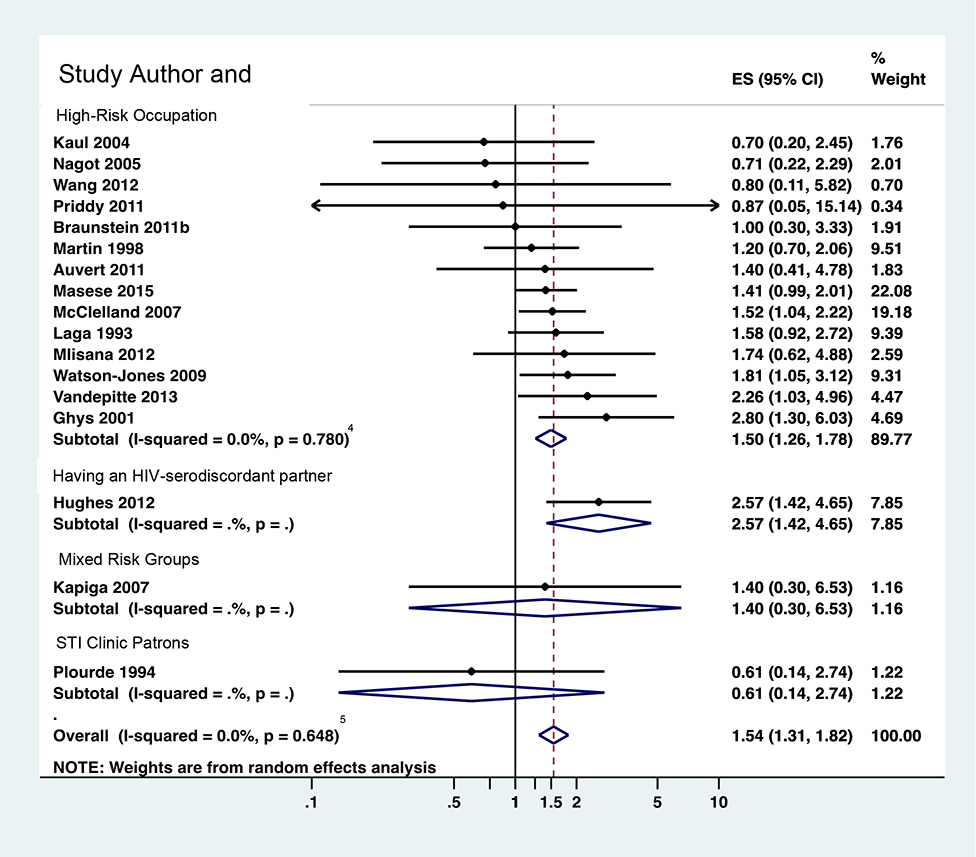
Results: We found 32 eligible studies reporting k = 97 effect size estimates of HIV acquisition risk due to infection with one of the abovementioned STIs. Most data were based on women engaged in sex work or other high-risk occupations in developing countries. Many studies did not measure or adjust for known confounders, including drug injection and condom use, and most were at medium or high risk of bias because of the potential for undetected HIV infection to have occurred before STI infection. Human immunodeficiency virus acquisition risk increased among women infected with any pathogen; the effect was greatest for women infected with Mycoplasma genitalium (RR, 3.10; 95% confidence interval [CI], 1.63-5.92; k = 2) and gonorrhea (RR, 2.81; 95% CI, 2.25-3.50; k = 16) but also statistically significant for women infected with syphilis (RR, 1.67; 95% CI, 1.23-2.27; k = 17), trichomonas (RR, 1.54; 95% CI, 1.31-1.82; k = 17), and chlamydia (RR, 1.49; 95% CI, 1.08-2.04; k = 14). For men, data were space except for syphilis (RR, 1.77; 95% CI, 1.22-2.58; k = 5).

Conclusion: Nonviral STI increases risk of heterosexual HIV acquisition, although uncertainty remains because of risk of bias in primary studies.


Conflict of interest statement

Conflict of Interest: None declared.

Figures

Figure 1.
Figure 1.. Identification and screening of bibliographic records for systematic review of the effect of nonviral STI diagnosis on the risk of HIV seroconversion among high-risk heterosexuals (search up to January 2018)
Figure 2.
Figure 2.. Assessment of risk of bias for effect-size-level data (k=97) on the effect of nonviral sexually transmitted infection diagnosis on the risk of HIV acquisition among high-risk heterosexuals.
Figures 3a to 3d.
Figures 3a to 3d.. Forest plots for risk ratios for nonviral STI diagnosis and risk of HIV acquisition among female high-risk heterosexuals1
Figure 3a: RR for syphilis diagnosis and risk of HIV acquisition among female high-risk heterosexuals (k=17) Figure 3b: RR for trichomonas vaginalis diagnosis and risk of HIV acquisition among female high-risk heterosexuals (k-17) Figure 3c: RR for gonorrhea diagnosis and risk of HIV acquisition among female high-risk heterosexuals (k=16) Figure 3d: RR for chlamydia diagnosis and risk of HIV acquisition among female high-risk heterosexuals (k=14) 1Where studies reported multiple effect sizes for the same population-pathogen pairing, estimates and sensitivity analysis (SA) risk ratio (RR) ranges above reflect higher-quality data (i.e., multivariate-adjusted vs unadjusted and/or shorter duration of follow-up). SA RR ranges for lower-quality data are reported in footnotes. 2Syphilis-high-risk occupation SA RR range: 1.40–1.83. Removing the following studies changed RR ≥0.05: Auvert 2011: 1.67 (1.19, 2.34); Braunstein 2011: 1.45 (1.09, 1.94); Ghys 2001: 1.65 (1.15, 2.37); Plummer 1991: 1.83 (1.32, 2.56); Riedner 2006: 1.52 (1.07, 2.15); Su 2016: 1.40 (1.05, 1.87); Watson-Jones 2009: 1.68 (1.20, 2.36). RR when lower-quality effect size was substituted from Braunstein 2011 was 1.42 (1.09, 1.84); when substituted from Vandepitte 2013 was 1.54 (1.16, 2.06) 3Syphilis overall SA RR range: 1.56–1.82. Removing the following studies changed RR ≥0.05: Auvert 2011: 1.74 (1.27, 2.39); Braunstein 2011: 1.58 (1.18, 2.13); Ghys 2001: 1.73 (1.25, 2.39); Hanson 2005: 1.56 (1.17, 2.07); Metha 2006: 1.61 (1.18, 2.20); Plummer 1991: 1.81 (1.29, 2.54); Su 2016: 1.57 (1.16, 2.13); Wall 2017: 1.82 (1.30, 2.54); Watson-Jones 2009: 1.75 (1.28, 2.40). RR when lower-quality effect size was substituted for Braunstein 2011 was 1.58 (1.19, 2.10). 4Trichomoniasis high-risk occupation SA RR range: 1.44–1.53. RR when lower-quality effect size was substituted from Braunstein 2011 was 1.44 (1.21, 1.72). 5Trichomoniasis overall SA RR range: 1.48–1.58. 6Gonorrhea high-risk occupation SA RR range: 2.60–3.13.. Removing the following studies changed RR ≥0.05: Ghys 2001: 2.71 (2.16, 3.41); Kaul 2004: 2.77 (2.19, 3.51); Laga 1993: 2.75 (2.12, 3.56); Martin 1998: 2.97 (2.37, 3.72); Masese 2015: 3.13 (2.45, 4.00); Ramjee 2005: 2.94 (2.30, 3.76); Vandepitte 2013: 2.60 (2.09, 3.23). RR when lower-quality effect size was substituted from Vandepitte 2013 was 2.61 (2.11, 3.24). 7Gonorrhea overall SA RR range: 2.58–3.05. Removing the following studies changed RR ≥0.05: Ghys 2001: 2.69 (2.16, 3.35); Kaul 2004: 2.74 (2.19, 3.43); Laga 1993: 2.71 (2.12, 3.46); Martin 1998: 2.94 (2.36, 3.67); Masese 2015: 3.05 (2.42, 3.84); Ramjee 2005: 2.89 (2.29, 3.65); Vandepitte 2013: 2.58 (2.1, 3.18). RR when lower-quality effect size was substituted from Vandepitte 2013 was 2.62 (2.15, 3.19). 8Chlamydia high-risk occupation SA RR range: 1.37–1.70. Removing the following studies changed RR ≥0.05: Auvert 2011 1.70 (1.31, 2.21); Kaul 2004: 1.40 (0.98, 2.00); Laga 1993: 1.37 (0.94, 2.02); Nagot 2005: 1.69 (1.24, 2.29); Plummer 1991: 1.44 (0.95, 2.17); Vandepitte 2013: 1.43 (0.97, 2.1); Watson-Jones 2009: 1.38 (0.96, 2.00). 9Chlamydia overall SA RR range: 1.37, 1.69. Removing the following studies changed RR ≥0.05: Auvert 2011: 1.68 (1.29, 2.17); Kaul 2004: 1.41 (1.02, 1.95); Laga 1993: 1.37 (0.97, 1.94); Nagot 2005: 1.69 (1.28, 2.22); Plummer 1991: 1.43 (0.98, 2.08); Vandepitte 2013: 1.42 (1.00, 2.02); Watson-Jones 2009: 1.39 (0.99, 1.94). RR when lower-quality effect size was substituted from Kapiga 2007 was 1.60 (1.12, 2.29).

References

    1. Newman L, Rowley J, Vander Hoorn S, et al. Global Estimates of the Prevalence and Incidence of Four Curable Sexually Transmitted Infections in 2012 Based on Systematic Review and Global Reporting. PLoS One 2015; 10(12): e0143304. - PMC - PubMed
    1. Wasserheit JN. Epidemiological synergy. Interrelationships between human immunodeficiency virus infection and other sexually transmitted diseases. Sexually transmitted diseases 1992; 19(2): 61–77. - PubMed
    1. Rottingen JA, Cameron DW, Garnett GP. A systematic review of the epidemiologic interactions between classic sexually transmitted diseases and HIV: how much really is known? Sexually transmitted diseases 2001; 28(10): 579–97. - PubMed
    1. Sexton J, Garnett G, Rottingen JA. Metaanalysis and metaregression in interpreting study variability in the impact of sexually transmitted diseases on susceptibility to HIV infection. Sexually transmitted diseases 2005; 32(6): 351–7. - PubMed
    1. Freeman EE, Weiss HA, Glynn JR, Cross PL, Whitworth JA, Hayes RJ. Herpes simplex virus 2 infection increases HIV acquisition in men and women: systematic review and meta-analysis of longitudinal studies. AIDS (London, England) 2006; 20(1): 73–83. - PubMed

Publication types