. 2022 Jul;29(7):1364-1378.
doi: 10.1038/s41418-021-00925-6. Epub 2022 Jan 16.

TLR4 downregulation by the RNA-binding protein PUM1 alleviates cellular aging and osteoarthritis

Affiliations

TLR4 downregulation by the RNA-binding protein PUM1 alleviates cellular aging and osteoarthritis

Dong Suk Yoon et al. Cell Death Differ. 2022 Jul.

Erratum in

Abstract

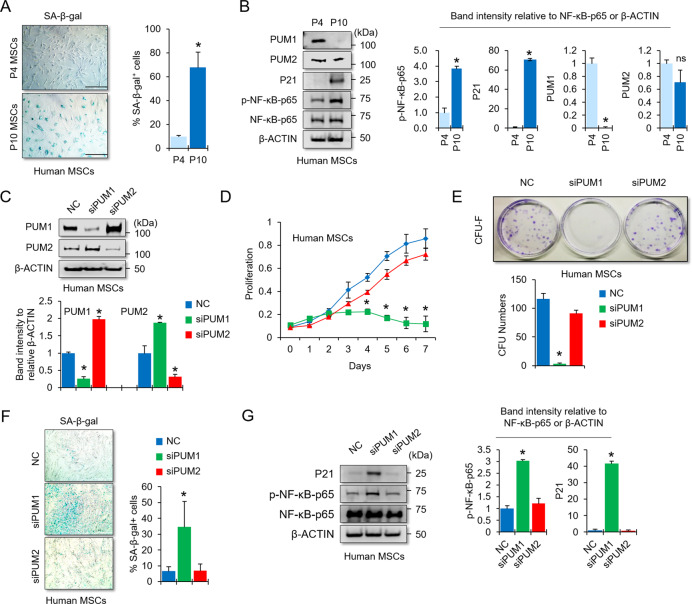
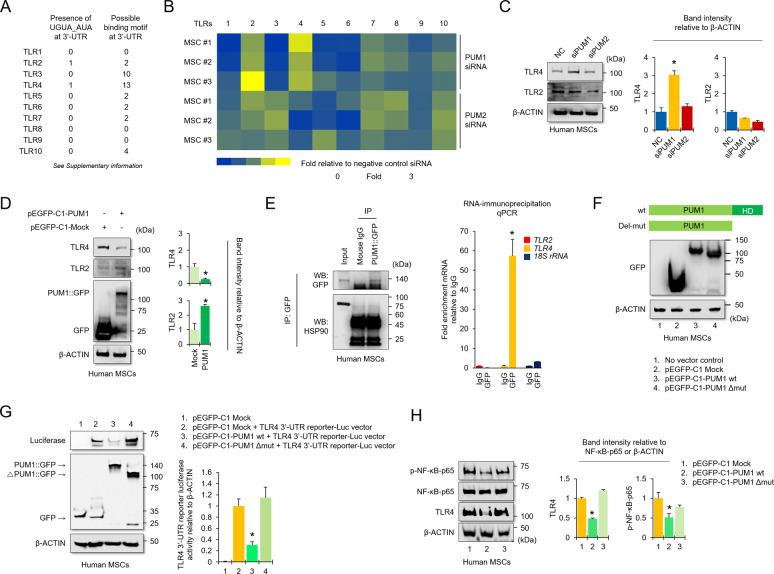
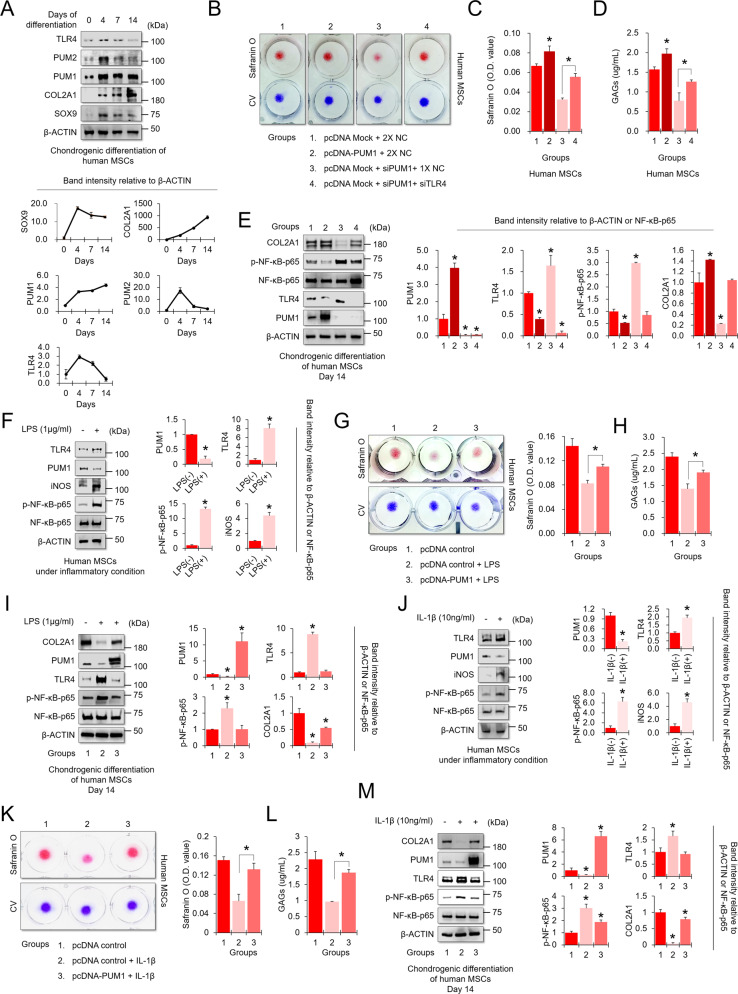
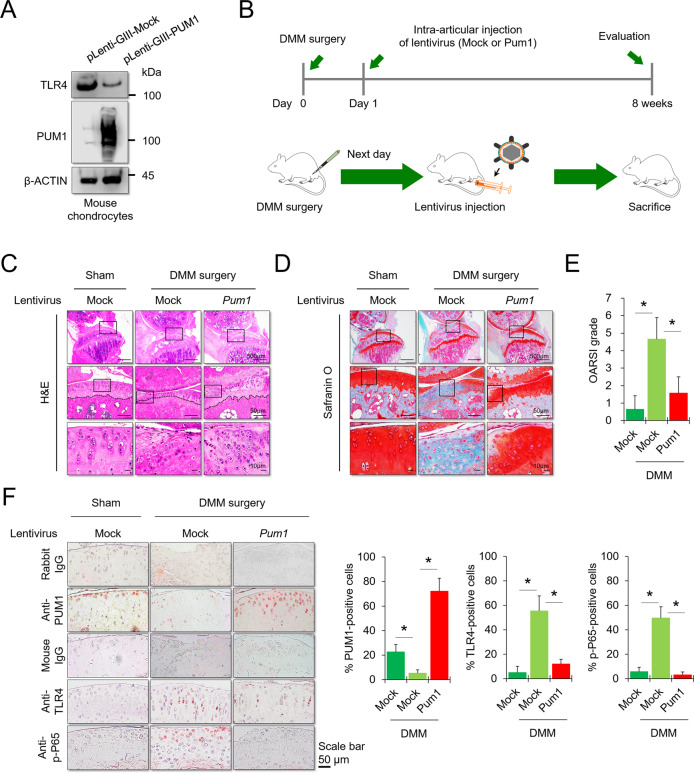
Dysfunction of mRNA or RNA-binding proteins (RBPs) causes cellular aging and age-related degenerative diseases; however, information regarding the mechanism through which RBP-mediated posttranscriptional regulation affects cellular aging and related disease processes is limited. In this study, PUM1 was found to be associated with the self-renewal capacity and aging process of human mesenchymal stem cells (MSC). PUM1 interacted with the 3'-untranslated region of Toll-like receptor 4 (TLR4) to suppress TLR4 mRNA translation and regulate the activity of nuclear factor-κB (NF-κB), a master regulator of the aging process in MSCs. PUM1 overexpression protected MSCs against H2O2-induced cellular senescence by suppressing TLR4-mediated NF-κB activity. TLR4-mediated NF-κB activation is a key regulator in osteoarthritis (OA) pathogenesis. PUM1 overexpression enhanced the chondrogenic potential of MSCs even under the influence of inflammation-inducing factors, such as lipopolysaccharide (LPS) or interleukin-1β (IL-1β), whereas the chondrogenic potential was reduced following the PUM1 knockdown-mediated TLR4 activation. PUM1 levels decreased under inflammatory conditions in vitro and during OA progression in human and mouse disease models. PUM1 knockdown in human chondrocytes promoted chondrogenic phenotype loss, whereas PUM1 overexpression protected the cells from inflammation-mediated disruption of the chondrogenic phenotype. Gene therapy using a lentiviral vector encoding mouse PUM1 showed promise in preserving articular cartilage integrity in OA mouse models. In conclusion, PUM1 is a novel suppressor of MSC aging, and the PUM1-TLR4 regulatory axis represents a potential therapeutic target for OA.


Conflict of interest statement

The authors declare no competing interests.

Figures

Fig. 1
Fig. 1. KD of PUM1 induces cellular senescence in mesenchymal stem cells.
A Early (passage 4) or late (passage 10) passage MSCs were stained with SA-β-gal (blue), and the intensity of SA-β-gal-positive staining in the cell population showed an increase in late passage MSCs. Scale bar = 350 μm. B Protein levels of PUM1, PUM2, and cellular senescence-related markers were analyzed in early and late passage MSCs using western blotting. C Protein levels of PUM1 and PUM2 were analyzed using western blotting in MSCs transfected with siRNA for negative control (NC), PUM1, or PUM2. D The cell proliferation assay was used to determine the proliferative capacities of negative control, PUM1, and PUM2 siRNA-transfected MSCs using the EZ-Cytox Kit. Each experiment was performed in triplicate (n = 3). *P < 0.05 in a comparison with NC siRNA-transfected cells. E The number of colony-forming cells was counted, and the average size of the colonies was measured in triplicate by three independent observers (n = 3). *P < 0.05 in a comparison with NC siRNA-transfected MSCs. F SA-β-gal staining was used to determine the extent of cellular senescence in the NC, PUM1, and PUM2 siRNA-treated MSCs. The SA-β-gal assay was performed 1 week after the MSCs were seeded onto a six-well plate. The SA-β-gal positive cells were quantified using ImageJ (n = 3, in triplicate). *P < 0.05 in a comparison with NC siRNA-transfected MSCs. Scale bar = 350 μm. G Protein levels of the senescence-related markers were analyzed in MSCs using western blotting in cells transfected with NC, PUM1, or PUM2 siRNAs.
Fig. 2
Fig. 2. PUM1 interacts with the TLR4 mRNA and downregulates NF-κB activity in MSCs.
A List of 3ʹ-UTRs for human Toll-like receptors (TLRs). Left panel indicates PBEs with the exact sequences (UGUA_AUA), whereas right panel means PBEs with possible binding motifs. (Source: https://genome.ucsc.edu/). B A heatmap was generated for real-time quantitative PCR data using RNA extracted from MSCs transfected with a single siRNA targeting PUM1 or PUM2. The results were compared to the group transfected with negative control (NC) siRNAs (n = 3 experimental replicates). C Protein levels for TLR2 and TLR4 were analyzed in MSCs using western blotting for cells transfected with NC, PUM1, or PUM2 siRNA. D Protein levels for PUM1::GFP, TLR2, and TLR4 were analyzed in MSCs using western blotting for cells transfected with the pEGFP-C1 vector control having no insert or the pEGFP-C1-PUM1 vector. E Blot data showed that PUM1::GFP-Immunoprecipitation was successful, and HSP90 was used as a loading control for the input group. The bar graph displays the RIP-qPCR fold enrichment of the indicated mRNAs relative to the IgG control. RIP was performed in MSCs transfected with the pEGFP-C1-PUM1 vector using electroporation with the Neon transfection system. *P < 0.05 in a comparison with the IgG control (n = 3 experimental replicates). F The protein level for GFP was analyzed in MSCs using western blotting in cells that were transfected with the pEGFP-C1 vector control with no insert, the pEGFP-C1-PUM1 vector, or pEGFP-C1-PUM1 mutant vector lacking the RNA-binding domain (ΔPUM1-HD). G Protein levels of GFP and luciferase were analyzed in HEK293T cells transduced with the TLR4 3’-UTR reporter-Luc vector. The cells were selected using puromycin (10 µg/mL) and transfected with the pEGFP-C1 vector control with no insert, the pEGFP-C1-PUM1 vector, or the pEGFP-C1-ΔPUM1-HD vector, and the cells were analyzed by western blot analysis to compare the luciferase activities between the groups. *P < 0.05 compared with the pEGFP-C1 vector control with no insert (n = 3 experimental replicates). H Protein levels for TLR4, P65, and p-P65 were analyzed in MSCs using western blotting in cells transfected with pEGFP-C1 vector control with no insert, the pEGFP-C1-PUM1 vector, or pEGFP-C1-ΔPUM1-HD.
Fig. 3
Fig. 3. PUM1 overexpression alleviates H2O2-induced cellular senescence.
A Representative SA-β-gal (green fluorescence) staining images of MSCs indicate senescent cells. B The bar graph indicates the percentage of SA-β-gal positive cells. The images were photographed and counted by the Countess II FL Automated Cell Counter. *P < 0.05 compared to the no H2O2 group (n = 3 experimental replicates). C The bar graph indicates the fluorescence-based activity of SA-β-gal. The fluorescence was measured at 360 nm/465 nm (excitation/emission). *P < 0.05 compared to the no H2O2 group (n = 3 experimental replicates). D Protein levels of PUM1, TLR4, and the senescence-related markers were analyzed in MSCs treated or untreated with H2O2 (200 μM) using western blotting. E Representative EdU (green) staining images of MSCs indicate a decrease in cell proliferation by H2O2 treatment. DAPI (blue) staining was performed to visualize all nuclei of the cells tested. The bar graph shows quantification (%) of the EdU-positive cell population. F MSCs were transfected with negative control siRNA, pcDNA control with no insert, pcDNA-PUM1, or siRNA targeting TLR4. The cells were subsequently cultured for 4 days with or without H2O2 (200 μM). Representative SA-β-gal (green fluorescence) staining images of MSCs indicate senescent cells. G The bar graph indicates the percentage of SA-β-gal positive cells. *P < 0.05 compared with the no H2O2 group (n = 3 experimental replicates). H The bar graph indicates the fluorescence-based activity of SA-β-gal. *P < 0.05 compared with the no H2O2 group (n = 3 experimental replicates). (I) Protein levels of PUM1, TLR4, and the senescence-related markers were analyzed in MSCs treated or untreated with H2O2 (200 μM) using western blotting. J Representative EdU (green) staining images of MSCs indicate a change in cell proliferation in the H2O2-treated MSCs. DAPI (blue) staining was performed to visualize all nuclei of the cells tested. The bar graph shows quantification (%) of the EdU-positive cell population. K The vector-transfected MSCs (1 × 103 cells per 100 mm dish) were maintained for 12 days with or without H2O2 in a 20% FBS-containing medium. The colony-forming abilities of the cells were analyzed via crystal violet (CV) staining. The bar graph indicates the colony numbers of the MSCs tested.
Fig. 4
Fig. 4. PUM1 overexpression preserves the high chondrogenic potential of MSCs in an inflammatory environment.
A MSCs were maintained in a chondrogenic medium in high-density culture conditions (dot culture in 1 × 105 cells per dot) for 4, 7, or 14 days. Undifferentiated MSCs were used as day 0 control. The protein levels of PUM1, PUM2, TLR4, and chondrogenic markers were analyzed in MSCs during MSC chondrogenesis. B MSCs were transfected with pcDNA control vector with no insert, pcDNA-PUM1 expression vector, negative control siRNA, or siRNAs targeting PUM1 and TLR4. The cells were maintained in a chondrogenic medium in high-density culture conditions for 14 days. Safranin O staining was performed to detect glycosaminoglycans (GAGs). C Stained cells were destained with 10% cetylpyridinium for quantitative analysis. The absorbance was measured at 490 nm. *P < 0.05 compared to groups 1 and 3 (n = 3 experimental replicates). D GAG content was measured using the Blyscan sulfate GAG assay. The sulfated GAGs were quantified in the supernatant and standardized using a chondroitin 4-sulfate standard solution. *P < 0.05 compared to groups 1 and 3 (n = 3 experimental replicates). E The expression levels of PUM1, TLR4, P65, p-P65, and COL2A1 were analyzed in chondrogenic MSCs by western blotting analysis of the cells transfected with pcDNA control vector with no insert, pcDNA-PUM1 expression vector, negative control siRNA, or siRNAs targeting PUM1 and TLR4. F MSCs were maintained in growth medium in high-density culture conditions (dot culture in 1 × 105 cells per dot), with or without LPS (1 μg/mL), for two days. The expression levels of PUM1, TLR4, P65, p-P65, and iNOS were analyzed in MSCs under LPS-induced inflammatory conditions. G MSCs were transfected with a pcDNA control vector with no insert or pcDNA-PUM1 expression vector. The cells were maintained in a chondrogenic medium under high-density culture conditions with or without LPS (1 μg/mL) for 14 days. Safranin O staining was performed to detect glycosaminoglycans (GAGs). Stained cells were destained with 10% cetylpyridinium for quantitative analysis. Absorbance was measured at 490 nm. *P < 0.05 compared to groups 1 and 3 (n = 3 experimental replicates). H The GAG contents were measured using the Blyscan sulfate GAG assay. The sulfated GAGs were quantified in the supernatant and standardized using a chondroitin 4-sulfate standard solution. *P < 0.05 compared to group 2 (n = 3 experimental replicates). I The expression levels of PUM1, TLR4, P65, p-P65, and COL2A1 were analyzed with western blotting analysis of the MSCs treated with or without LPS (1 μg/mL). J MSCs were maintained in growth medium under high-density culture conditions (dot culture in 1 × 105 cells per dot), with or without IL-1β (10 ng/mL), for 2 days. The expression levels of PUM1, TLR4, P65, p-P65, and iNOS were analyzed in MSCs under IL-1β-induced inflammatory conditions. K MSCs were transfected with a pcDNA control vector with no insert or pcDNA-PUM1 expression vector. The cells were maintained in a chondrogenic medium under high-density culture conditions, with or without IL-1β (10 ng/mL), for 14 days. Safranin O staining was performed to detect glycosaminoglycans (GAGs). Stained cells were destained with 10% cetylpyridinium for quantitative analysis. Absorbance was measured at 490 nm. *P < 0.05 compared to groups 1 and 3 (n = 3 experimental replicates). L The GAG contents were measured using the Blyscan sulfate GAG assay. The sulfated GAGs were quantified in the supernatant and standardized using a chondroitin 4-sulfate standard solution. *P < 0.05 compared to group 2 (n = 3 experimental replicates). M The expression levels of PUM1, TLR4, P65, p-P65, and COL2A1 were analyzed with western blotting analysis of the MSCs treated with or without IL-1β (10 ng/mL).
Fig. 5
Fig. 5. PUM1 and TLR4 are inversely detected in the inflammatory environment in vitro and human OA cartilage tissues.
A The SA-β-gal staining (Scale bar = 350 μm) and (B) western blot analysis during passaging of primary chondrocytes. The expression levels of PUM1, PUM2, TLR4, COL2A1, and COL1A1 (one of the dedifferentiation markers in primary chondrocytes) were analyzed in primary chondrocytes by western blot analysis. C The expression levels of PUM1, TLR4, P65, p-P65, and COL2A1 were analyzed in cells from the human chondrocyte cell line TC28a2 treated with LPS (5 μg/mL), using western blot analysis. LPS treatment was maintained for five days. D The expression levels of PUM1, TLR4, P65, p-P65, and COL2A1 were analyzed in cells from the human chondrocyte cell line TC28a2 treated with IL-1β (10 ng/mL), using western blot analysis. IL-1β treatment was maintained for five days. E Representative images of safranin O/fast green staining and PUM1 and TLR4 immunostaining in intact and damaged cartilage tissues from patients with OA. Scale bar = 200 μm or 100 μm. F Quantification (%) of PUM1- or TLR4-positive cells from total cell population per field in immunohistochemical sections. G The expression levels of PUM1, TLR4, and COL2A1 were analyzed in primary chondrocytes isolated from cartilage tissues of human patients with OA, using western blot analysis. The obtained cartilage tissues were divided into intact or damaged parts, and then the tissues were minced, homogenized, and lysed. H The mRNA levels of PUM1 and TLR4 were analyzed in human primary chondrocytes isolated in cartilage tissues from OA patients, using reverse transcription-qPCR. The human cartilage tissues were divided into intact or damaged, and the tissues were then incubated with type 2 collagenase to isolate chondrocytes.
Fig. 6
Fig. 6. PUM1 protects chondrocytes from inflammation, and NORAD may be an upstream regulator of the PUM1-TLR4 axis.
A TC28a2 cells were transfected with pEGFP-C1 control vector with no insert, the pEGFP-C1-PUM1 expression vector, negative control (NC) siRNA, or siRNAs targeting PUM1 and TLR4. The cells were maintained under the LPS (5 μg/mL)-induced inflammatory condition for five days. Safranin O staining was performed to detect glycosaminoglycans (GAGs). The stained cells were destained with 10% cetylpyridinium for quantitative analysis. The absorbance was measured at 490 nm. *P < 0.05 compared to groups 1 and 4 (n = 3 experimental replicates). B The expression levels of PUM1, TLR4, P65, p-P65, and COL2A1 were analyzed in TC28a2 cells in LPS-induced inflammatory conditions using western blotting. C TC28a2 cells were transfected with pEGFP-C1 control vector with no insert, the pEGFP-C1-PUM1 expression vector, NC siRNA, or siRNAs targeting PUM1 and TLR4. The cells were maintained under the IL-1β (10 ng/mL)-induced inflammatory condition for five days. Safranin O staining was performed to detect glycosaminoglycans (GAGs). The stained cells were destained with 10% cetylpyridinium for quantitative analysis. The absorbance was measured at 490 nm. *P < 0.05 compared to the groups 1 or 4 (n = 3 experimental replicates). D The expression levels of PUM1, TLR4, P65, p-P65, and COL2A1 were analyzed in TC28a2 cells under IL-1β-induced inflammatory conditions using western blotting. NORAD mRNA levels were examined in the (E) LPS- or (F) IL-1β-treated TC28a2 cells using reverse qPCR. G NORAD mRNA levels were also measured using RNA samples extracted from primary chondrocytes of OA patients (n = 3 experimental replicates). H RIP was performed in TC28a2 cells transfected with the pEGFP-C1-PUM1 vector. PUM1-IP was confirmed with western blot analysis, and HSP90 was used to confirm the presence of the input sample. The bar graph displays the RIP-qPCR fold enrichment of the indicated mRNAs relative to the IgG control. *P < 0.05 in comparison with the IgG control (n = 3 experimental replicates). (I) Reverse transcription-qPCR was performed to confirm the transfection efficiency of NORAD siRNA (100 nM). The expression levels of PUM1, TLR4, P65, p-P65, and COL2A1 were analyzed in NC siRNA- or NORAD siRNA-transfected TC28a2 cells under (J) LPS- or (K) IL-1β-induced inflammatory conditions, using western blotting. *P < 0.05 in comparison with group 2 (n = 3 experimental replicates).
Fig. 7
Fig. 7. Gene therapy with a lentiviral vector encoding PUM1 in a mouse model for OA.
A Protein levels of mouse PUM1 and TLR4 were analyzed in the mouse chondrocyte ATDC5 cell line infected with a lentiviral vector encoding pLenti-GiII-Mock or -mouse PUM1 gene. B Schematic of the time course used for the DMM-induced in vivo osteoarthritis experiments. The following figures indicate histological analyses of the changes in joints after DMM surgery. C H&E staining was performed to observe the cell morphology and tissue integrity in the articular cartilage tissues of the mouse knee undergoing DMM surgery. The figures located at the top show the extent of damage to the entire cartilage tissue in the weight-bearing area of the medial tibial plateau. The middle and bottom figures show the extent of damage and the morphology of chondrocytes in the contact area of the weight-bearing region between the medial tibial plateau and the medial femoral condyle. Scale bar = 500, 100, or 10 μm. D Likewise, Safranin O and fast green staining of articular cartilage tissues from mice that underwent sham or DMM surgery is indicated. Scale bar = 500, 100, or 10 μm. Safranin O and fast green staining demonstrated OA progression through the 8-week time course in the medial tibial plateau. E OARSI scores of the medial tibial plateau of DMM mice (Sham-Mock, n = 6; DMM-Mock, n = 6; DMM-PUM1, n = 6). Data are expressed as means, and the error bars indicate the standard deviation. F Representative images for PUM1 (red), TLR4 (red), and p-P65 (red) immunostaining in cartilage tissues obtained from sham or DMM mouse knees (Sham-Mock, n = 6; DMM-Mock, n = 6; DMM-PUM1, n = 6). Scale bar = 50 μm. The bar graphs show quantification (%) of the PUM1-, TLR4-, or p-P65-positive cells from total cell population per field, in immunohistochemical sections.

References

    1. Gupta PK, Das AK, Chullikana A, Majumdar AS. Mesenchymal stem cells for cartilage repair in osteoarthritis. Stem Cell Res Ther. 2012;3:25. doi: 10.1186/scrt116. - DOI - PMC - PubMed
    1. Hu L, Yin C, Zhao F, Ali A, Ma J, Qian A. Mesenchymal stem cells: cell fate decision to osteoblast or adipocyte and application in osteoporosis treatment. Int J Mol Sci. 2018;19:360. doi: 10.3390/ijms19020360. - DOI - PMC - PubMed
    1. Veronesi F, Torricelli P, Borsari V, Tschon M, Rimondini L, Fini M. Mesenchymal stem cells in the aging and osteoporotic population. Crit Rev Eukaryot Gene Expr. 2011;21:363–77. doi: 10.1615/CritRevEukarGeneExpr.v21.i4.60. - DOI - PubMed
    1. Lee WY, Wang B. Cartilage repair by mesenchymal stem cells: clinical trial update and perspectives. J Orthop Transl. 2017;9:76–88. - PMC - PubMed
    1. Kabat M, Bobkov I, Kumar S, Grumet M. Trends in mesenchymal stem cell clinical trials 2004-2018: Is efficacy optimal in a narrow dose range? Stem Cells Transl Med. 2020;9:17–27. doi: 10.1002/sctm.19-0202. - DOI - PMC - PubMed

Publication types