. 2022 Aug;29(8):1552-1568.
doi: 10.1038/s41418-022-00935-y. Epub 2022 Jan 15.

Loss of circadian gene Timeless induces EMT and tumor progression in colorectal cancer via Zeb1-dependent mechanism

Affiliations

Loss of circadian gene Timeless induces EMT and tumor progression in colorectal cancer via Zeb1-dependent mechanism

Tommaso Colangelo et al. Cell Death Differ. 2022 Aug.

Abstract

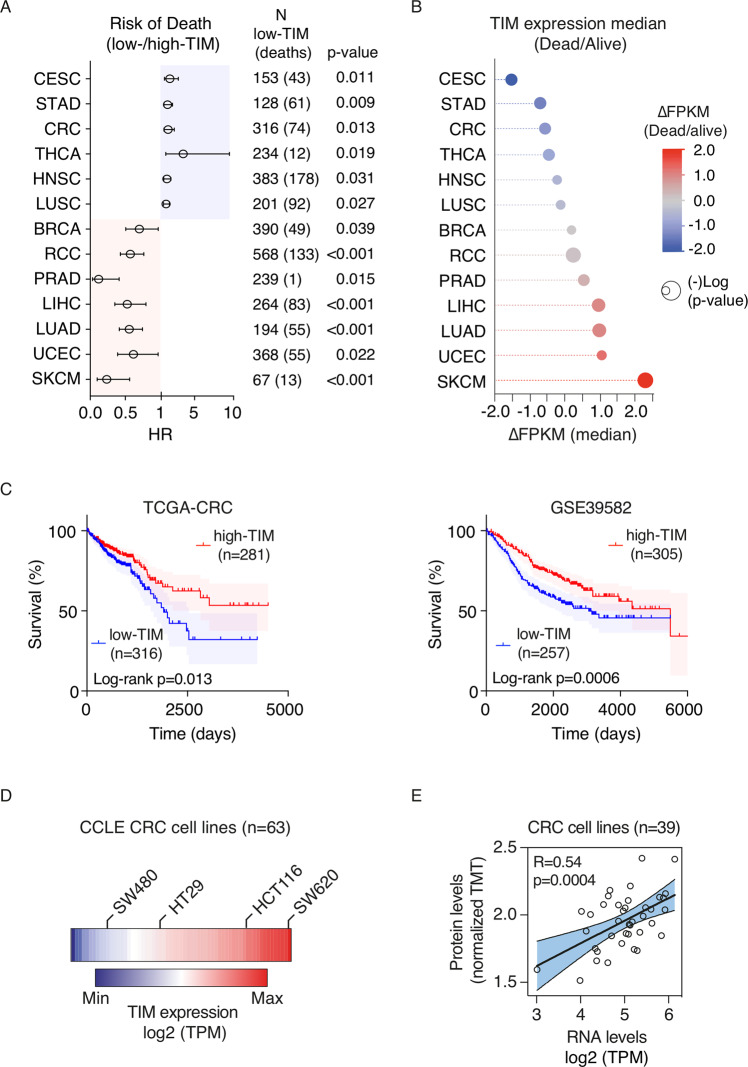
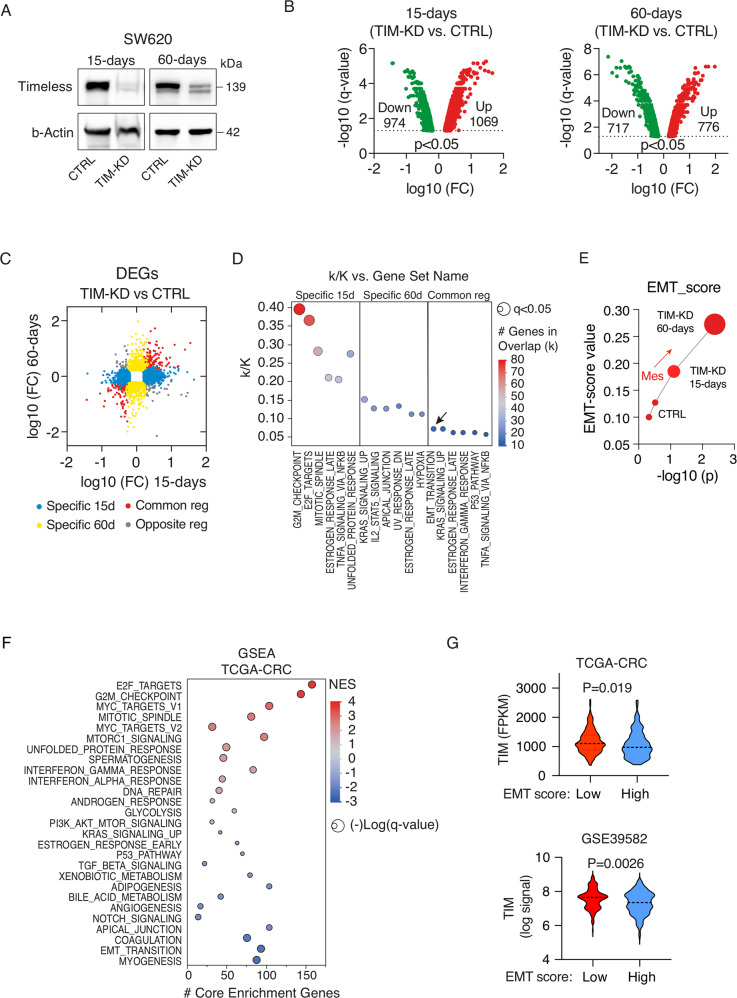
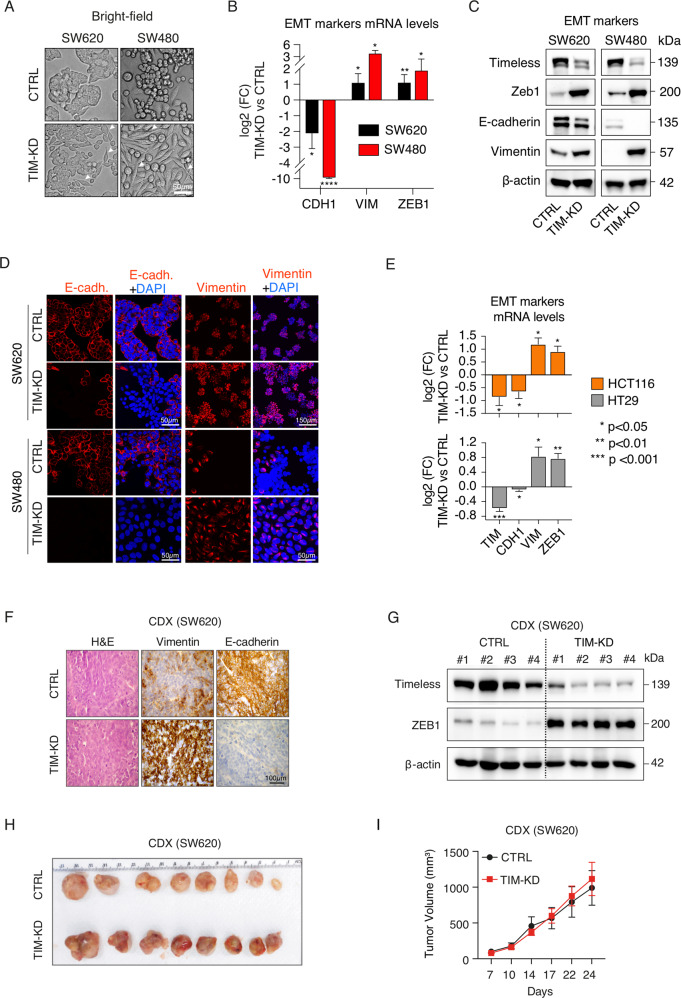
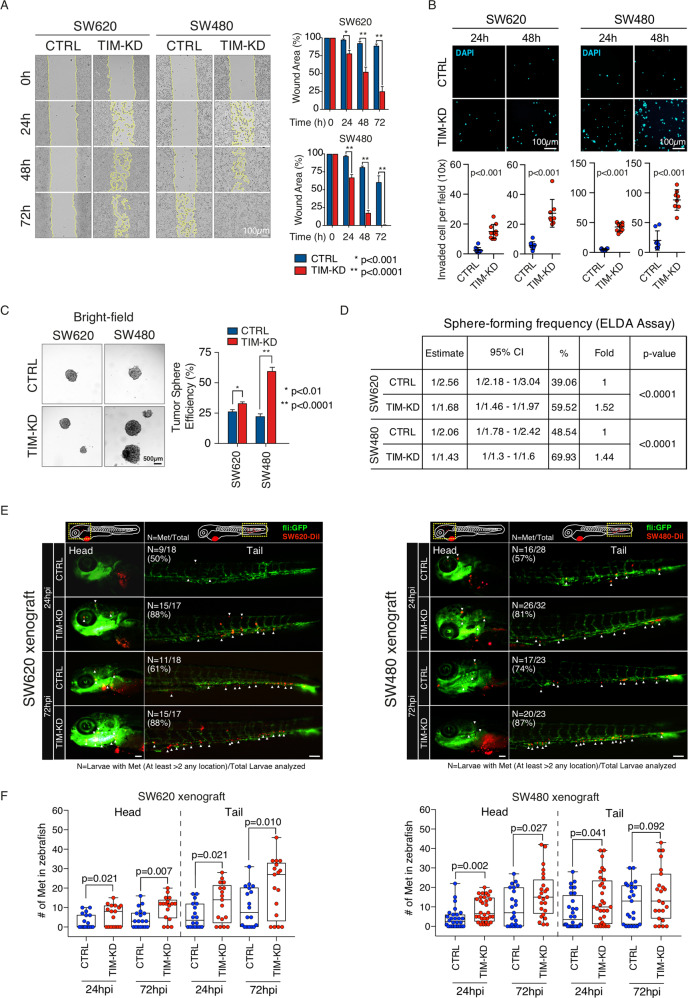
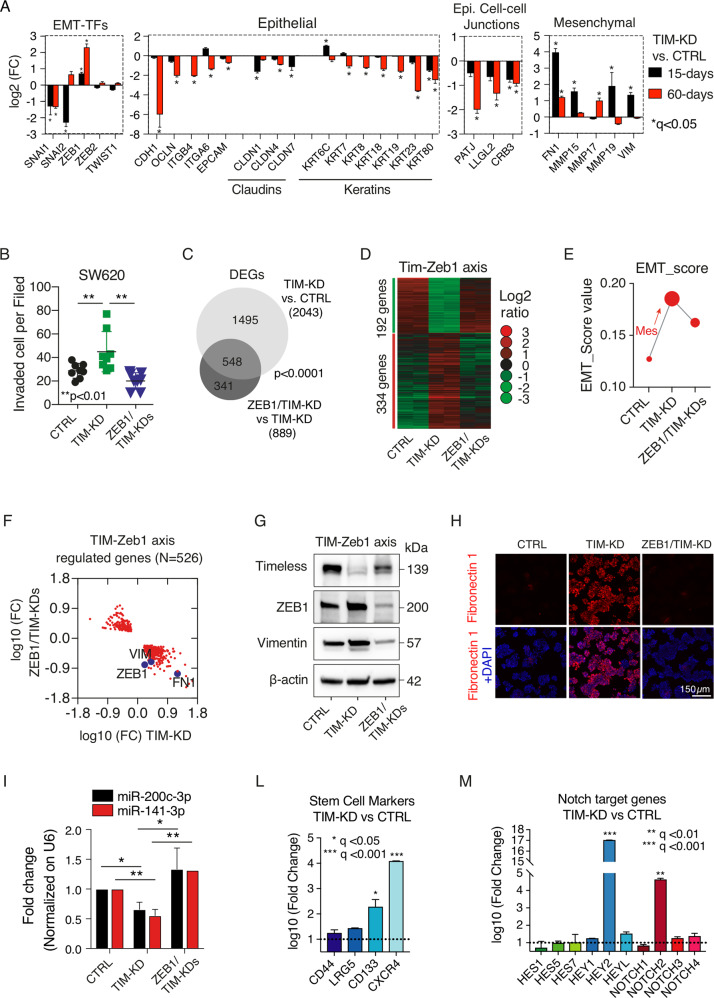
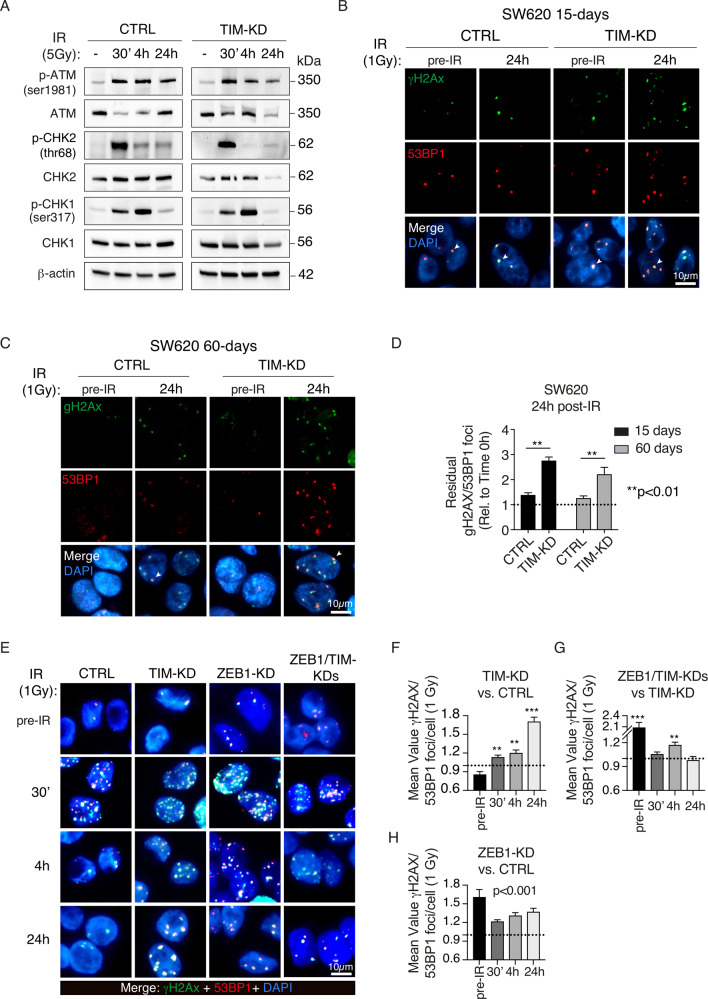
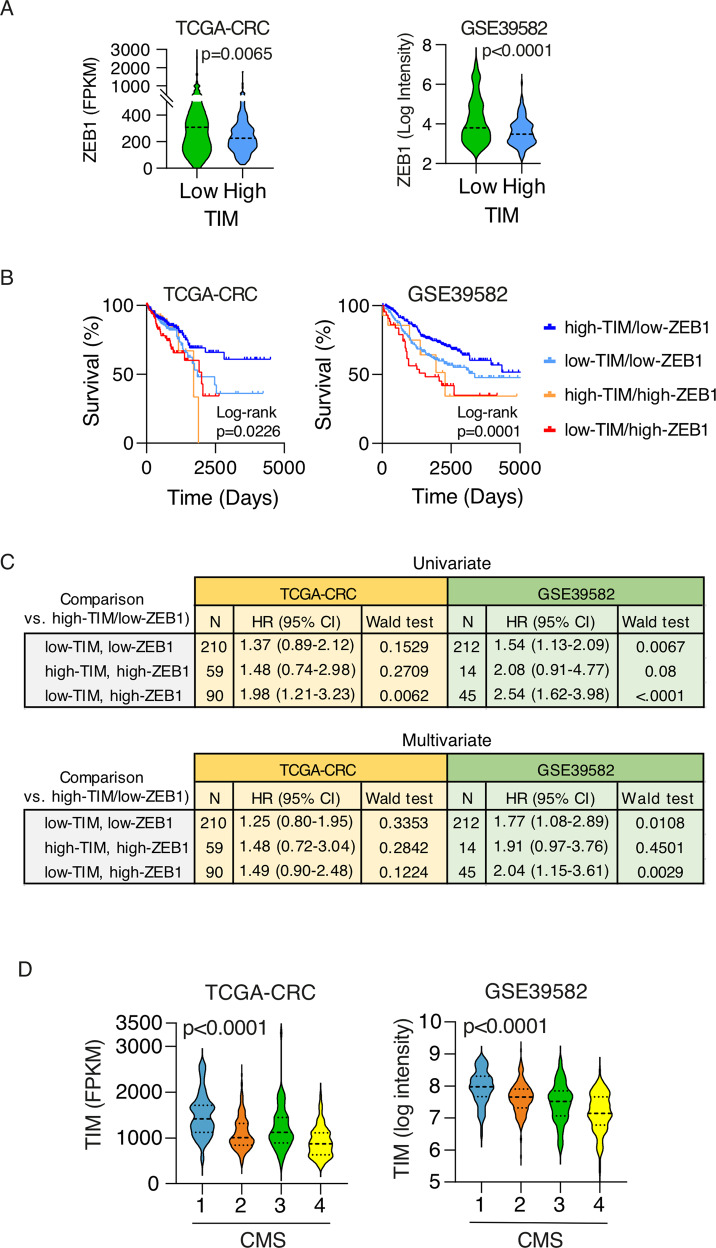
The circadian gene Timeless (TIM) provides a molecular bridge between circadian and cell cycle/DNA replication regulatory systems and has been recently involved in human cancer development and progression. However, its functional role in colorectal cancer (CRC), the third leading cause of cancer-related deaths worldwide, has not been fully clarified yet. Here, the analysis of two independent CRC patient cohorts (total 1159 samples) reveals that loss of TIM expression is an unfavorable prognostic factor significantly correlated with advanced tumor stage, metastatic spreading, and microsatellite stability status. Genome-wide expression profiling, in vitro and in vivo experiments, revealed that TIM knockdown induces the activation of the epithelial-to-mesenchymal transition (EMT) program. Accordingly, the analysis of a large set of human samples showed that TIM expression inversely correlated with a previously established gene signature of canonical EMT markers (EMT score), and its ectopic silencing promotes migration, invasion, and acquisition of stem-like phenotype in CRC cells. Mechanistically, we found that loss of TIM expression unleashes ZEB1 expression that in turn drives the EMT program and enhances the aggressive behavior of CRC cells. Besides, the deranged TIM-ZEB1 axis sets off the accumulation of DNA damage and delays DNA damage recovery. Furthermore, we show that the aggressive and genetically unstable 'CMS4 colorectal cancer molecular subtype' is characterized by a lower expression of TIM and that patients with the combination of low-TIM/high-ZEB1 expression have a poorer outcome. In conclusion, our results as a whole suggest the engagement of an unedited TIM-ZEB1 axis in key pathological processes driving malignant phenotype acquisition in colorectal carcinogenesis. Thus, TIM-ZEB1 expression profiling could provide a robust prognostic biomarker in CRC patients, supporting targeted therapeutic strategies with better treatment selection and patients' outcomes.


Conflict of interest statement

The authors declare no competing interests.

Figures

Fig. 1
Fig. 1. Pan-cancer screening on TIM expression reveals prognostic significance in multiple tumor types.
A Forest plot analysis of the risk of death (i.e., hazard ratios; HR) of patients with low-TIM vs. high-TIM expressing cancer. Circles represent the HR values while horizontal bars mean 95% confidence interval of HR. p-Values were calculated by log-rank test. B Bubble plot of the significant (p < 0.05) differential TIM median expression (fragments per kilobase of transcript per million mapped reads, ∆FPKM) in tumors of patients associated with an adverse prognosis (Dead) or favorable prognosis (Alive). Gene expression data were derived from the “HPA database” and were relative to TCGA cancer samples. Bubble colors are as per the legend. Bubble size represents statistical significance expressed as −Log “p-value” (log-rank test), where the larger the size the greater the significance. BRCA breast invasive carcinoma, CRC colorectal carcinoma, CESC cervical squamous cell carcinoma and endocervical adenocarcinoma, LIHC liver hepatocellular carcinoma, LUAD lung adenocarcinoma, LUSC lung squamous cell carcinoma, HNSC head, and neck squamous cell carcinoma, PRAD prostate adenocarcinoma, RCC renal cell carcinoma, STAD stomach adenocarcinoma, SKCM skin cutaneous melanoma, THCA thyroid carcinoma, UCEC uterine corpus endometrial carcinoma. C Kaplan–Meier survival curves of patients of two independent colorectal cancer cohorts [TCGA-CRC (n = 597) and GSE39582 (n = 562)] stratified based on high- or low-TIM expression (see methods). p-Values were calculated by log-rank test. D Heatmap of TIM expression profile in 63 CRC cell lines (CCLE dataset) ordered according to the TIM expression level (low to high) as per the legend. The labeled cell lines were the ones used in this study. TPM transcripts per million. E Scatter plot analysis showing TIM expression correlation in 39 colorectal cell lines where mRNA and protein expression data were available. Total protein level was measured by isobaric peptide labeling (TMT tandem mass tag) and MS3 quantification, while mRNA refers to RNA-seq expression quantification. TPM transcripts per million. p Values were determined by two-sided Pearson’s correlation test.
Fig. 2
Fig. 2. Loss of TIM expression triggers relevant CRC pathways.
A Western blot analysis of TIM levels in SW620 cells infected with a lentiviral vector containing shRNA (TIM-KD; oligo#1; see Methods) or an empty lentiviral vector as negative control (CTRL), at 15-days and 60-days after cell selection with Puromycin. β-actin was used as a protein loading control. B Volcano plot of differentially expressed genes (microarray; q-value < 0.05; FC > |1.5|) in SW620 TIM-KD vs. CTRL cells, at 15-days or 60-days conditions. In red, upregulated genes, and, in green, downregulated genes (number of genes are indicated within the plot). FC fold change. C Scatter plot analysis of differentially expressed genes (DEGs) in SW620 TIM-KD at 15-days or TIM-KD at 60-days conditions. y-Axes, Log10FC at 60-days condition; x-axes, Log10FC at 15-days condition. Blue dots, genes exclusively regulated in 15-days condition; Yellow dots, genes exclusively regulated in 60-days condition; Red dots, commonly regulated genes with the same trend of expression; Grey dots, commonly regulated genes but with the opposite trend of regulation. D MSigDB-overlap analysis of TIM DEGs (SW620 at 15-days and 60-days) as in (C) with the Hallmark (H) gene sets (N = 50). The bubble plot shows the top six overlapping gene sets among TIM-regulated genes. Bubble size represents the statistical significance of overlap expressed as −log10(q-value), where the larger the size the greater the significance. In the x-axis, H-gene set name; in y-axes, the ratio of overlap (k/K) is shown where “k” represents the number of TIM regulated genes while “K” is the number of genes in the specific H-gene set. Bubble color reflects the number of TIM DEGs (k). The complete results are provided in Table S3. E EMT-score of SW620 TIM-KD or CTRL cells at 15-days or 60-days conditions. In y-axes, the EMT-score.; x-axes, the statistical significance of mesenchymal transition expressed as −log10(p-value) of two-sample Kolmogorov–Smirnov test. F Bubble plot of GSEA results using Hallmark (H) gene sets (N = 50) of the TCGA-CRC cohort of patients stratified accordingly to high- or low-TIM tumor expression level. y-Axes, H-gene set name; x-axes, number of core enriched (TIM-regulated) genes. Bubble size represents statistical significance −log10(q-value) of enrichment. Bubble color represents the normalized enrichment score (NES) where positive values indicate enrichment of gene sets in high-TIM expressing CRC, while negative values indicate enrichment of gene sets (Gsets) in low-TIM expressing CRC. Bubble colors are as per the legend (NES). In bold, Gsets represent mechanisms of cell plasticity. Complete results of GSEA are provided in Table S4. G Violin plots of TIM expression level in CRC samples from TCGA-CRC or GSE39582 cohorts, stratified accordingly to low- or high-EMT score (i.e., the 75th and 25th percentile rank of EMT score values were used to categorize high- or low-EMT score CRCs samples, respectively). p-Values were calculated by Mann–Whitney U-test.
Fig. 3
Fig. 3. Loss of TIM expression induces EMT in CRC cell lines and cell line-derived xenograft (CDX).
A Bright-field images of CTRL and TIM-KD CRC cells at 60-days conditions. White arrows indicate remarkable morphologic features showing fibroblast-like characteristics in TIM-KD cells. Scale bar, 50 μm. B qRT-PCR analysis of EMT markers expression in TIM-KD vs. CTRL CRC cells (SW620 and SW480) at 60-days conditions. y-Axes, −log2FC (fold change) of TIM-KD vs. CTRL. x-axes, EMT markers analyzed. The 18S ribosomal RNA was used as a housekeeping gene. Data are represented as means ± SEM of experiments run at least three times (at least three biological replicates). *p ≤ 0.05; **p ≤ 0.01; ****p ≤ 0.0001 (Student’s t-test). C Immunoblot analysis for TIM expression and EMT markers (E-cadherin, Vimentin, Zeb1) was performed in TIM-KD and CTRL CRC cells at 60-days conditions. β-actin was used as a protein loading control. D Immunofluorescence staining of Vimentin and E-cadherin used as a mesenchymal or epithelial marker, respectively, in TIM-KD and CTRL CRC cells at 60-days conditions. Scale bars are also shown. E qRT-PCR analysis of TIM and EMT markers expression in TIM-KD vs. CTRL CRC cells (i.e., HCT116 and HT29). y-axes, log2 FC (fold change) of TIM-KD vs. CTRL. x-Axes, gene symbols. The 18S ribosomal RNA was used as a housekeeping gene. Data are represented as means ± SEM of experiments run at least six times (at least six biological replicates). *p ≤ 0.05; **p ≤ 0.01; ***p ≤ 0.001 (Student’s t-test). F Hematoxylin and eosin (H&E) staining, E-cadherin and Vimentin immunohistochemical analysis, performed on FFPE samples of CDX (TIM-KD or CTRL condition) (Scale bar, 100 μm). G Immunoblot analysis of TIM and ZEB1 expression in CDX (TIM-KD tumors, N = 4; CTRL tumors, N = 4). β-actin was blotted as a protein loading control. H Pictures of CDX were obtained from TIM-KD and CTRL SW620 cells. Tumors were excised on day 24 after cell injection. I Tumor growth of TIM-KD and CTRL condition (Line graph). y-Axes, relative tumor volume (mm3); x-axes, days after injection. Values represent means ± SEM (N = 10). p > 0.05, statistical analysis was performed by Mann–Whitney test.
Fig. 4
Fig. 4. Loss of TIM expression in CRC cells correlates with enhanced migration, invasion, tumorsphere formation in vitro, and enhanced metastatic spreading in vivo.
A Left, representative images of wound healing assay of TIM-KD and CTRL CRC cells. The wound width was measured at 0, 24, 48, or 72 h. Right, histograms show the quantification of the percentage of area compared to the initial scratch area. Experiments were run in biological replicates (N = 4). Statistical significance (p-value) was computed by Student’s t-test. B Top, Invasion assay of TIM-KD and CTRL CRC cells. Images (10× magnification) of DAPI-staining of invaded tumor cells at 24 or 48 h post-seeding. Bottom, dot-plots are based on data as in (B), collected from two independent experiments (eight random fields). y-Axes, number of invaded cells; x-axes, experimental condition. Statistical significance (p-value) was computed by Mann–Whitney test. C Left, analysis of tumorsphere efficiency (TSE) in TIM-KD and CTRL CRC cells. Representative images of spheres. Scale bar, 500 µm. Right, bar plots represent the TSE expressed as a number of spheres over the total number of cells seeded (as a percentage). Data represent mean ± SEM of biological triplicates. Statistical significance (p-value) was computed by Student’s t-test. D TIM-KD and control cells were seeded into 96-well U-bottomed culture plates (poly-HEMA coated) at a density of 10, 5, or 1 cell per well and cultured for 7 days. The sphere-forming cell frequency was calculated by ELDA software. The data are reported as the estimated (ESTIMATE) sphere-forming frequency with relative confidence intervals (95% CI) as well as the estimated percentage of self-renewing cells (%). Fold, sphere-forming frequency of TIM-KD vs. CTRL conditions. p-Value, statistical significance calculated by the chi-squared test. E SW620-CTRL, SW620-TIMKD, SW480-CTRL, and SW480-TIMKD cells were fluorescently labeled with DiI (red) and injected into the perivitelline space (PVS) of 2 days post fertilization (dpf) Tg(fli1:eGFP) zebrafish larvae. At 24 and 72 h post-injection (hpi), ZTX was analyzed to measure the number of metastases. White arrowheads indicate the metastatic colon cancer cells (RED dot) into zebrafish head and tail. N, the number of larvae with metastases (At least >2 any location) divided by the number of total larvae analyzed (N = met/total). Scale bars, 100 μm. F Box-plots represent the number of metastatic colon cancer cells into the head and tail of Tg(fli1:eGFP) zebrafish larvae at 24 and 72 h post-injection. Each dot represents one zebrafish larvae. Results are from two independent experiments. The p-value was calculated by the longitudinal Poisson log-linear model.
Fig. 5
Fig. 5. TIM-ZEB1 axis regulates EMT in CRC.
A Expression profile (microarray) of EMT-TFs, epithelial-, mesenchymal-, and epithelial cell–cell junction markers in SW620 cells infected with a lentiviral vector containing shRNA (TIM-KD; oligo#1; see methods) or an empty lentiviral vector as negative control (CTRL), at 15-days and 60-days after cell selection with Puromycin. y-Axes, the expression level of EMT-TFs (log2 FC). Statistical significance is reported as FDR adjusted p-value (or q-value). The analyses were performed in two independent biological experiments, and gene expression data were Log2 transformed before analyses. B Invasion assay of CTRL, TIM-KD, ZEB1-KD, or ZEB1/TIM-KDs cells. y-Axes, number of invaded cells; x-axes, relative experimental condition. Eight or ten random fields in two independent experiments were selected for statistical analysis. Statistical analysis was performed by Mann–Whitney test. C Venn diagram representing the overlap of significantly regulated genes (FC > | 1.5 | ; q-value < 0.05) in TIM-KD vs. CTRL cells (light grey circle) or TIM-KD vs. ZEB1/TIM-KDs (dark grey circle). D Heat-map of DEGs in TIM-KD vs. CTRL cells whose expression profile is reverted upon ZEB1-KD. The colors are as per the legend. Each column represents mean expression data from biological replicates (N = 2). E EMT-score value (y-axes) of CTRL, TIM-KD, or ZEB1/TIM-KD cells (x-axes). F Scatter plot analysis of differentially expressed genes (DEGs) in ZEB1/TIM-KD vs. CTRL cells (y-axes), and in TIM-KD vs. CTRL (x-axes). Relevant EMT-related genes are highlighted in the picture (Violet circle). G Immunoblot analysis for the indicated protein performed CTRL, TIM-KD, and ZEB1/TIM-KD cells. β-actin was used as a loading control. H Immunofluorescence analysis of Fibronectin 1 (Red) in CTRL, TIM-KD, and ZEB1/TIM-KD cells. Nuclei were stained with DAPI (blue). The scale bar is also shown. I Expression profile analysis of miR-200c-3p and miR-141-3p by qRT-PCR. Data were normalized using U6 snRNA (see also Table S7). Y-axes, fold chance expression difference. x-Axes, different experimental conditions are shown as per the label. Data are represented as means ± SEM of biological replicates (N = 5) run in triplicate (technical). p-Value: *p ≤ 0.05; **p ≤ 0.01 (Student’s t-test). L Expression profile (microarray) of genes involved in stemness in TIM-KD vs. CTRL cells. y-Axes, the expression level of selected genes (log10 FC). Statistical significance is explained by an FDR-adjusted p-value (or q-value). M Expression profile (microarray) of Notch target genes in TIM-KD vs. CTRL cells. y-Axes, the expression level of selected genes (log10 FC). Statistical significance is explained by FDR adjusted p-value (or q-value).
Fig. 6
Fig. 6. Loss of TIM expression induces accumulation of DSBs.
A Immunoblot for DNA damage markers in CTRL and TIM-KD cells before (−) and after γ-ionizing radiation treatment (30’−24 h) with a dose of 5 Gy. β-actin was used as a protein loading control. B Immunofluorescence analysis of γH2AX (green) and 53BP1 (red) foci in TIM-KD and CTRL cells (15-days condition). Cells were analyzed before (pre-IR) and after irradiation (24 h; 1 Gy). DNA was counterstained with DAPI (blue), and images were merged to determine the γH2AX/53BP foci (i.e., white arrows indicate representative foci) (scale bar, 10 μm). C Immunofluorescence analysis of γH2AX (green) and 53BP1 (red) foci in TIM-KD and CTRL cells (60-days condition). Cells were analyzed before (pre-IR) and after irradiation (24 h; 1 Gy), compared with unirradiated controls. DNA was counterstained with DAPI (blue) and images were merged to determine the γH2AX/53BP foci (i.e., white arrows indicate representative foci) (scale bar, 10 μm). D Quantitative analysis of the γ-H2AX/53BP1 foci in the same experimental setting as in (B, C). Data shown are means ± SE of more than 50 nuclei analyzed in two independent experiments. p-Value (p) was calculated using the Mann–Whitney U-test. E Immunofluorescence analysis of the γH2AX (green) and the 53BP1 (red) foci in CTRL, TIM-KD, ZEB1-KD, and ZEB1/TIM-KD cells before (pre-IR) and after γ-ionizing radiation treatment (30’−24 h; 1 Gy). DNA was counterstained with DAPI (blue) and images were merged to determine the γH2AX/53BP foci (scale bar, 10 μm). FH Quantitative analysis of the γ-H2AX/53BP1 foci in the same experimental setting as in (E). Data shown are means ± SD of more than 50 nuclei analyzed in two independent experiments. Statistical significance was calculated using the Mann–Whitney U-test. **p ≤ 0.01; ***p ≤ 0.01.
Fig. 7
Fig. 7. TIM-ZEB1 axis is prognostic in CRC.
A Violin plots of ZEB1 expression level in CRC samples (TCGA CRC and GSE39582 cohorts) stratified into low- and high-TIM expressing CRC. The p-value is calculated by Mann–Whitney U-test. B Kaplan–Meier survival plots of patients stratified on the basis of TIM and ZEB1 tumor expression as per the legend. Two independent CRC cohorts of patients were considered (TCGA CRC, N = 597; GSE39582, N = 562). p-Values were calculated by log-rank test. C Univariate and multivariate survival risk analysis of CRC patients stratified based on TIM and ZEB1 tumor expression. Hazard-Ratios (HR) are shown with a relative 95% CI. Multivariate analysis was corrected for age, stage, and sex. p-Values were calculated by Wald test. D Violin plots of TIM expression in CRC samples, from TCGA CRC and GSE39582 datasets, stratified according to the consensus molecular subtype (CMS1-4). The p-Value is calculated by Mann–Whitney U-test.

References

    1. Sung H, Ferlay J, Siegel RL, Laversanne M, Soerjomataram I, Jemal A et al. Global cancer statistics 2020: GLOBOCAN estimates of incidence and mortality worldwide for 36 cancers in 185 countries. CA A Cancer J Clin. 2021; 10.3322/caac.21660. - PubMed
    1. Shibue T, Weinberg RA. EMT, CSCs, and drug resistance: the mechanistic link and clinical implications. Nat Rev Clin Oncol. 2017;14:611–29. - PMC - PubMed
    1. Mazzoccoli G, Laukkanen MO, Vinciguerra M, Colangelo T, Colantuoni V. A Timeless link between circadian patterns and disease. Trends Mol Med. 2016;22:68–81. - PubMed
    1. Baretić D, Jenkyn-Bedford M, Aria V, Cannone G, Skehel M, Yeeles JTP. Cryo-EM structure of the fork protection complex bound to CMG at a replication fork. Mol Cell. 2020;78:926–940.e13. - PMC - PubMed
    1. Leman AR, Noguchi C, Lee CY, Noguchi E. Human Timeless and Tipin stabilize replication forks and facilitate sister-chromatid cohesion. J Cell Sci. 2010;123:660–70. - PMC - PubMed

Publication types

MeSH terms

Substances