

ceRNA Network and Functional Enrichment Analysis of Preeclampsia by Weighted Gene Coexpression Network Analysis
- PMID: 35035521
- PMCID: PMC8759911
- DOI: 10.1155/2022/5052354
ceRNA Network and Functional Enrichment Analysis of Preeclampsia by Weighted Gene Coexpression Network Analysis
Retraction in
-
Retracted: ceRNA Network and Functional Enrichment Analysis of Preeclampsia by Weighted Gene Coexpression Network Analysis.Comput Math Methods Med. 2023 Nov 1;2023:9867945. doi: 10.1155/2023/9867945. eCollection 2023. Comput Math Methods Med. 2023. PMID: 37946970 Free PMC article.
Abstract
Background: Preeclampsia (PE) is a multisystemic syndrome which has short- and long-term risk to mothers and children and has pluralistic etiology.
Objective: This study is aimed at constructing a competitive endogenous RNA (ceRNA) network for pathways most related to PE using a data mining strategy based on weighted gene coexpression network analysis (WGCNA).
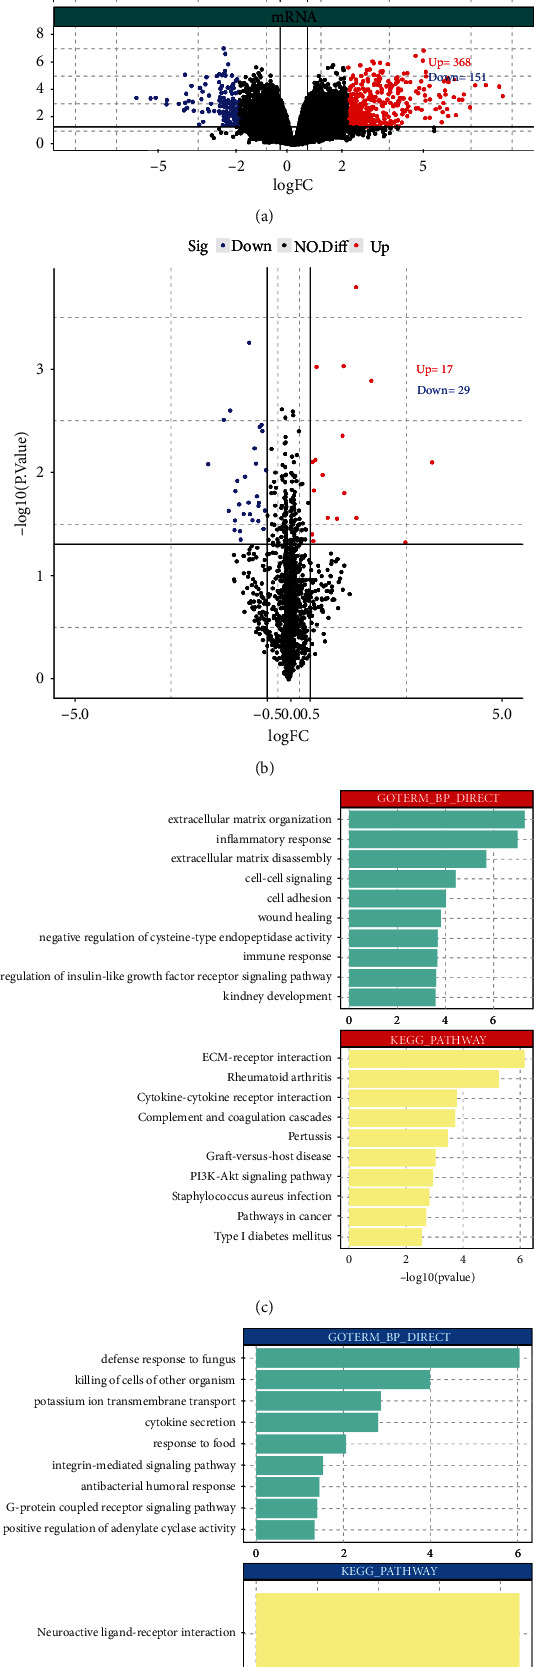
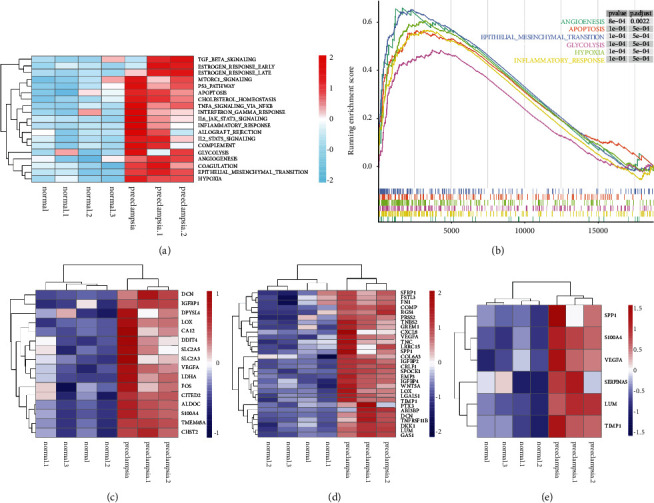
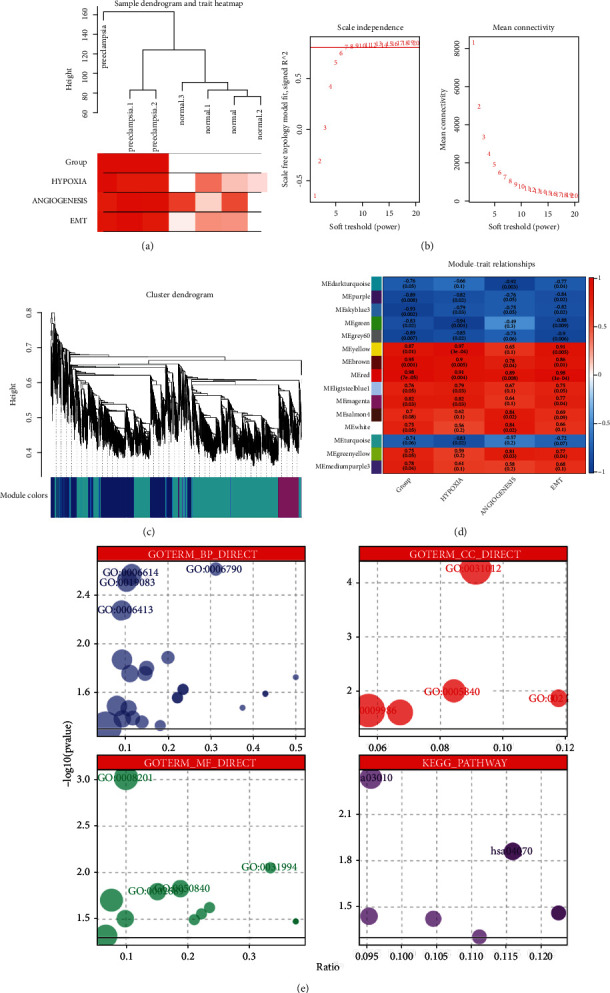
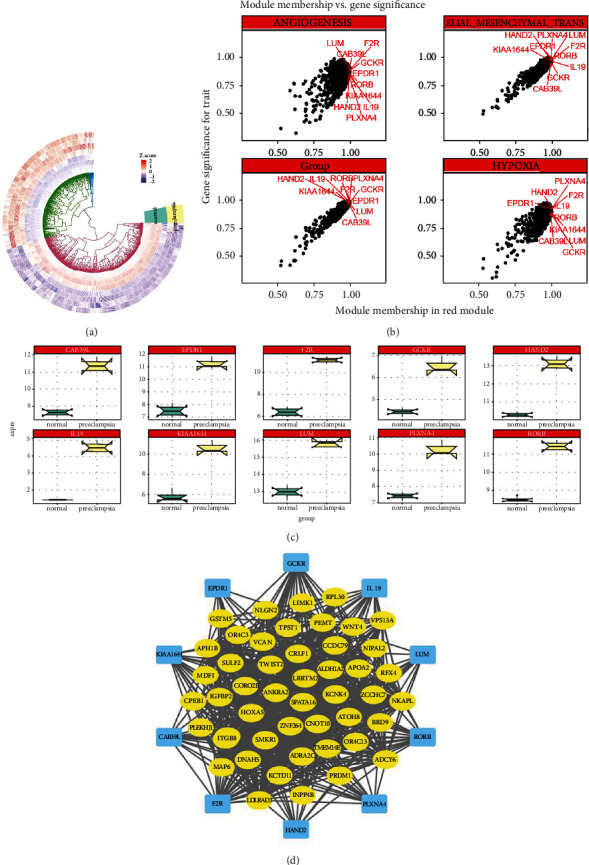
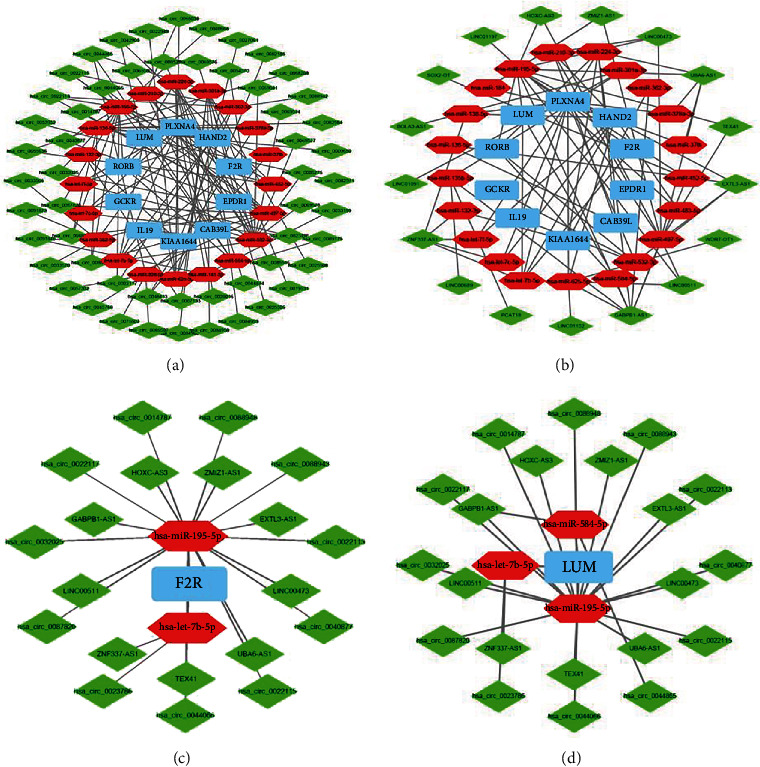
Methods: We focused on pathways involving hypoxia, angiogenesis, and epithelial mesenchymal transition according to the gene set variation analysis (GSVA) scores. The gene sets of these three pathways were enriched by gene set enrichment analysis (GSEA). WGCNA was used to study the underlying molecular mechanisms of the three pathways in the pathogenesis of PE by analyzing the relationship among pathways and genes. The soft threshold power (β) and topological overlap matrix allowed us to obtain 15 modules, among which the red module was chosen for the downstream analysis. We chose 10 hub genes that satisfied ∣log2Fold Change | >2 and had a higher degree of connectivity within the module. These candidate genes were subsequently confirmed to have higher gene significance and module membership in the red module. Coexpression networks were established for the hub genes to unfold the connection between the genes in the red module and PE. Finally, ceRNA networks were constructed to further clarify the underlying molecular mechanism involved in the occurrence of PE. 56 circRNAs, 17 lncRNAs, and 20 miRNAs participated in the regulation of the hub genes. Coagulation factor II thrombin receptor (F2R) and lumican (LUM) were considered the most relevant genes, and ceRNA networks of them were constructed.
Conclusion: The microarray data mining process based on bioinformatics methods constructed lncRNA and miRNA networks for ten hub genes that were closely related to PE and focused on ceRNAs of F2R and LUM finally. The results of our study may provide insight into the mechanisms underlying PE occurrence.
Copyright © 2022 Chenxu Wang et al.
Conflict of interest statement
All authors report no conflicts of interest. Our study is based on open source data from GEO database, so there are no ethical issues and other conflicts of interest.
Figures
Similar articles
-
Analysis of a circRNA-, miRNA-, and mRNA-associated ceRNA network reveals potential biomarkers in preeclampsia a ceRNA network in preeclampsia.Ann Med. 2021 Dec;53(1):2354-2364. doi: 10.1080/07853890.2021.2014554. Ann Med. 2021. PMID: 34894939 Free PMC article.
-
Identification and validation of key non-coding RNAs and mRNAs using co-expression network analysis in pre-eclampsia.Medicine (Baltimore). 2021 Apr 9;100(14):e25294. doi: 10.1097/MD.0000000000025294. Medicine (Baltimore). 2021. PMID: 33832098 Free PMC article.
-
Excavating novel diagnostic and prognostic long non-coding RNAs (lncRNAs) for head and neck squamous cell carcinoma: an integrated bioinformatics analysis of competing endogenous RNAs (ceRNAs) and gene co-expression networks.Bioengineered. 2021 Dec;12(2):12821-12838. doi: 10.1080/21655979.2021.2003925. Bioengineered. 2021. PMID: 34898376 Free PMC article.
-
Identification of Crucial lncRNAs, miRNAs, mRNAs, and Potential Therapeutic Compounds for Polycystic Ovary Syndrome by Bioinformatics Analysis.Biomed Res Int. 2020 Nov 6;2020:1817094. doi: 10.1155/2020/1817094. eCollection 2020. Biomed Res Int. 2020. PMID: 33224973 Free PMC article.
-
[Circular RNA expression profiles and circRNA-miRNA-mRNA crosstalk in pre-eclamptic placenta].Zhonghua Fu Chan Ke Za Zhi. 2023 Jun 25;58(6):430-441. doi: 10.3760/cma.j.cn112141-20230206-00044. Zhonghua Fu Chan Ke Za Zhi. 2023. PMID: 37357602 Chinese.
Cited by
-
Identification and validation of feature genes associated with M1 macrophages in preeclampsia.Aging (Albany NY). 2023 Dec 1;15(23):13822-13839. doi: 10.18632/aging.205264. Epub 2023 Dec 1. Aging (Albany NY). 2023. PMID: 38048229 Free PMC article.
-
Retracted: ceRNA Network and Functional Enrichment Analysis of Preeclampsia by Weighted Gene Coexpression Network Analysis.Comput Math Methods Med. 2023 Nov 1;2023:9867945. doi: 10.1155/2023/9867945. eCollection 2023. Comput Math Methods Med. 2023. PMID: 37946970 Free PMC article.
References
-
- American College of Obstetricians and Gynecologists. Hypertension in pregnancy. Report of the American College of Obstetricians and Gynecologists’ task force on hypertension in pregnancy. Obstetrics and Gynecology . 2013;122(5):1122–1131. - PubMed
-
- American College of Obstetricians and Gynecologists. ACOG Practice Bulletin No. 202 summary: gestational hypertension and preeclampsia. Obstetrics and Gynecology . 2019;133(1):p. 1. - PubMed
-
- Espinoza J., Romero R., Nien J. K., et al. Identification of patients at risk for early onset and/or severe preeclampsia with the use of uterine artery Doppler velocimetry and placental growth factor. American Journal of Obstetrics and Gynecology . 2007;196(4):326.e1–326.e13. doi: 10.1016/j.ajog.2006.11.002. - DOI - PMC - PubMed
Publication types
MeSH terms
Substances
LinkOut - more resources
Full Text Sources
Miscellaneous
