

Beyond Hours Worked and Dollars Earned: Multidimensional EQ, Retirement Trajectories and Health in Later Life
- PMID: 35035984
- PMCID: PMC8742984
- DOI: 10.1093/workar/waab012
Beyond Hours Worked and Dollars Earned: Multidimensional EQ, Retirement Trajectories and Health in Later Life
Abstract
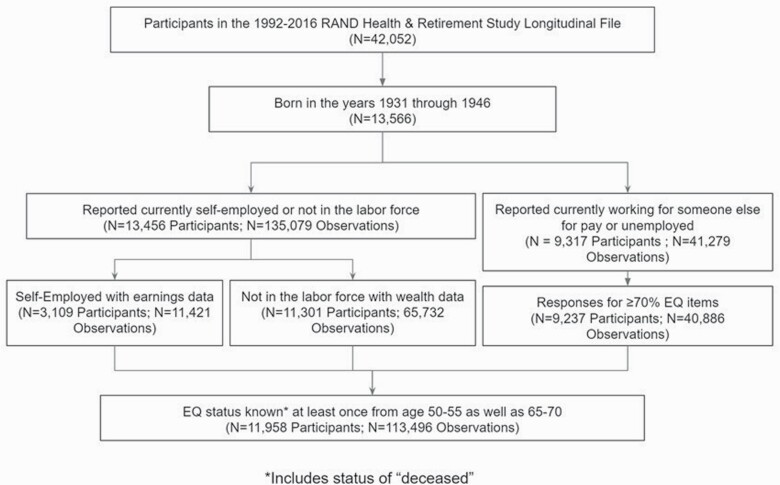
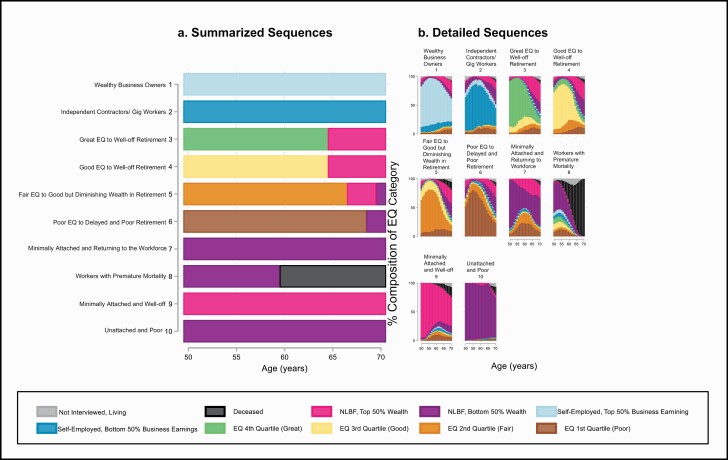
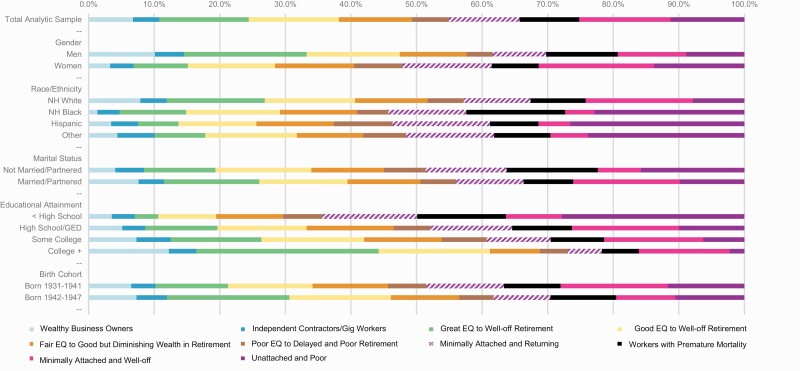
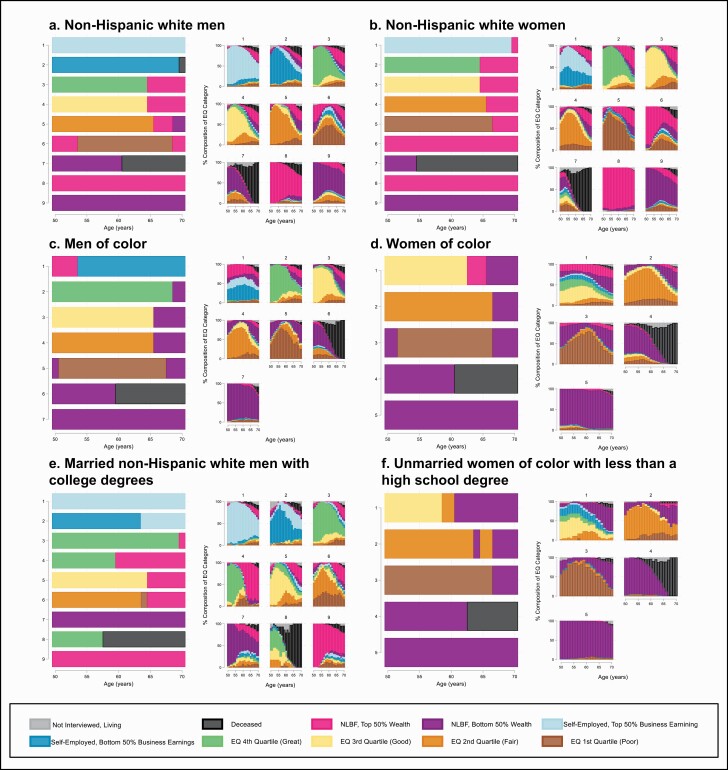
The working lives of Americans have become less stable over the past several decades and older adults may be particularly vulnerable to these changes in employment quality (EQ). We aimed to develop a multidimensional indicator of EQ among older adults and identify EQ and retirement trajectories in the United States. Using longitudinal data on employment stability, material rewards, workers' rights, working-time arrangements, unionization, and interpersonal power relations from the Health and Retirement Study (HRS), we used principal component analysis to construct an EQ score. Then, we used sequence analysis to identify late-career EQ trajectories (age 50-70 years; N = 11,958 respondents), overall and by sociodemographics (race, gender, educational attainment, marital status). We subsequently examined the sociodemographic, employment, and health profiles of these trajectories. We identified 10 EQ trajectories; the most prevalent trajectories were Minimally Attached and Wealthy (13.9%) and Good EQ to Well-off Retirement (13.7%), however, 42% of respondents were classified into suboptimal trajectories. Those in suboptimal trajectories were disproportionately women, people of color, and less-educated. Individuals in the Poor EQ to Delayed and Poor Retirement and Unattached and Poor clusters self-reported the greatest prevalence of poor health and depression, while individuals in the Wealthy Business Owners and Great EQ to Well-off Retirement clusters self-reported the lowest prevalence of poor health and depression at baseline. Trajectories were substantially constrained for women of color. Although our study demonstrates EQ is inequitably distributed in later life, labor organizing and policy change may afford opportunities to improve EQ and retirement among marginalized populations.
© The Author(s) 2021. Published by Oxford University Press. For permissions please e-mail: journals.permissions@oup.com.
Figures
References
-
- Administration for Community Living & Administration on Aging . (2020). 2019 profile of older Americans. U.S. Department of Health and Human Services. https://acl.gov/sites/default/files/Aging%20and%20Disability%20in%20Amer... (2021, March 19, date accessed).
-
- Aisenbrey, S., & Fasang, A. E. (2010). New life for old ideas: The “Second Wave” of sequence analysis bringing the “Course” back into the life course. Sociological Methods & Research, 38, 420–462. doi:10.1177/0049124109357532. - DOI
-
- Beehr, T. A., & Bennett, M. M. (2015). Working after retirement: Features of bridge employment and research directions. Work, Aging and Retirement, 1(1), 112–128. doi:10.1093/workar/wau007 - DOI
Grants and funding
LinkOut - more resources
Full Text Sources
Miscellaneous