. 2022 Apr:11:e00261.
doi: 10.1016/j.ohx.2022.e00261. Epub 2022 Jan 10.

Distributed LoRa based CO2 monitoring network - A standalone open source system for contagion prevention by controlled ventilation

Affiliations

Distributed LoRa based CO2 monitoring network - A standalone open source system for contagion prevention by controlled ventilation

Yannic Toschke et al. HardwareX. 2022 Apr.

Abstract

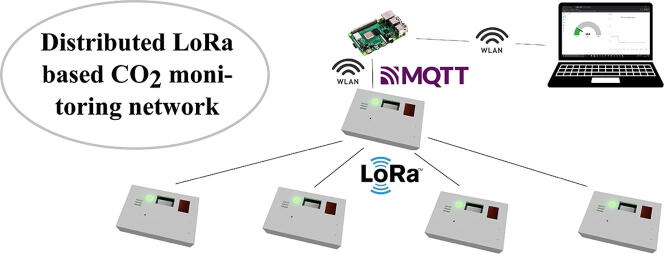
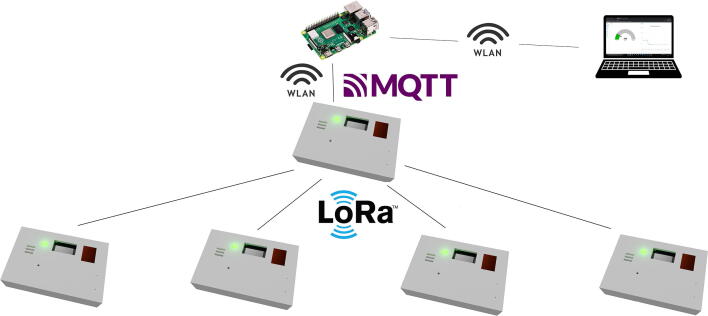
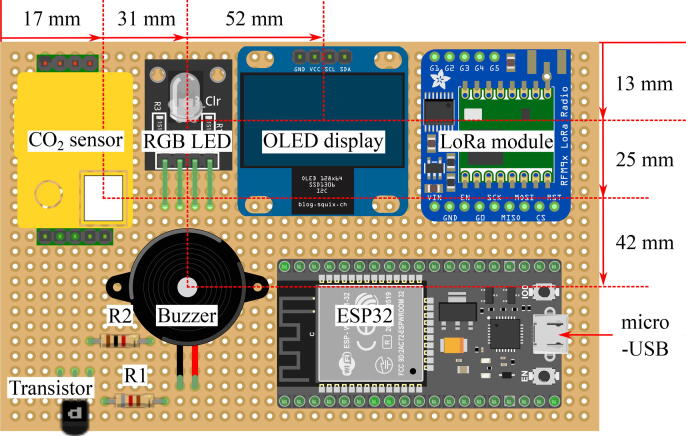
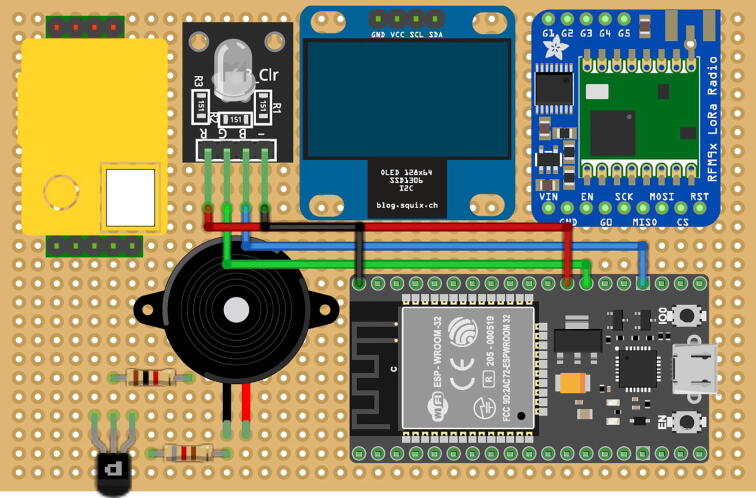
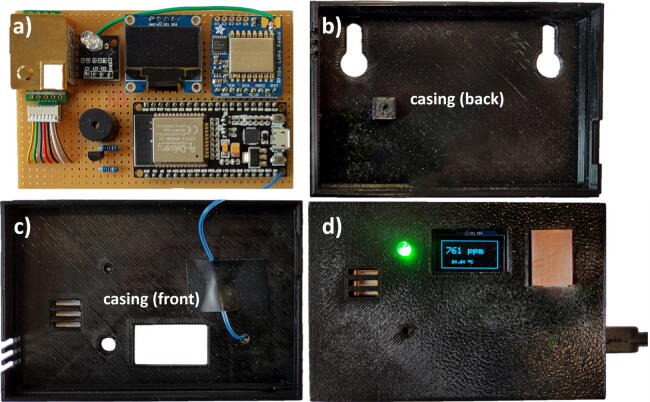
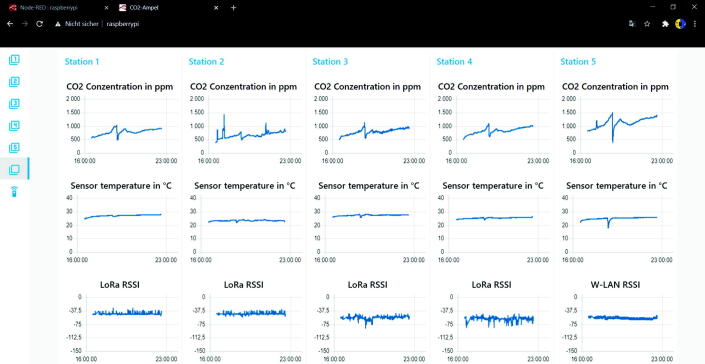
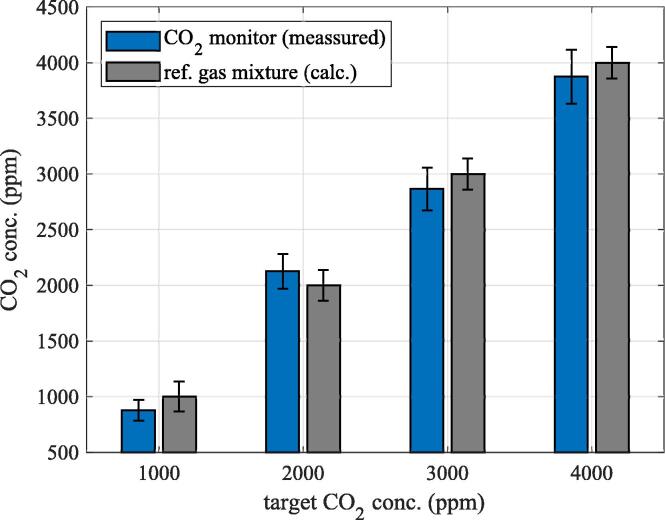
In the face of a global pandemic, such as that caused by the SARS-CoV-2 virus, the prevention of new infections is essential to stop the spread and ultimately return to normality. In addition to wearing masks and maintaining safe distances, regular ventilation in enclosed spaces where several people are gathered has proven to be an effective protective measure as advised by the World Health Organization. Additionally, as has been shown in a recent study of other airborne viruses, there is a strong correlation between the CO2level and aerosol content in a confined space under the assumption humans are the only CO2source. This can be exploited by means of a low-cost infrared CO2sensor to indirectly monitor the aerosol content and to provide targeted ventilation if predefined thresholds are exceeded. The distributed CO2monitoring network presented in this paper extends that idea and provides an inexpensive, comprehensive and modular monitoring network based on readily available components and 3D printing. By using a long-range communication link (LoRa) to centrally collect the real-time CO2concentration in a multitude of rooms, this network is particularly suitable for larger building complexes such as kindergartens, schools and universities without requiring partial or even full WLAN coverage.

Keywords: 3D-Printing; CO2 monitoring network; COVID-19; Contagion prevention; General protective equipment; SARS-CoV-2.


Conflict of interest statement

The authors declare that they have no known competing financial interests or personal relationships that could have appeared to influence the work reported in this paper.

Figures

None
Graphical abstract
Fig. 1
Fig. 1
Shown is the concept of the CO2 Monitor System. Each individual transmitter node is equipped with a display, a visual and an acoustic signal. The communication with the receiver node is done via LoRa. The receiver node additionally transmits the real-time data to a Raspberry Pi using the MQTT protocol over the Pi’s own access point, thus allowing integration into other systems.
Fig. 2
Fig. 2
4-step instruction on how to duplicate the provided Node-RED flow CO2-Monitor-Station.json to accommodate the user interface to the required amount of CO2 traffic lights.
Fig. 3
Fig. 3
Wiring diagram of the CO2 monitor.
Fig. 4
Fig. 4
Crucial dimensions when wiring the components onto the DOT PCB. The dimensions of the shown PCB are 100 mm × 65 mm (h × w).
Fig. 5
Fig. 5
Step-by-step wiring: connecting the CO2 sensor.
Fig. 6
Fig. 6
Step-by-step wiring: connecting the OLED display.
Fig. 7
Fig. 7
Step-by-step wiring: Connecting the LoRa modul.
Fig. 8
Fig. 8
Step-by-step wiring: connecting the RGB LED.
Fig. 9
Fig. 9
Photograph of a) the assembled DOT PCB, b) the empty ‘casing (back)’, c) the ‘casing (front)’ with the ‘Touch plate’ wire visible and d) the completely assembled CO2 traffic light.
Fig. 10
Fig. 10
The presented CO2 monitor allows simultaneous monitoring of several rooms at the same time as shown in the screenshot above. Here the CO2 concentration, the room temperature and the received signal strength indicator of the LoRa modul are displayed i.e. for system debugging during installation.
Fig. 11
Fig. 11
Validation of the CO2 concentration measurement capability of the presented hardware. A total of four predefined gas mixtures were prepared. The measured static concentrations (blue) were taken after the sensor had been flushed for approx. 25 min. (For interpretation of the references to color in this figure legend, the reader is referred to the web version of this article.)
Fig. 12
Fig. 12
Validation of the CO2 monitoring network through a field test in a school. Shown is a sketch of the classroom’s layout and the relative position between CO2 traffic light in red and windows in blue. (For interpretation of the references to color in this figure legend, the reader is referred to the web version of this article.)
Fig. 13
Fig. 13
Validation of the CO2 monitoring network through a field test in a school. Shown is the measured course of CO2 concentration over 6 school hours (07:45–12:15). A gray shading corresponds to no ventilation, during a blue one there is ventilation and in the dashed areas the classroom was empty. A ventilation-dependent decrease in CO2 concentration with an expected delay after opening the windows can be clearly seen. (For interpretation of the references to color in this figure legend, the reader is referred to the web version of this article.)
Fig. 14
Fig. 14
Validation of the CO2 monitoring network’s LoRa capabilities according to Table 2 using a sketched layout of the school building. The red dot represents the position of the fixed receiver (connection station). The numbered blue dots show the relative positions of the transmitter (CO2 traffic light). Distances used are estimated and differences in height are not shown in this sketch. (For interpretation of the references to color in this figure legend, the reader is referred to the web version of this article.)

References

    1. Marques G., Ferreira C.R., Pitarma R. Indoor Air Quality Assessment Using a CO2 Monitoring System Based on Internet of Things. Journal of Medical Systems. 2019;43(3):67. doi: 10.1007/s10916-019-1184-x. - DOI - PubMed
    1. Curtius J., Granzin M., Schrod J. Testing mobile air purifiers in a school classroom: Reducing the airborne transmission risk for SARS-CoV-2. Aerosol Science and Technology. 2021;55(5):586–599. doi: 10.1080/02786826.2021.1877257. URL: https://doi.org/10.1080/02786826.2021.1877257. - DOI
    1. World Health Organization, Roadmap to improve and ensure good indoor ventilation in the context of COVID-19, World Health Organization, 2021, ISBN 978-92-4-002128-0, URL: https://www.who.int/publications/i/item/9789240021280.
    1. RKI – Coronavirus SARS-CoV-2 - Epidemiologischer Steckbrief zu SARS-CoV-2 und COVID-19, 12.04.2021, URL: https://www.rki.de/DE/Content/InfAZ/N/Neuartiges_Coronavirus/Steckbrief.....
    1. Morawska L., Milton D.K. It Is Time to Address Airborne Transmission of Coronavirus Disease 2019 (COVID-19) Clinical infectious diseases: an official publication of the Infectious Diseases Society of America. 2020;71(9):2311–2313. doi: 10.1093/cid/ciaa939. - DOI - PMC - PubMed

LinkOut - more resources