. 2022 Jan;1(1):45-58.
doi: 10.1038/s44161-021-00001-9. Epub 2021 Dec 23.

Circadian REV-ERBs repress E4bp4 to activate NAMPT-dependent NAD+ biosynthesis and sustain cardiac function

Affiliations

Circadian REV-ERBs repress E4bp4 to activate NAMPT-dependent NAD+ biosynthesis and sustain cardiac function

Pieterjan Dierickx et al. Nat Cardiovasc Res. 2022 Jan.

Abstract

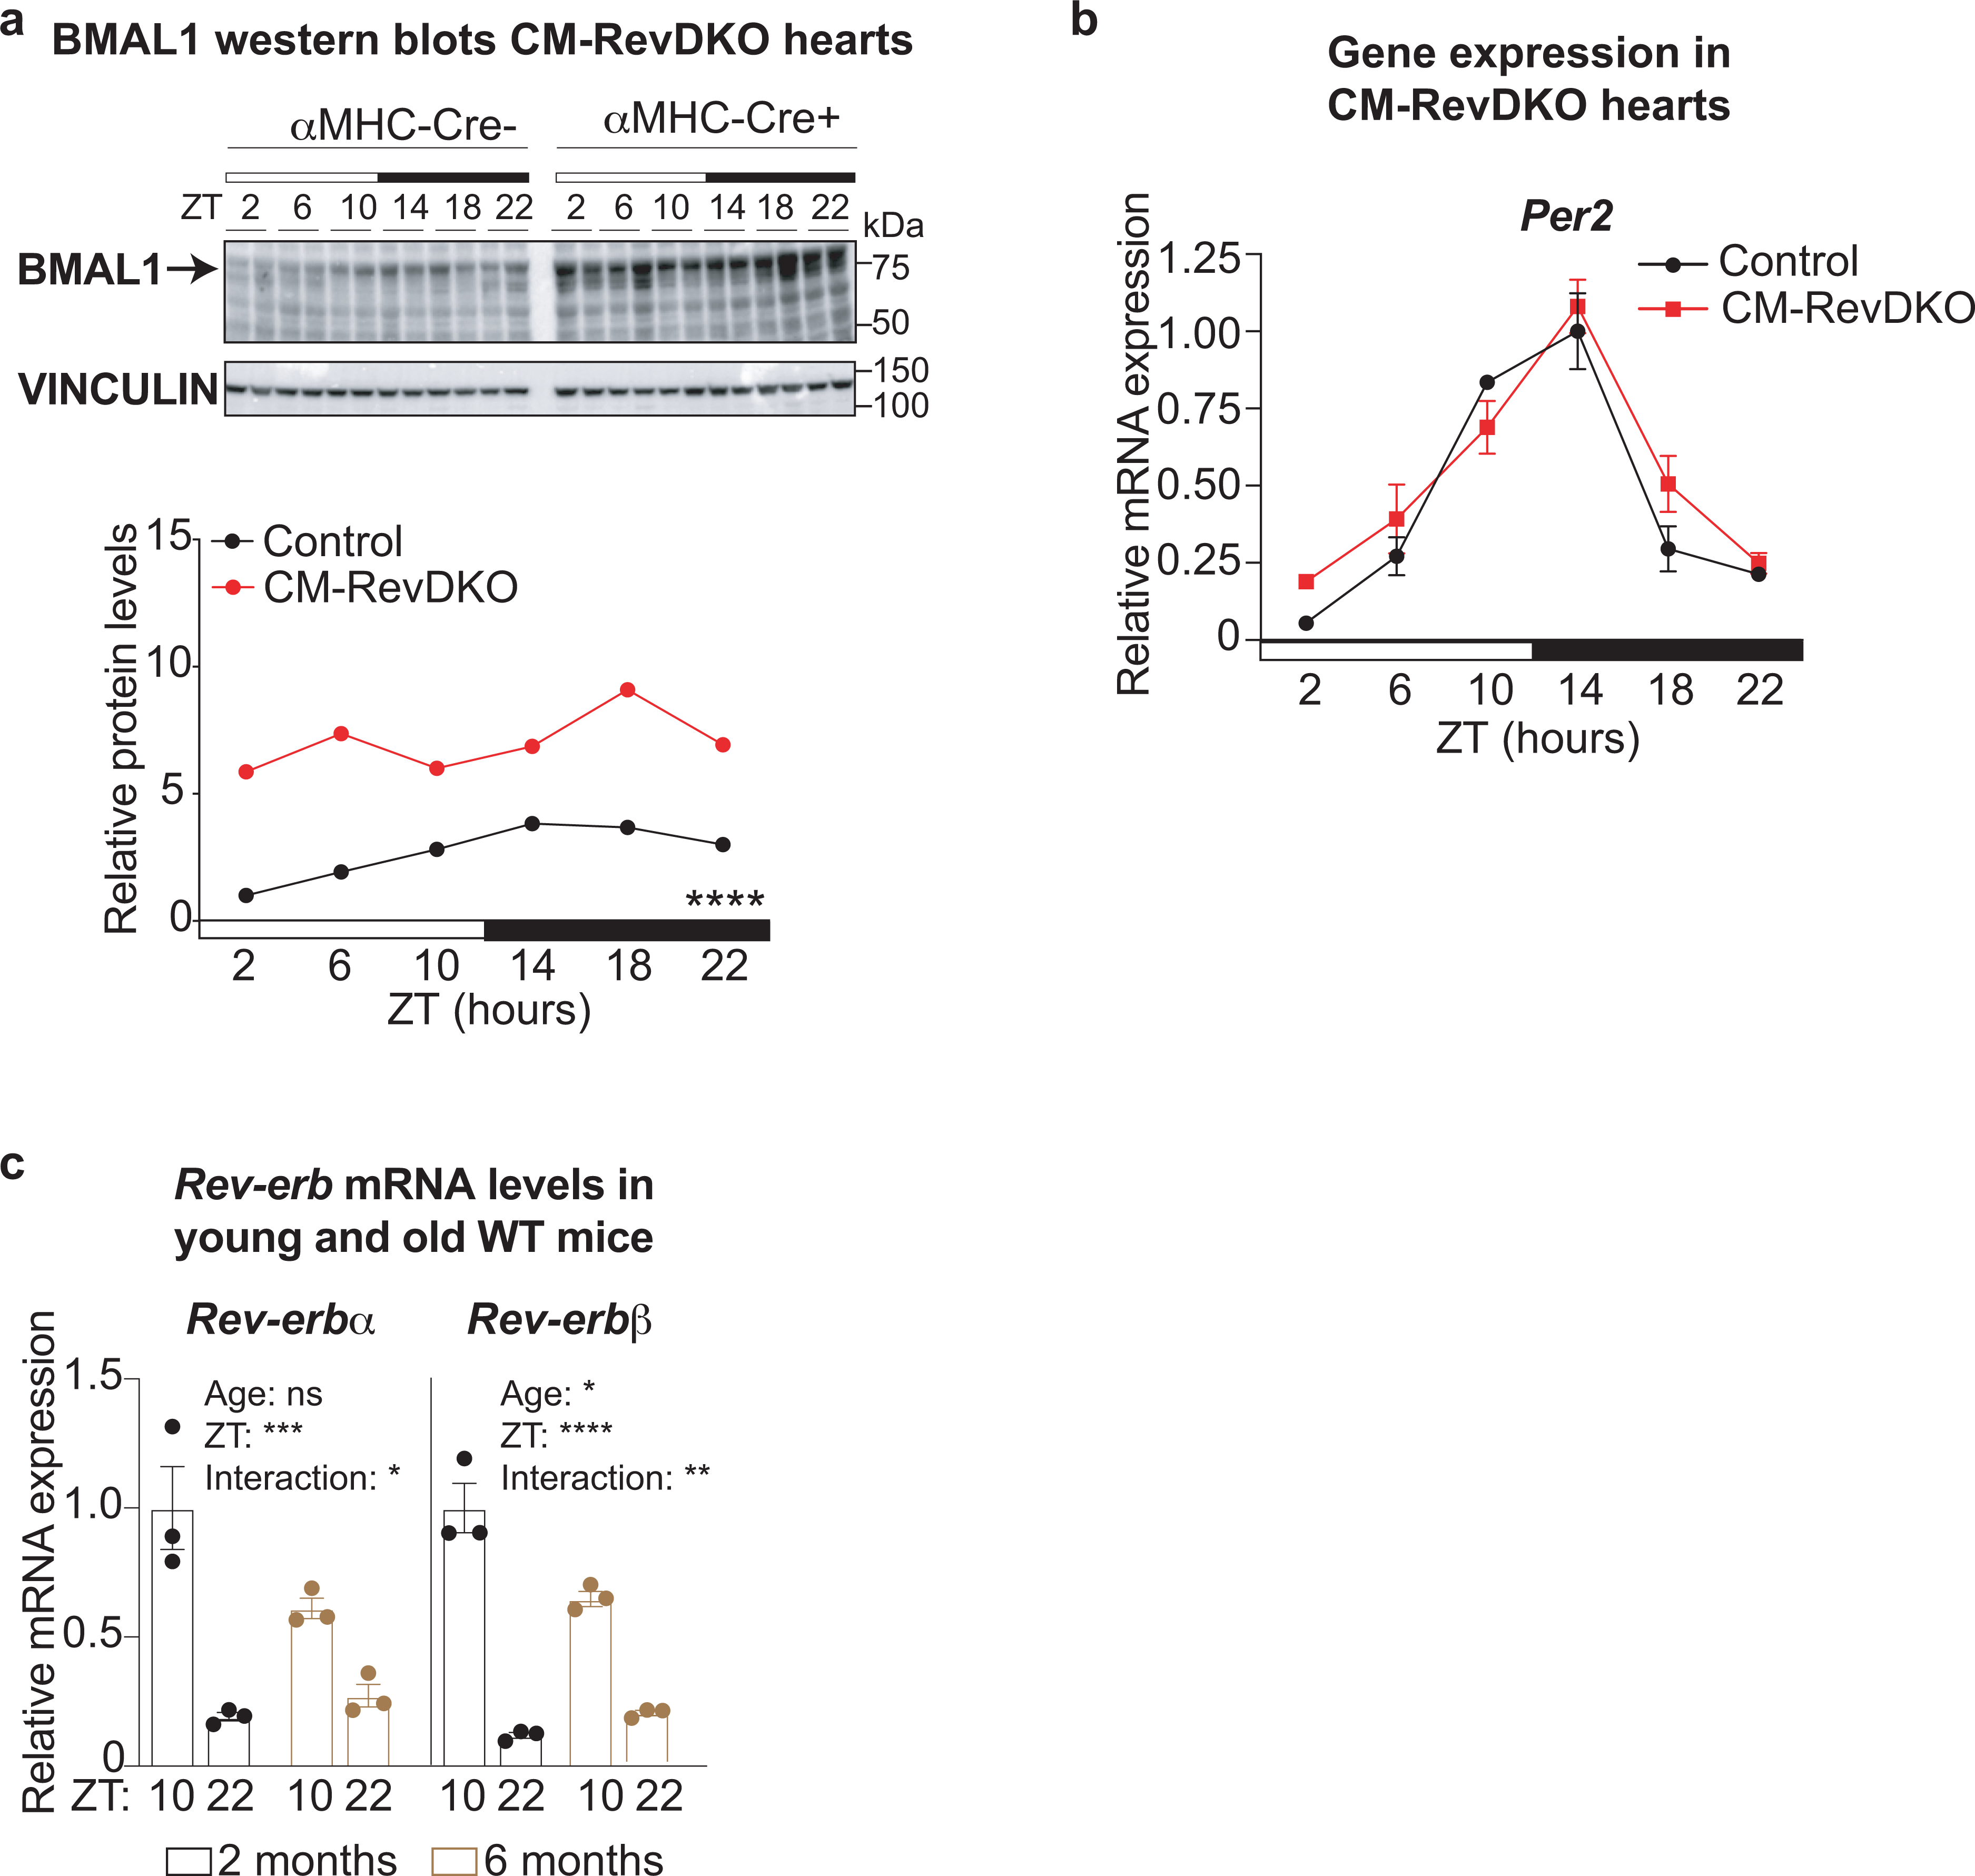
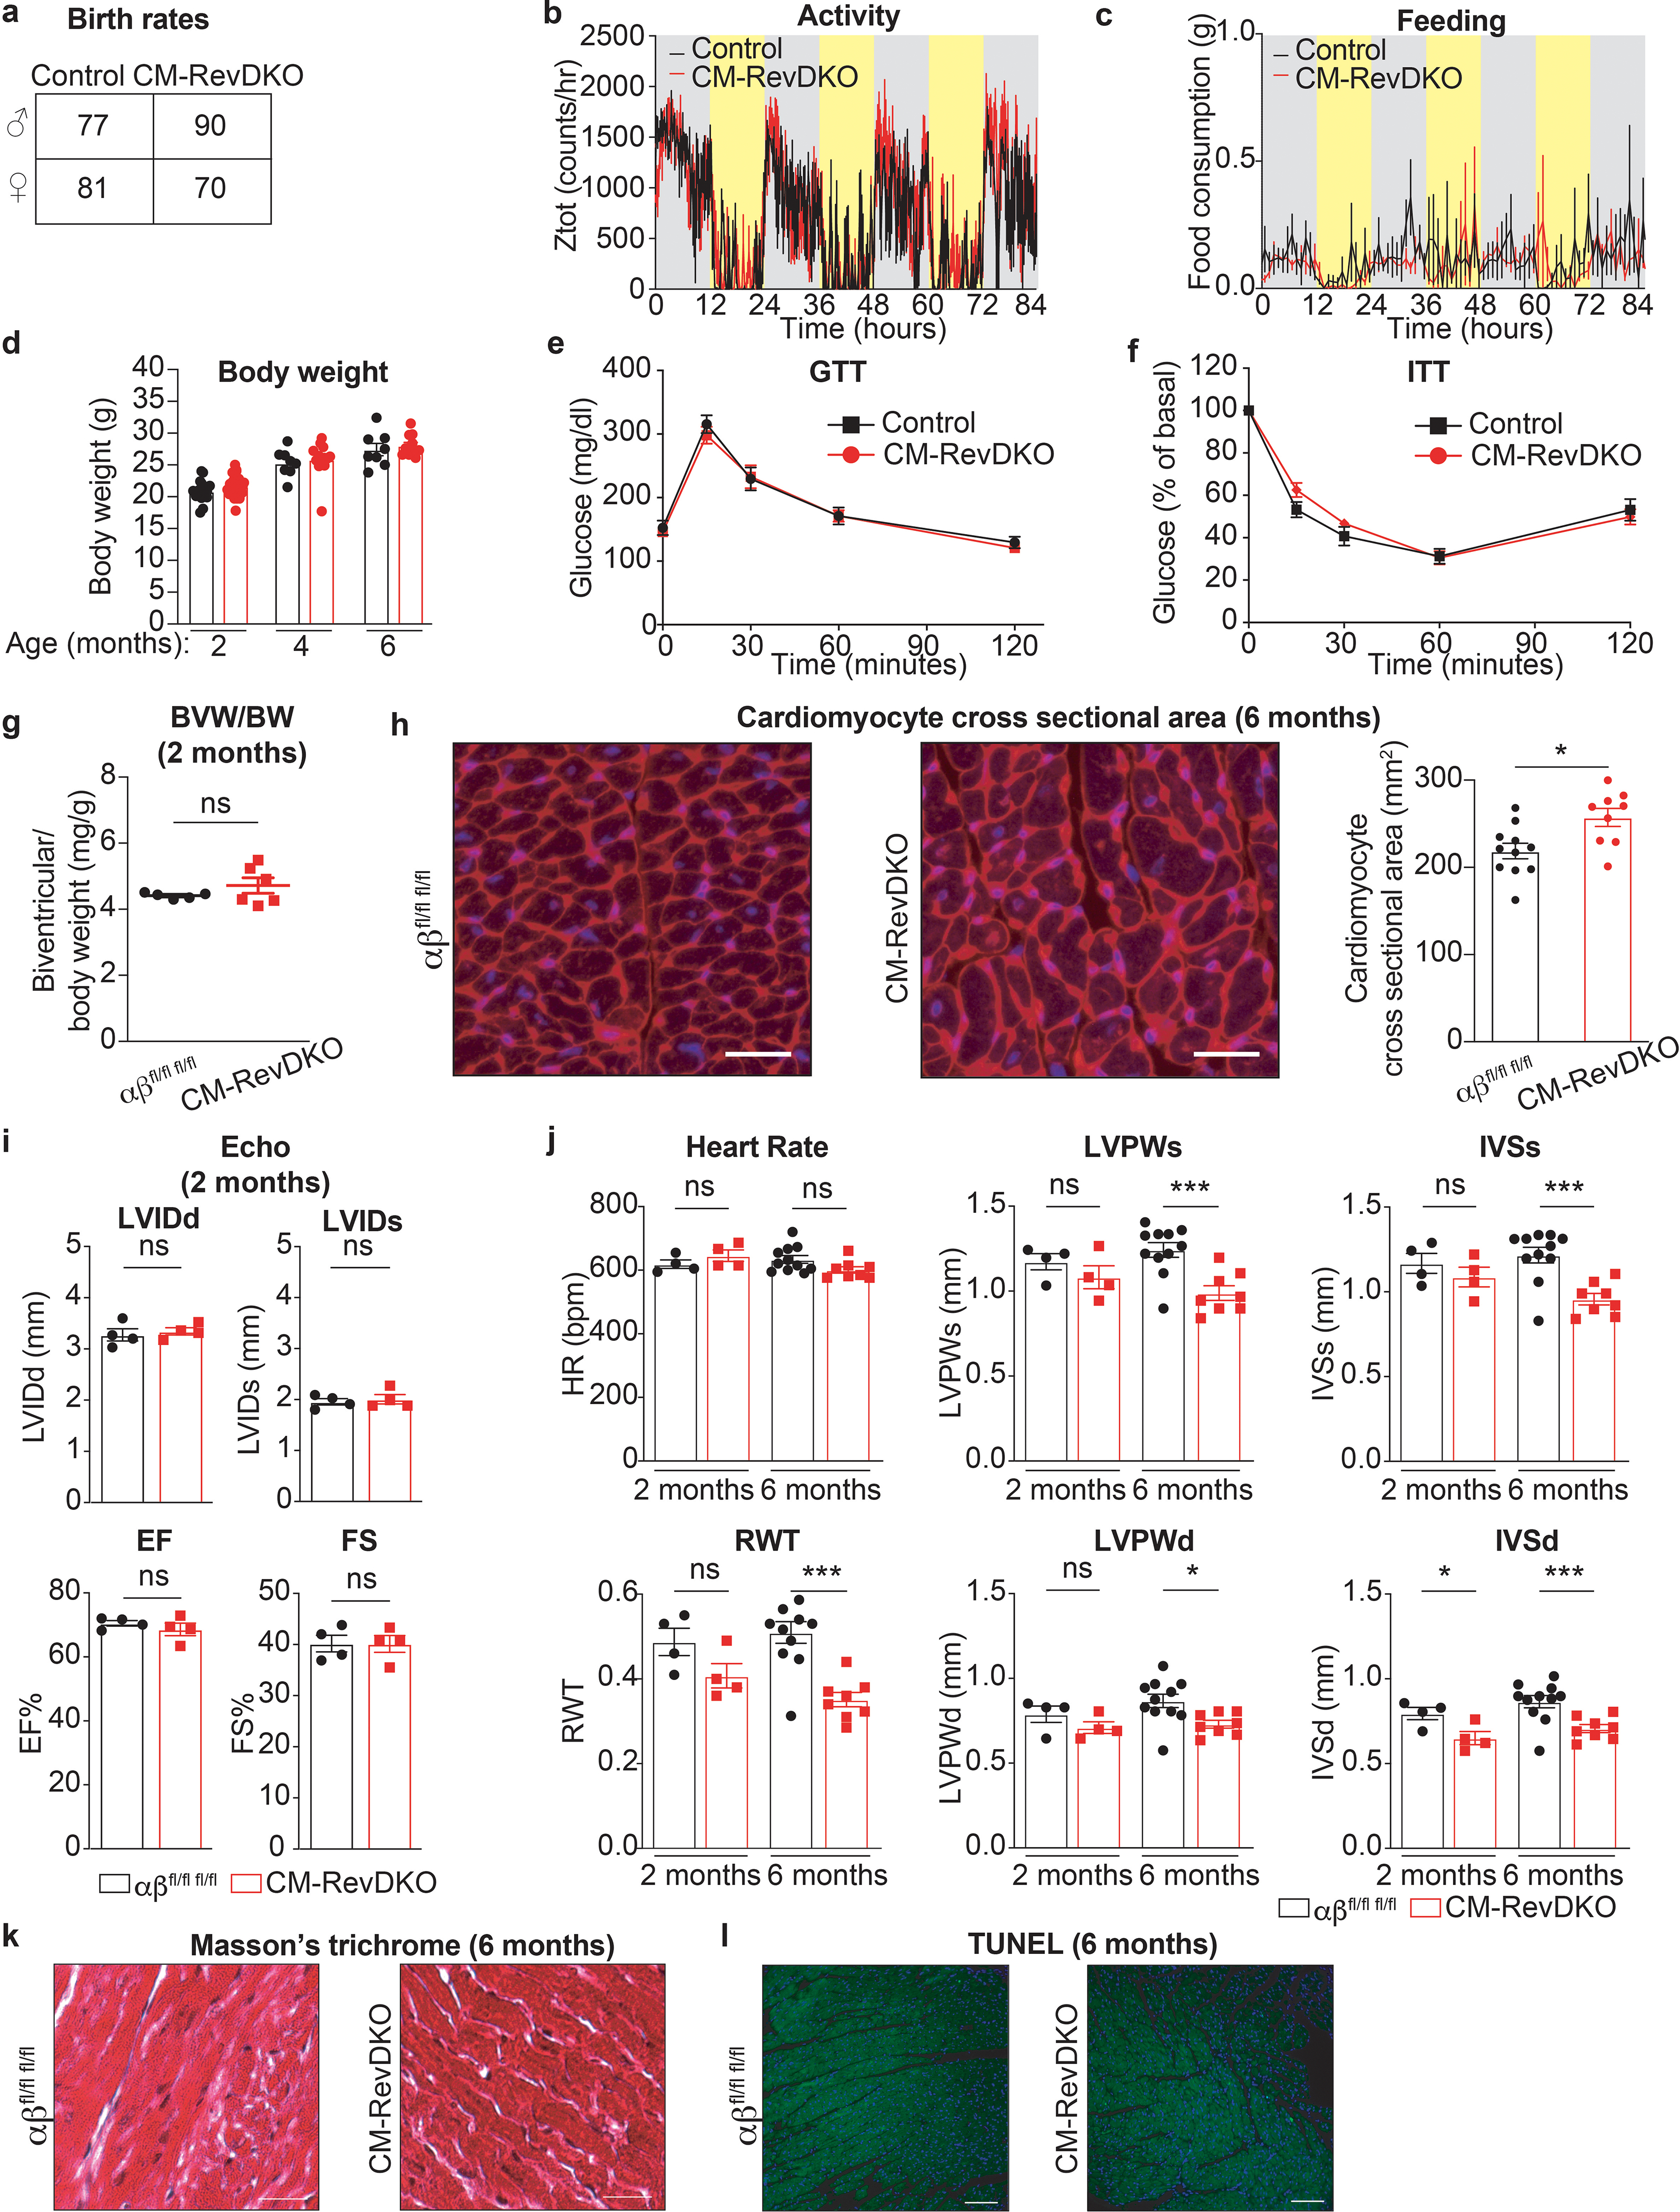
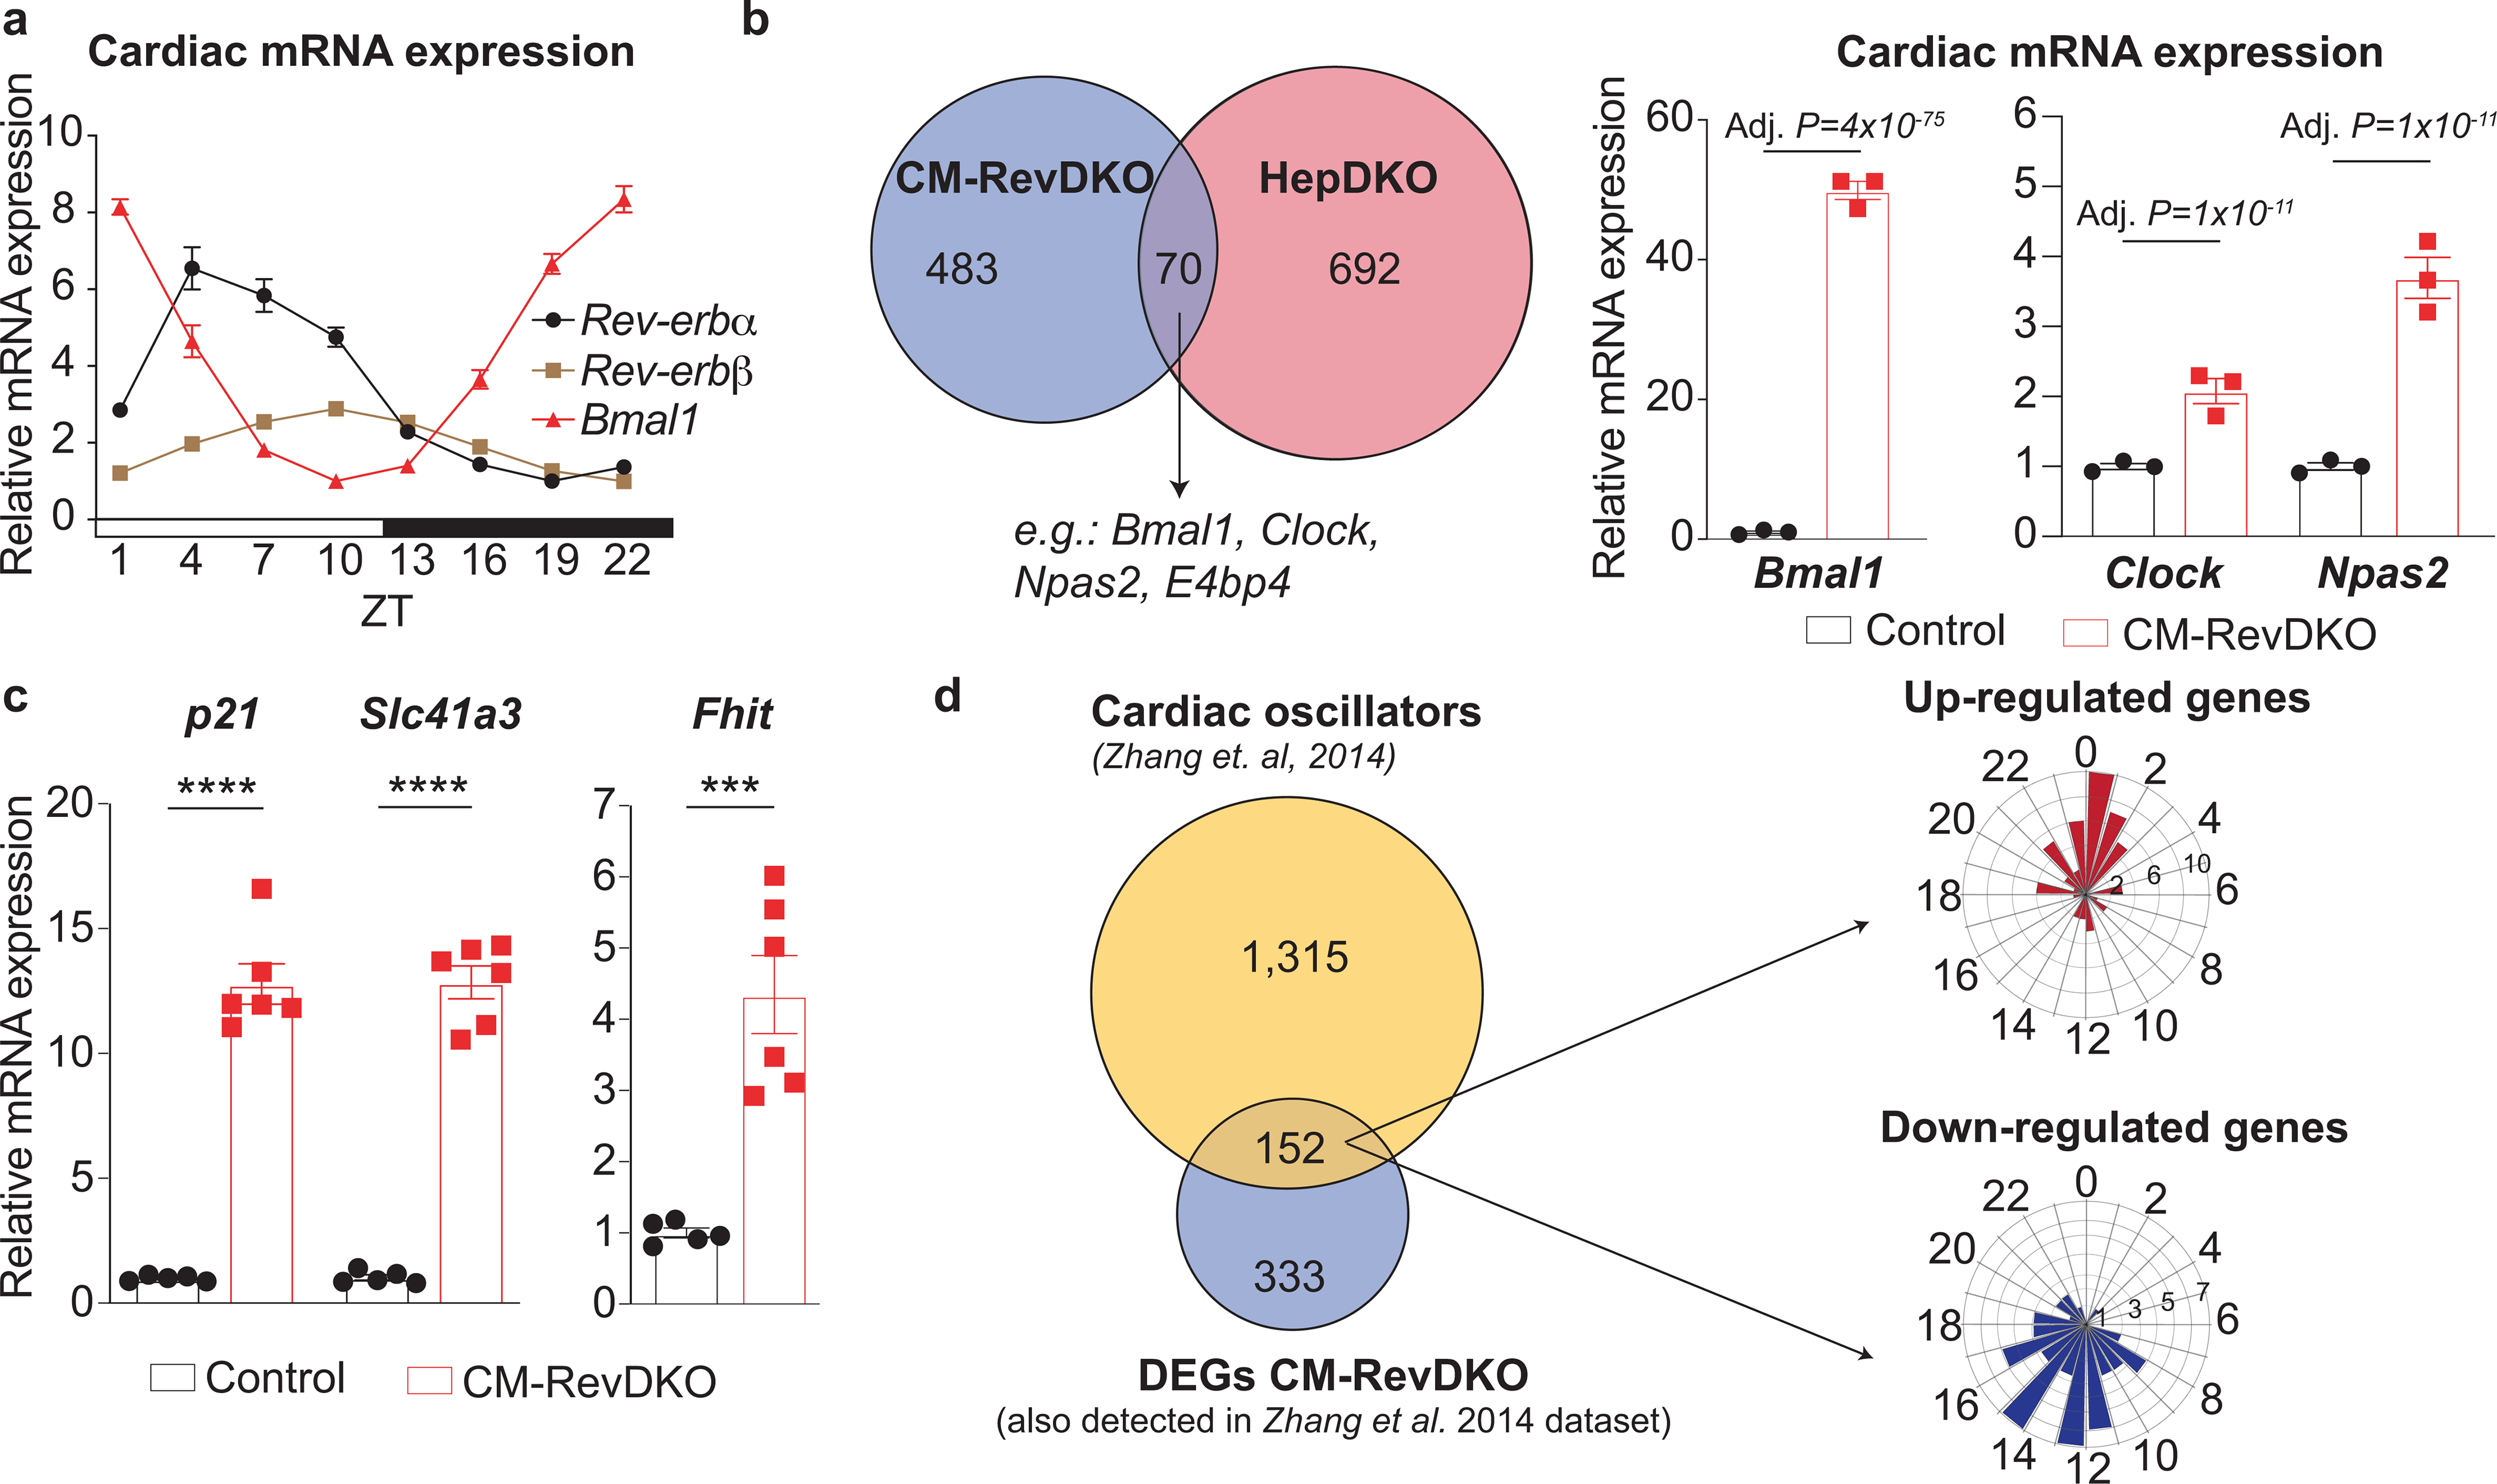
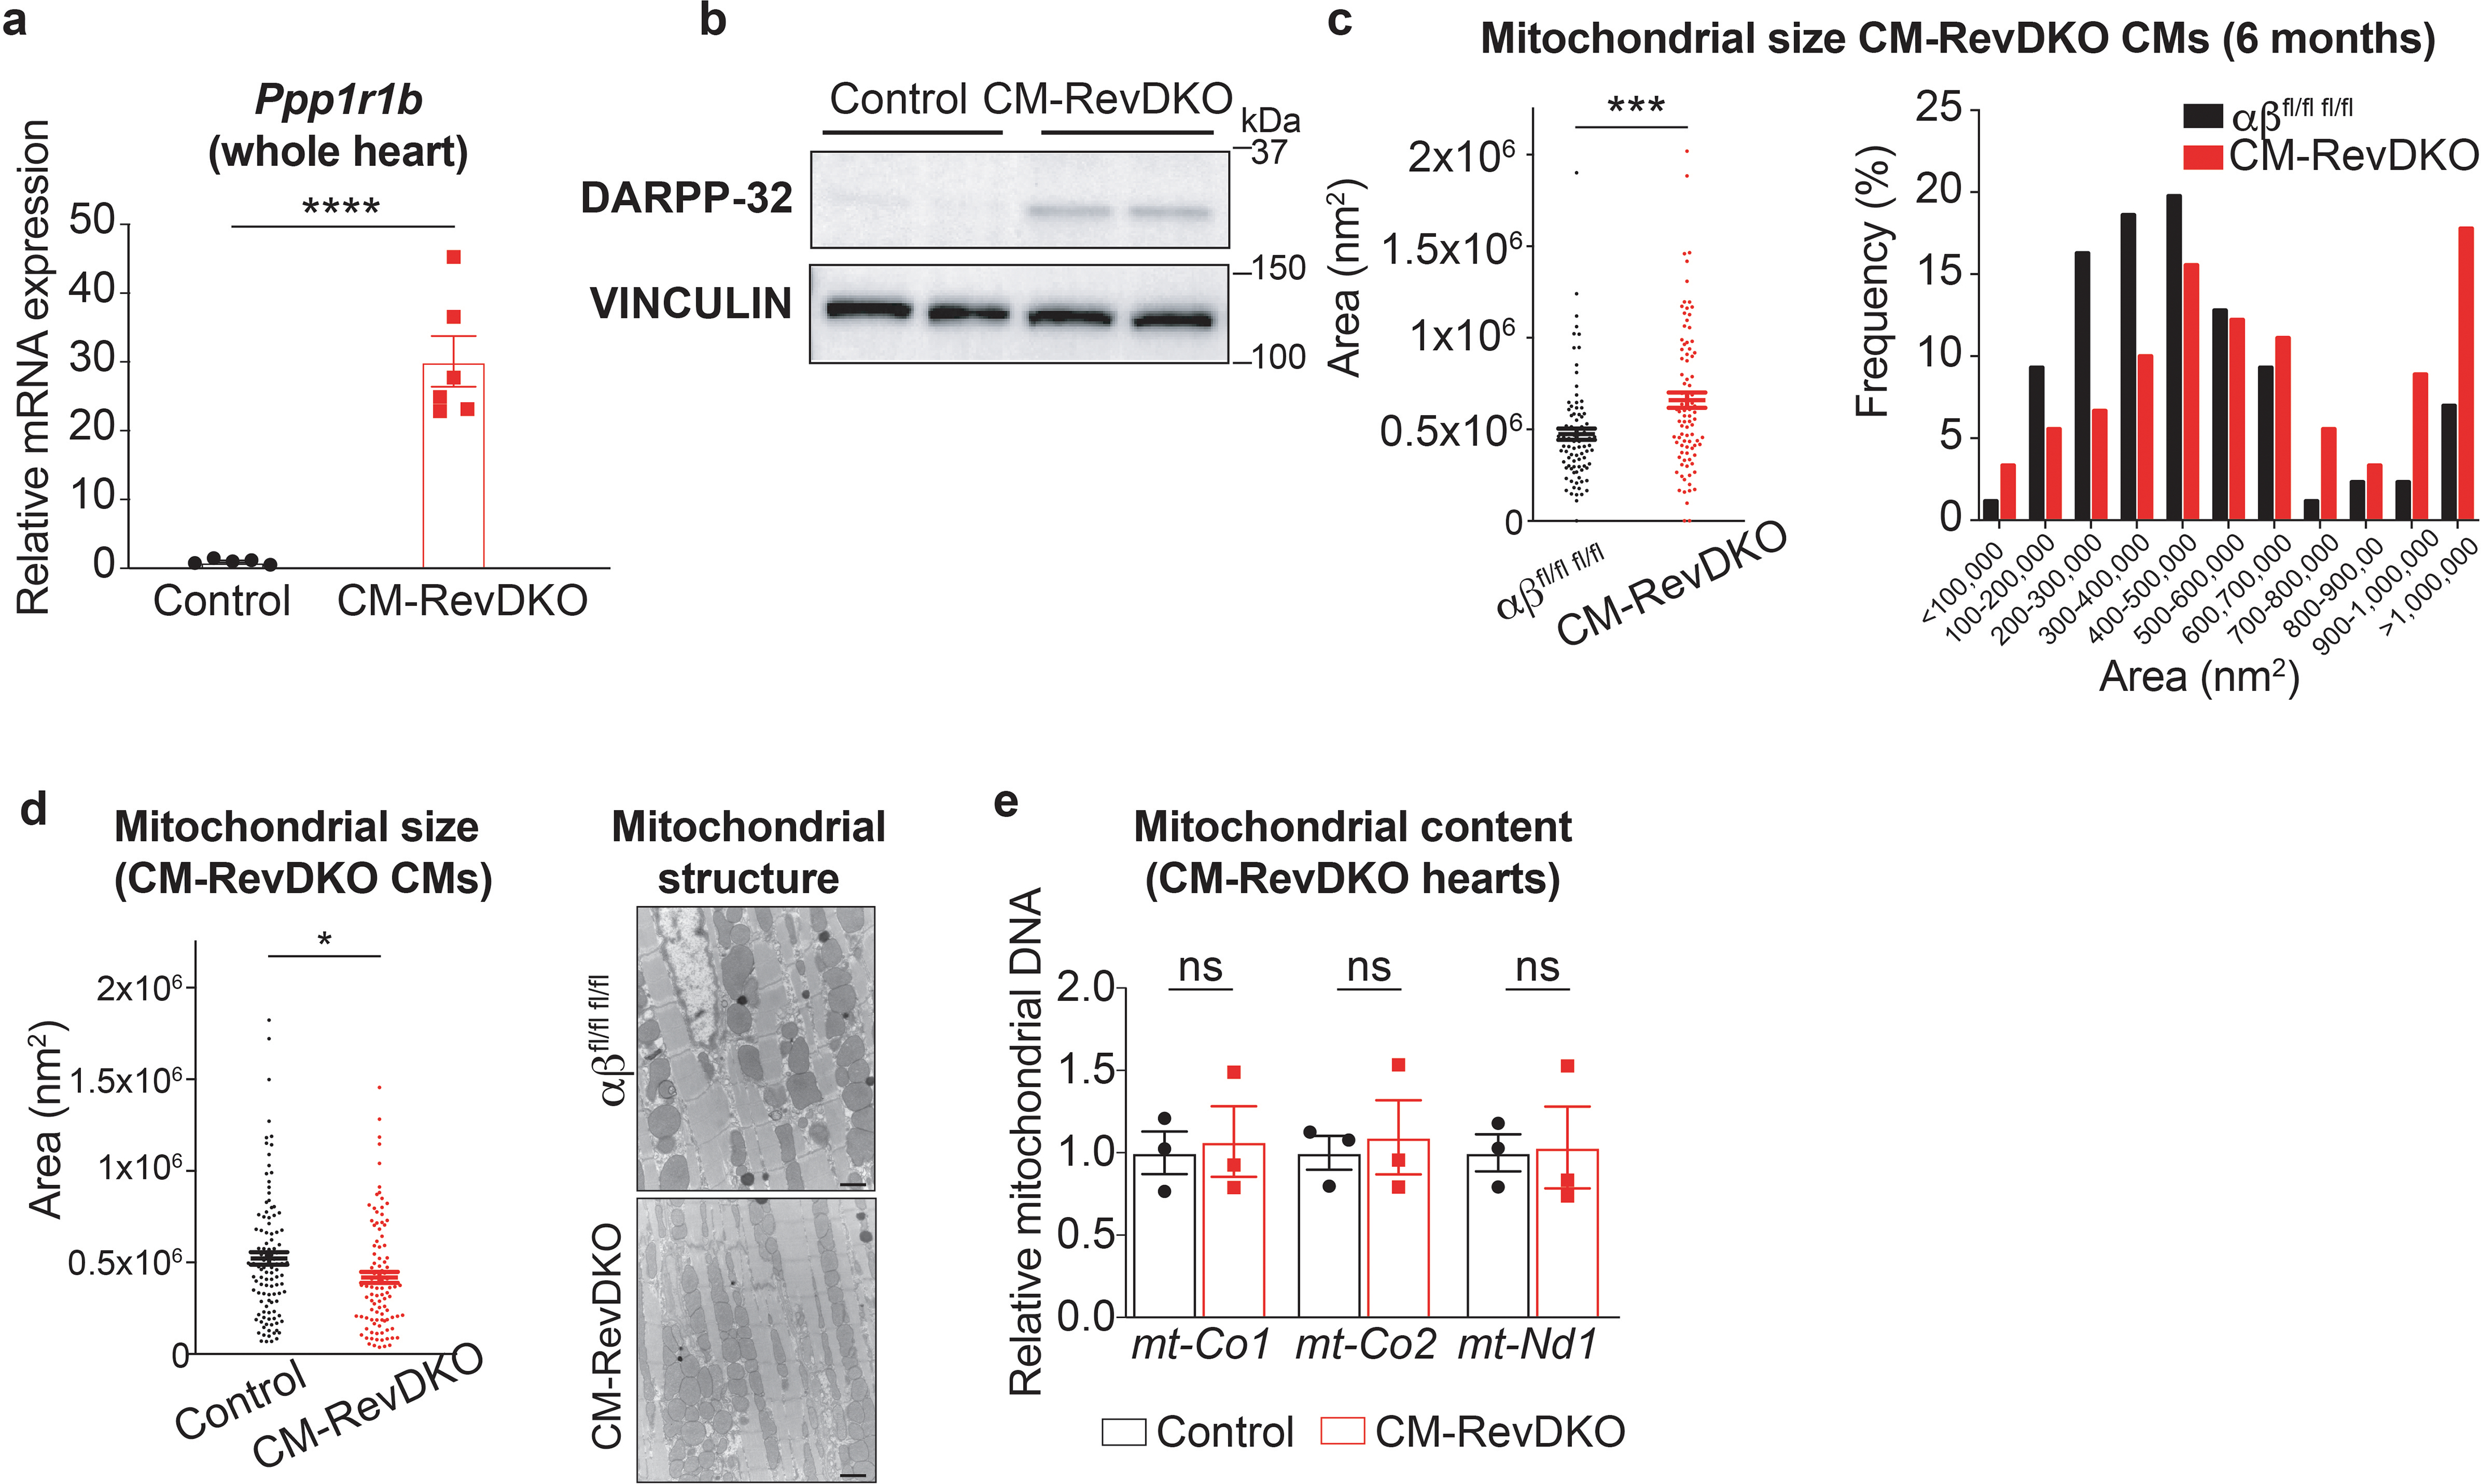
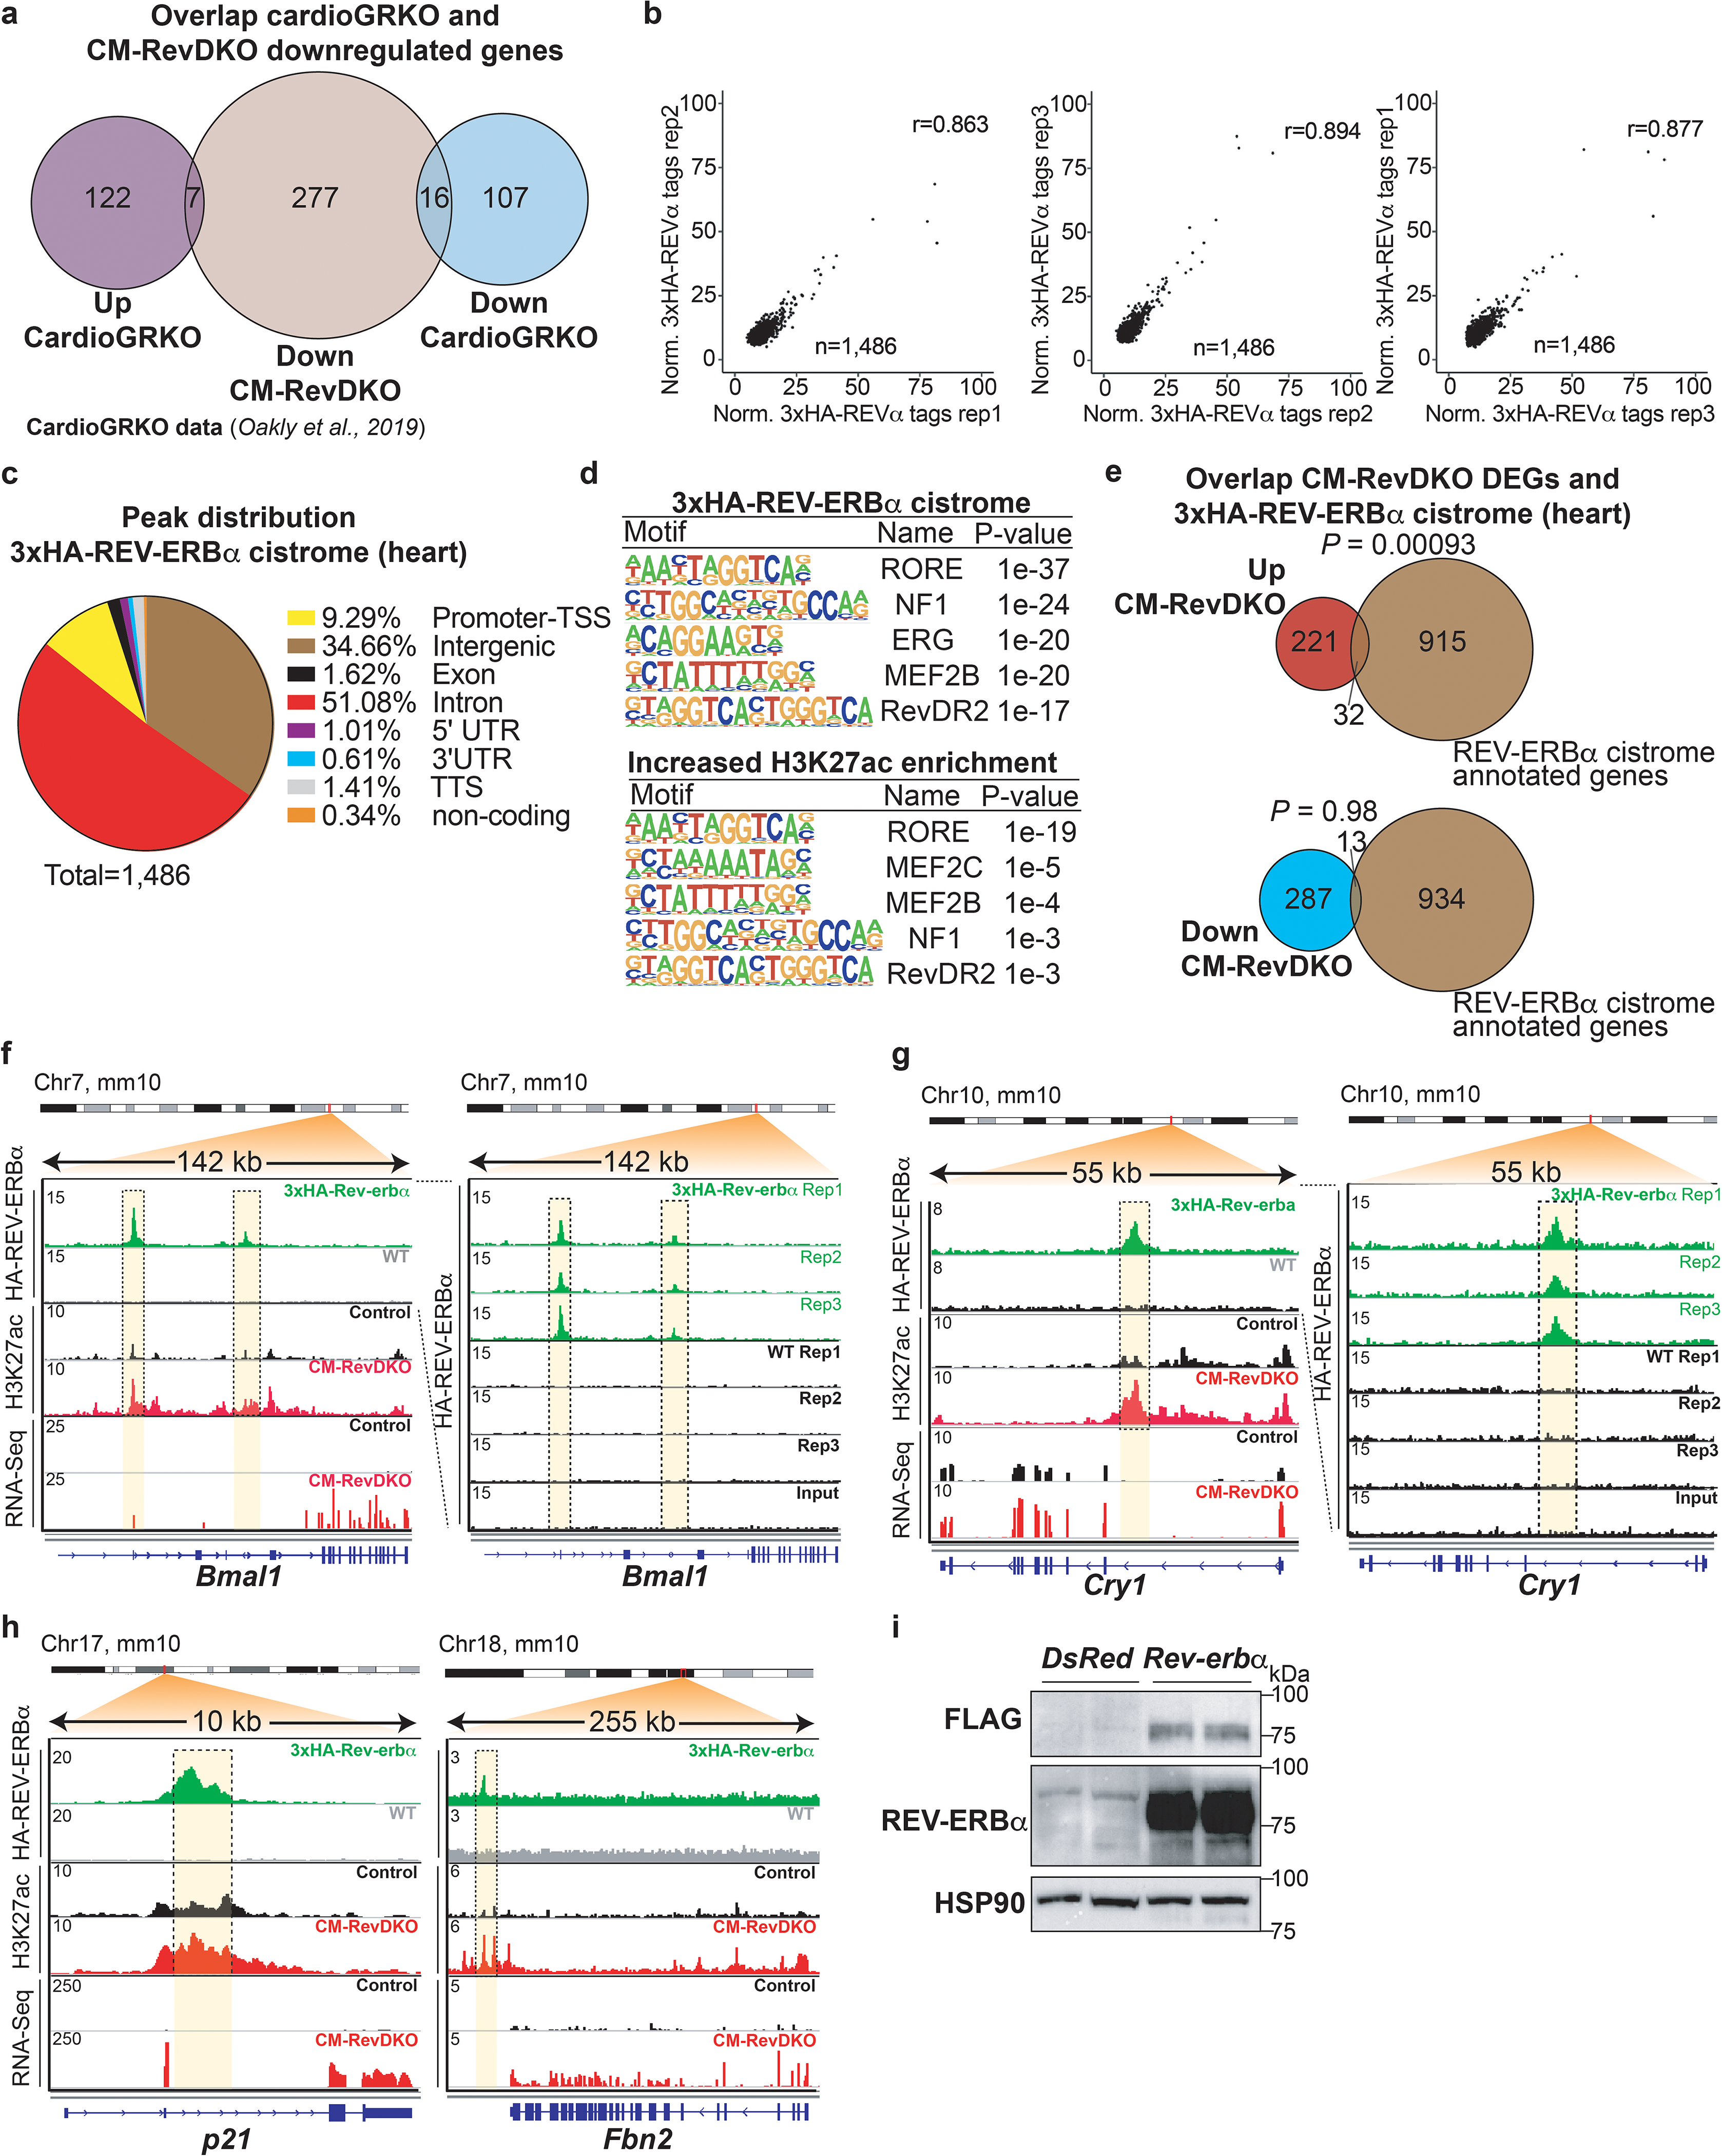
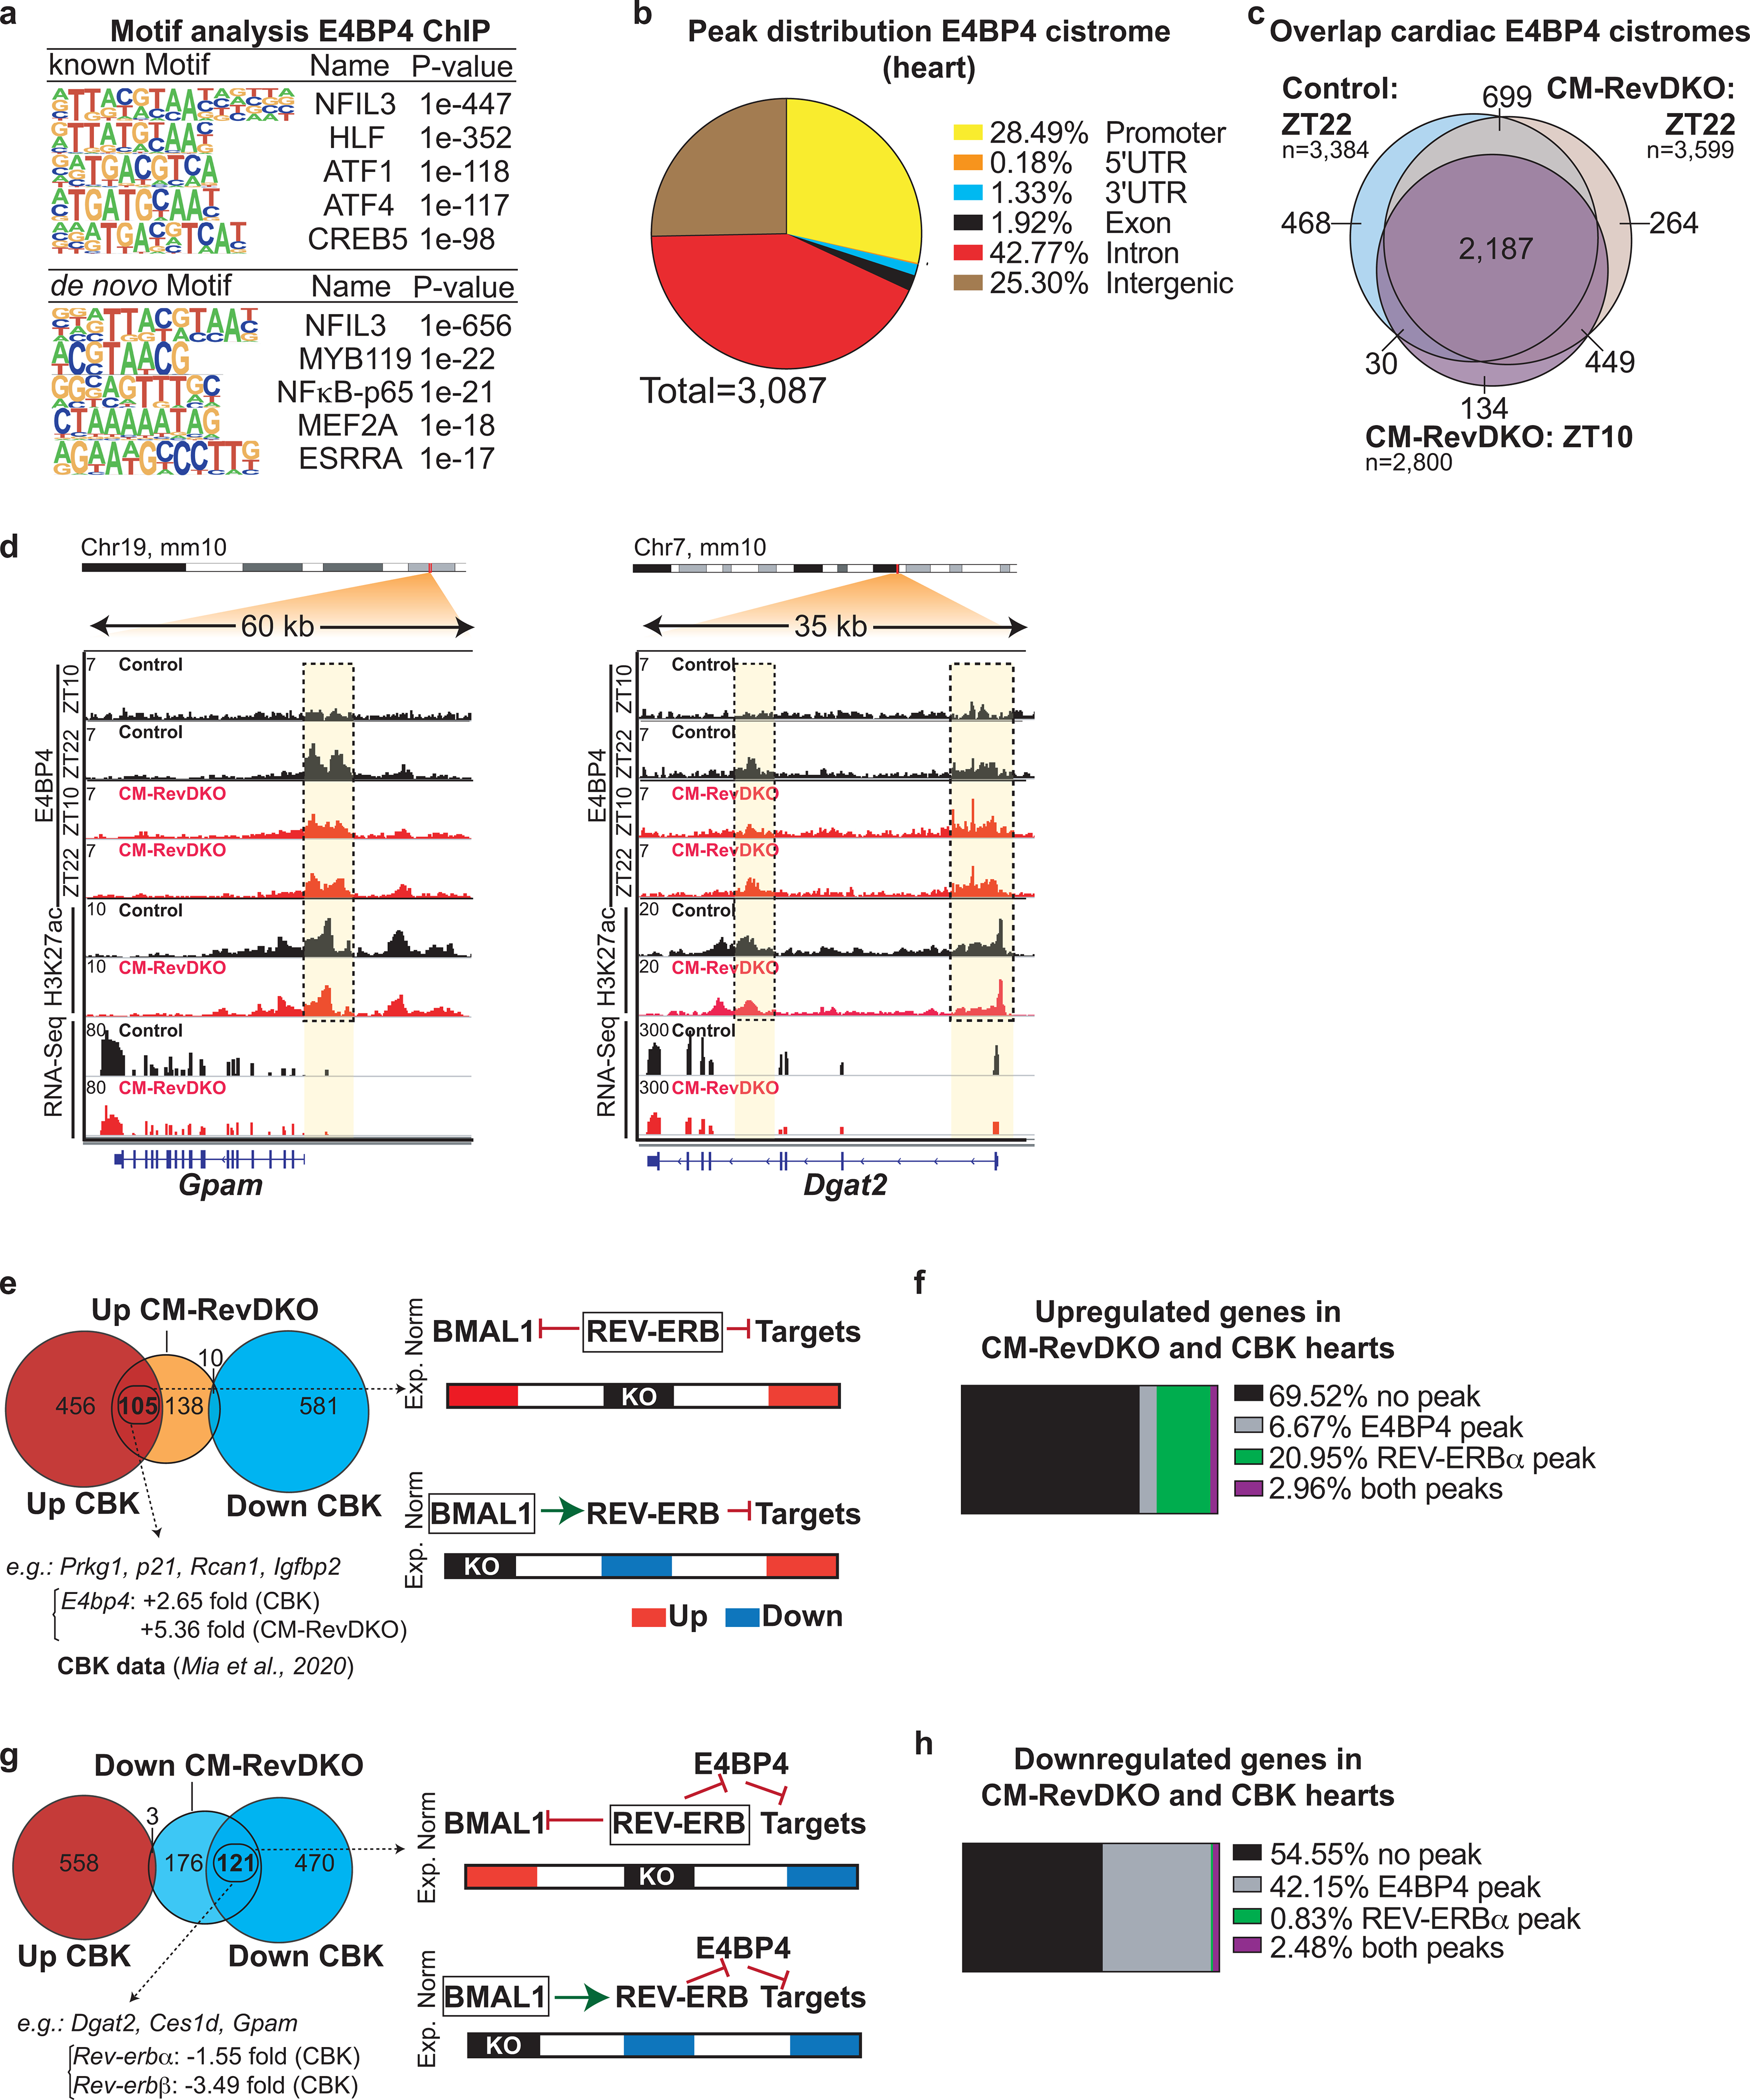
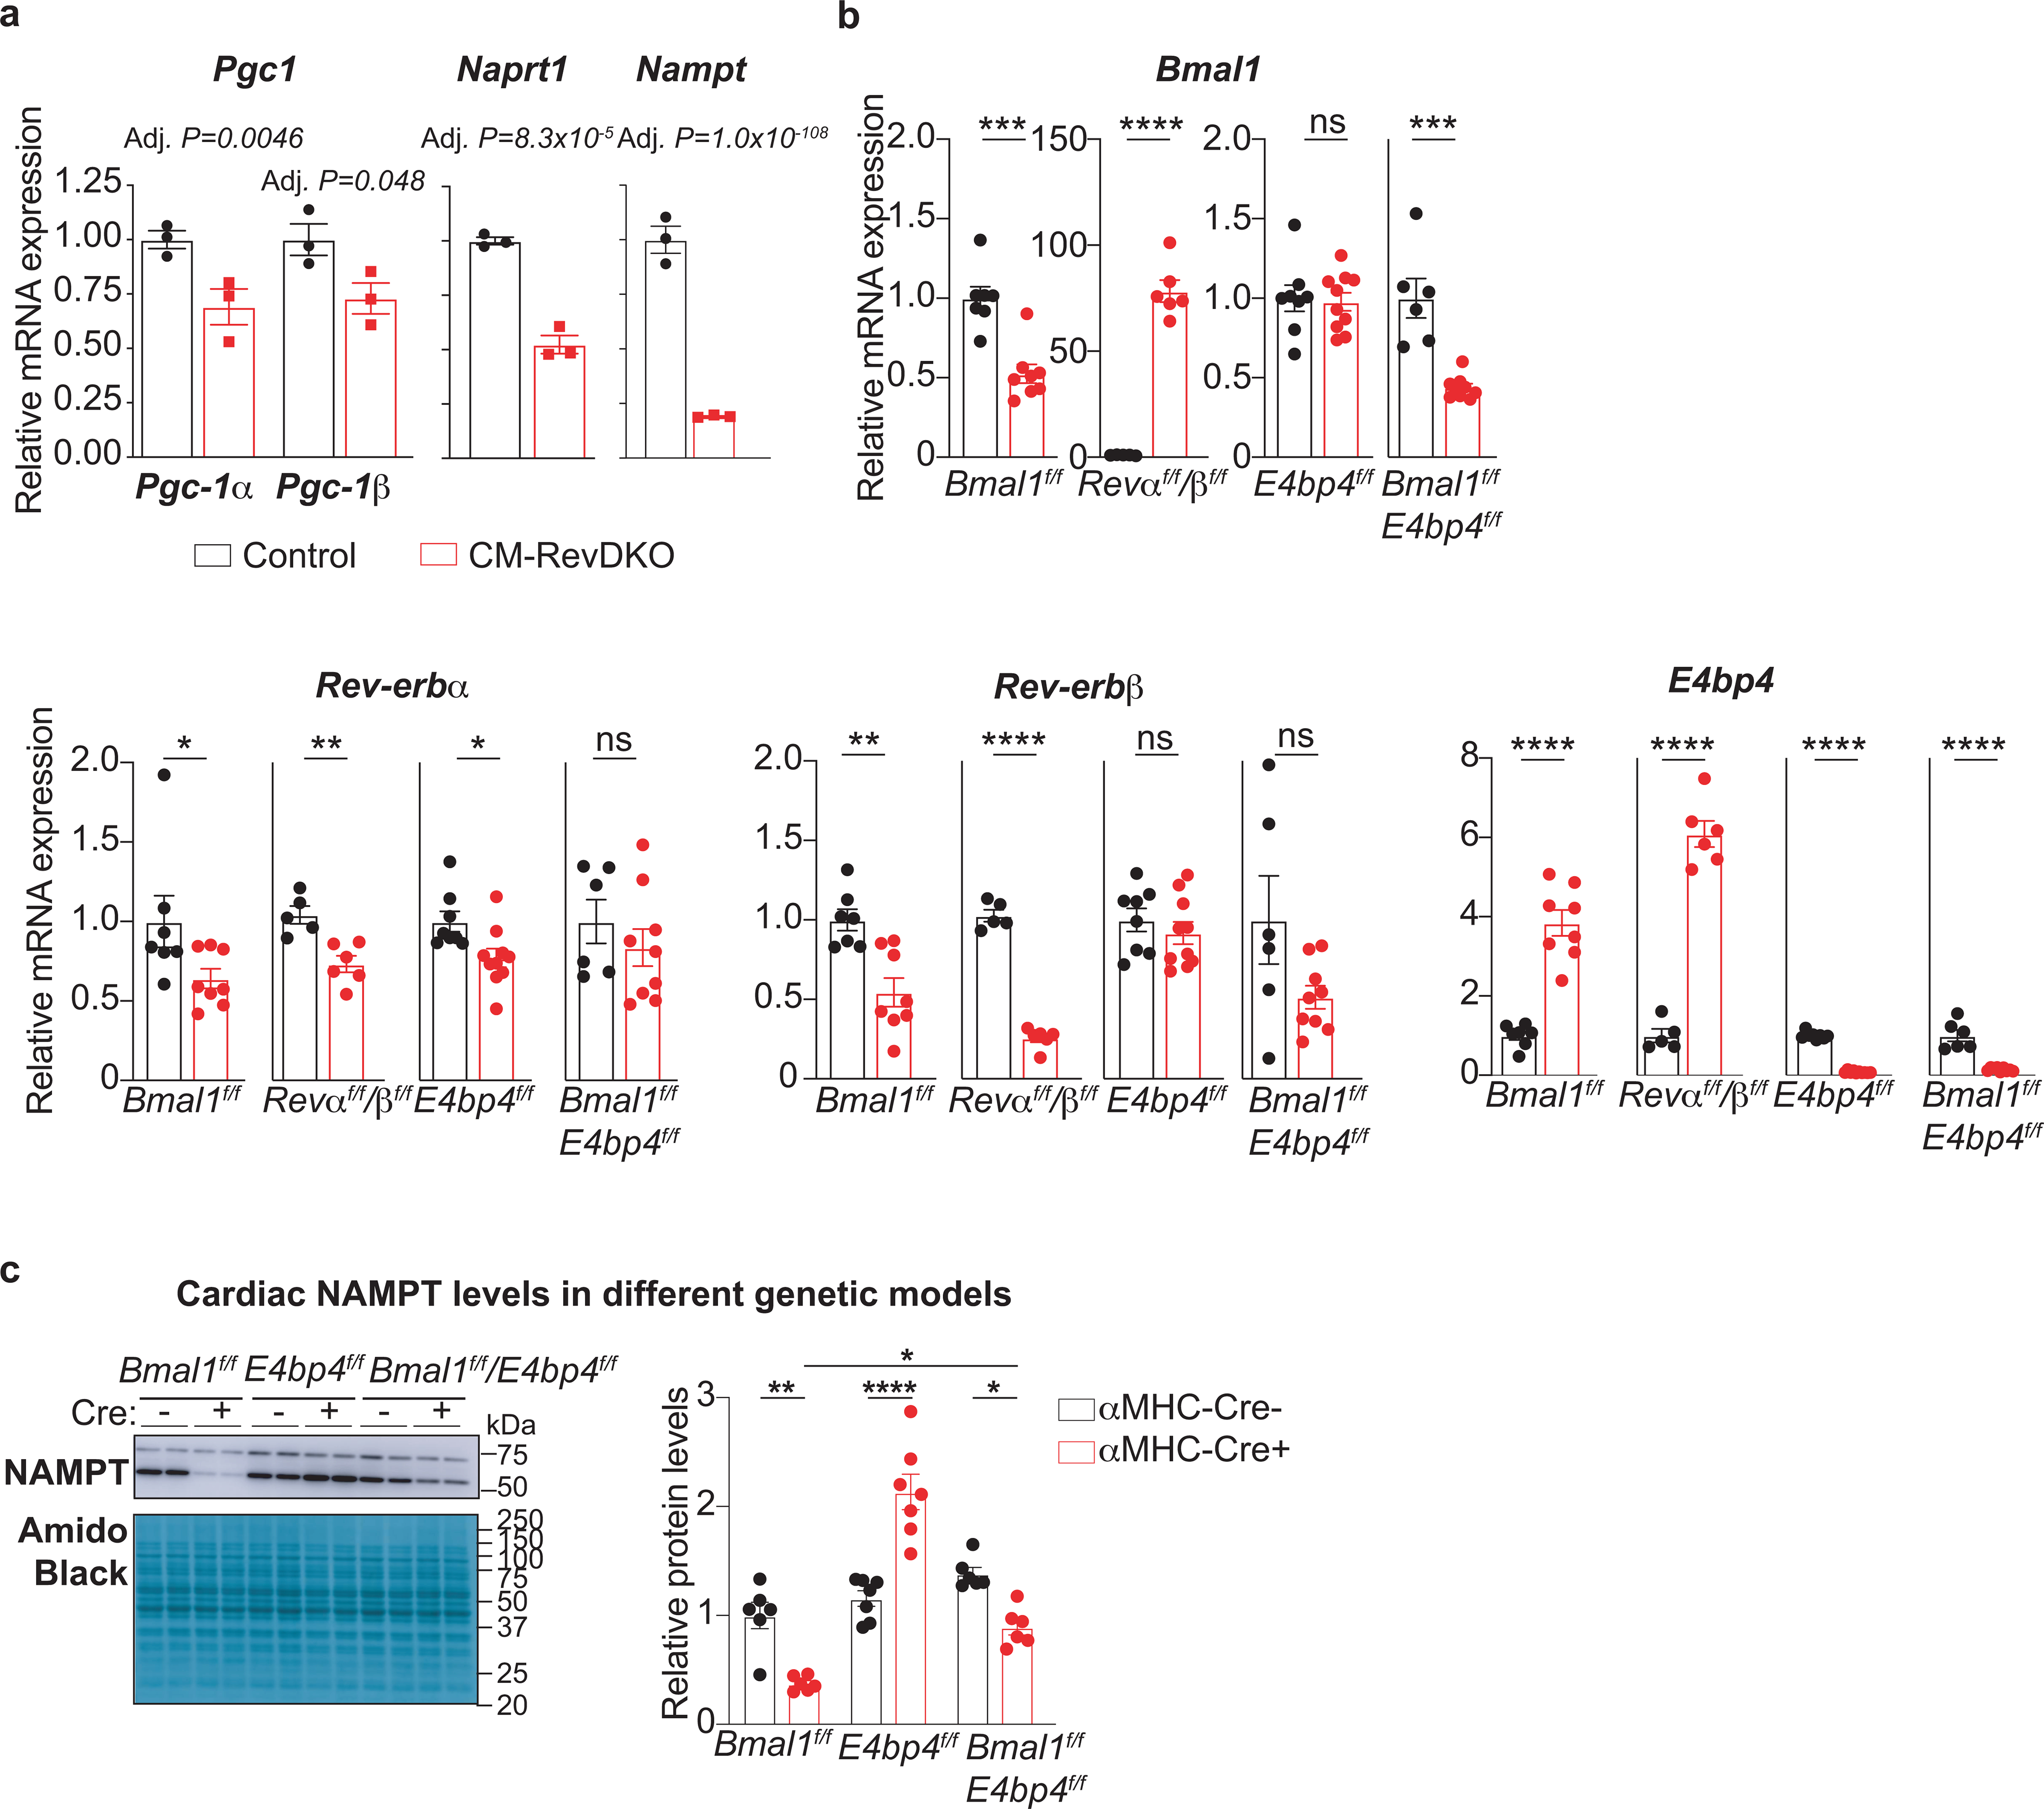
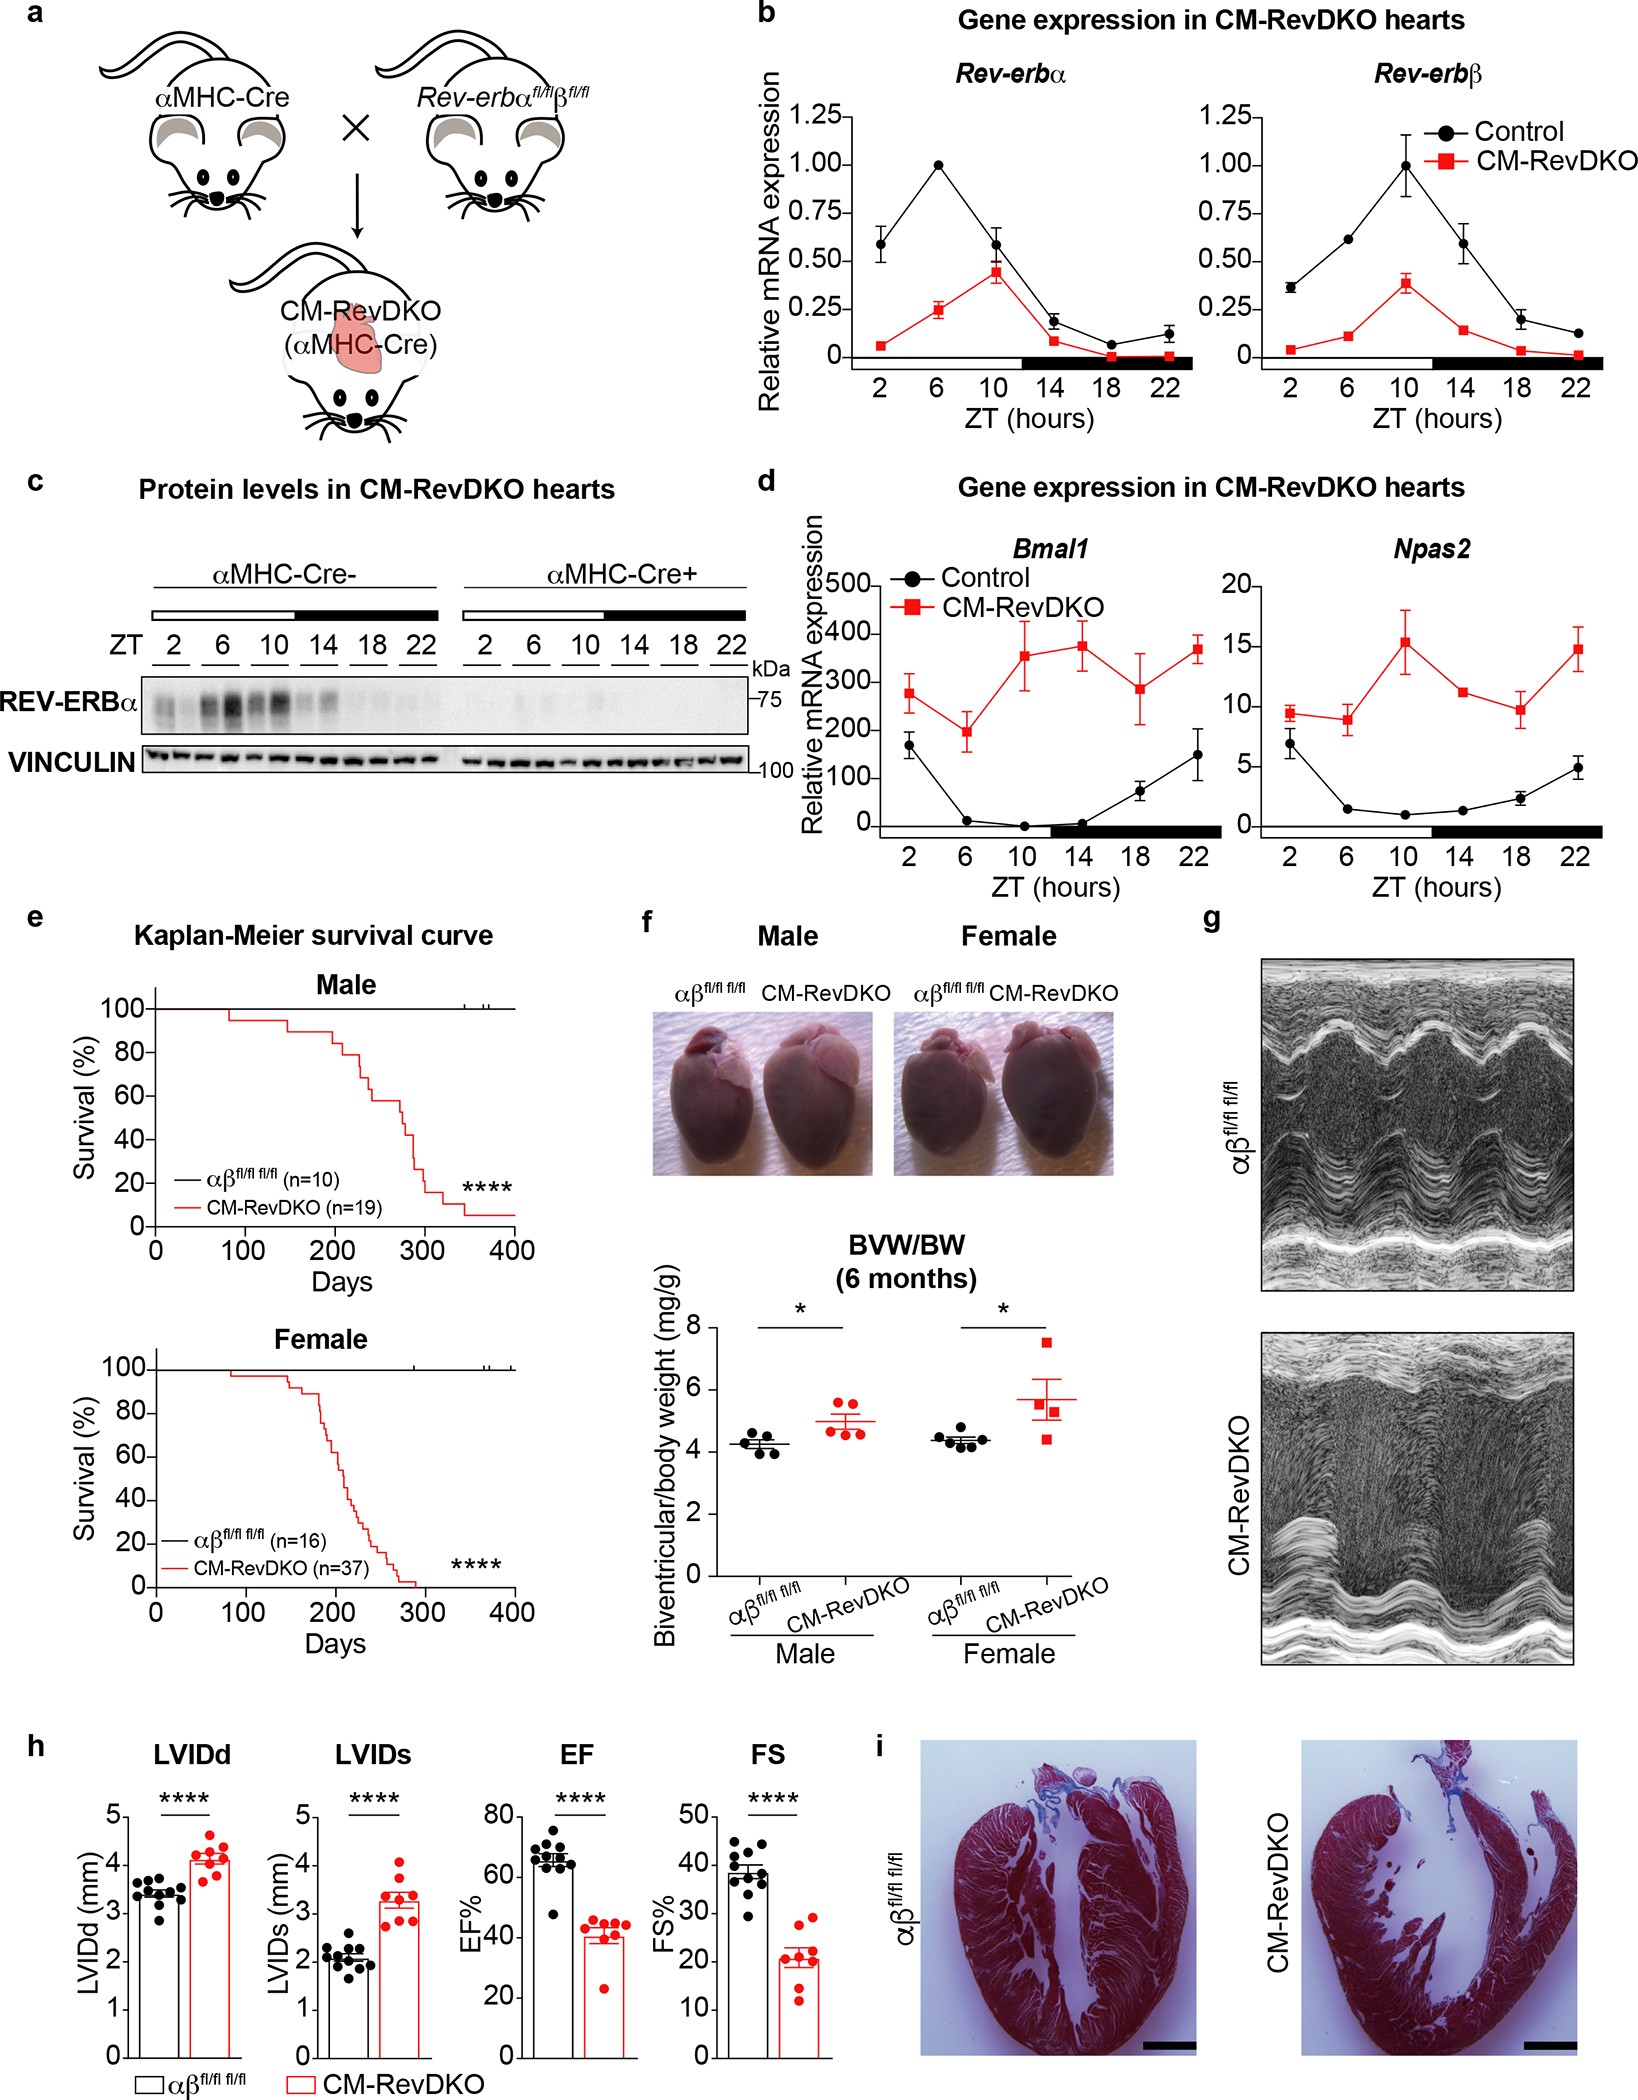
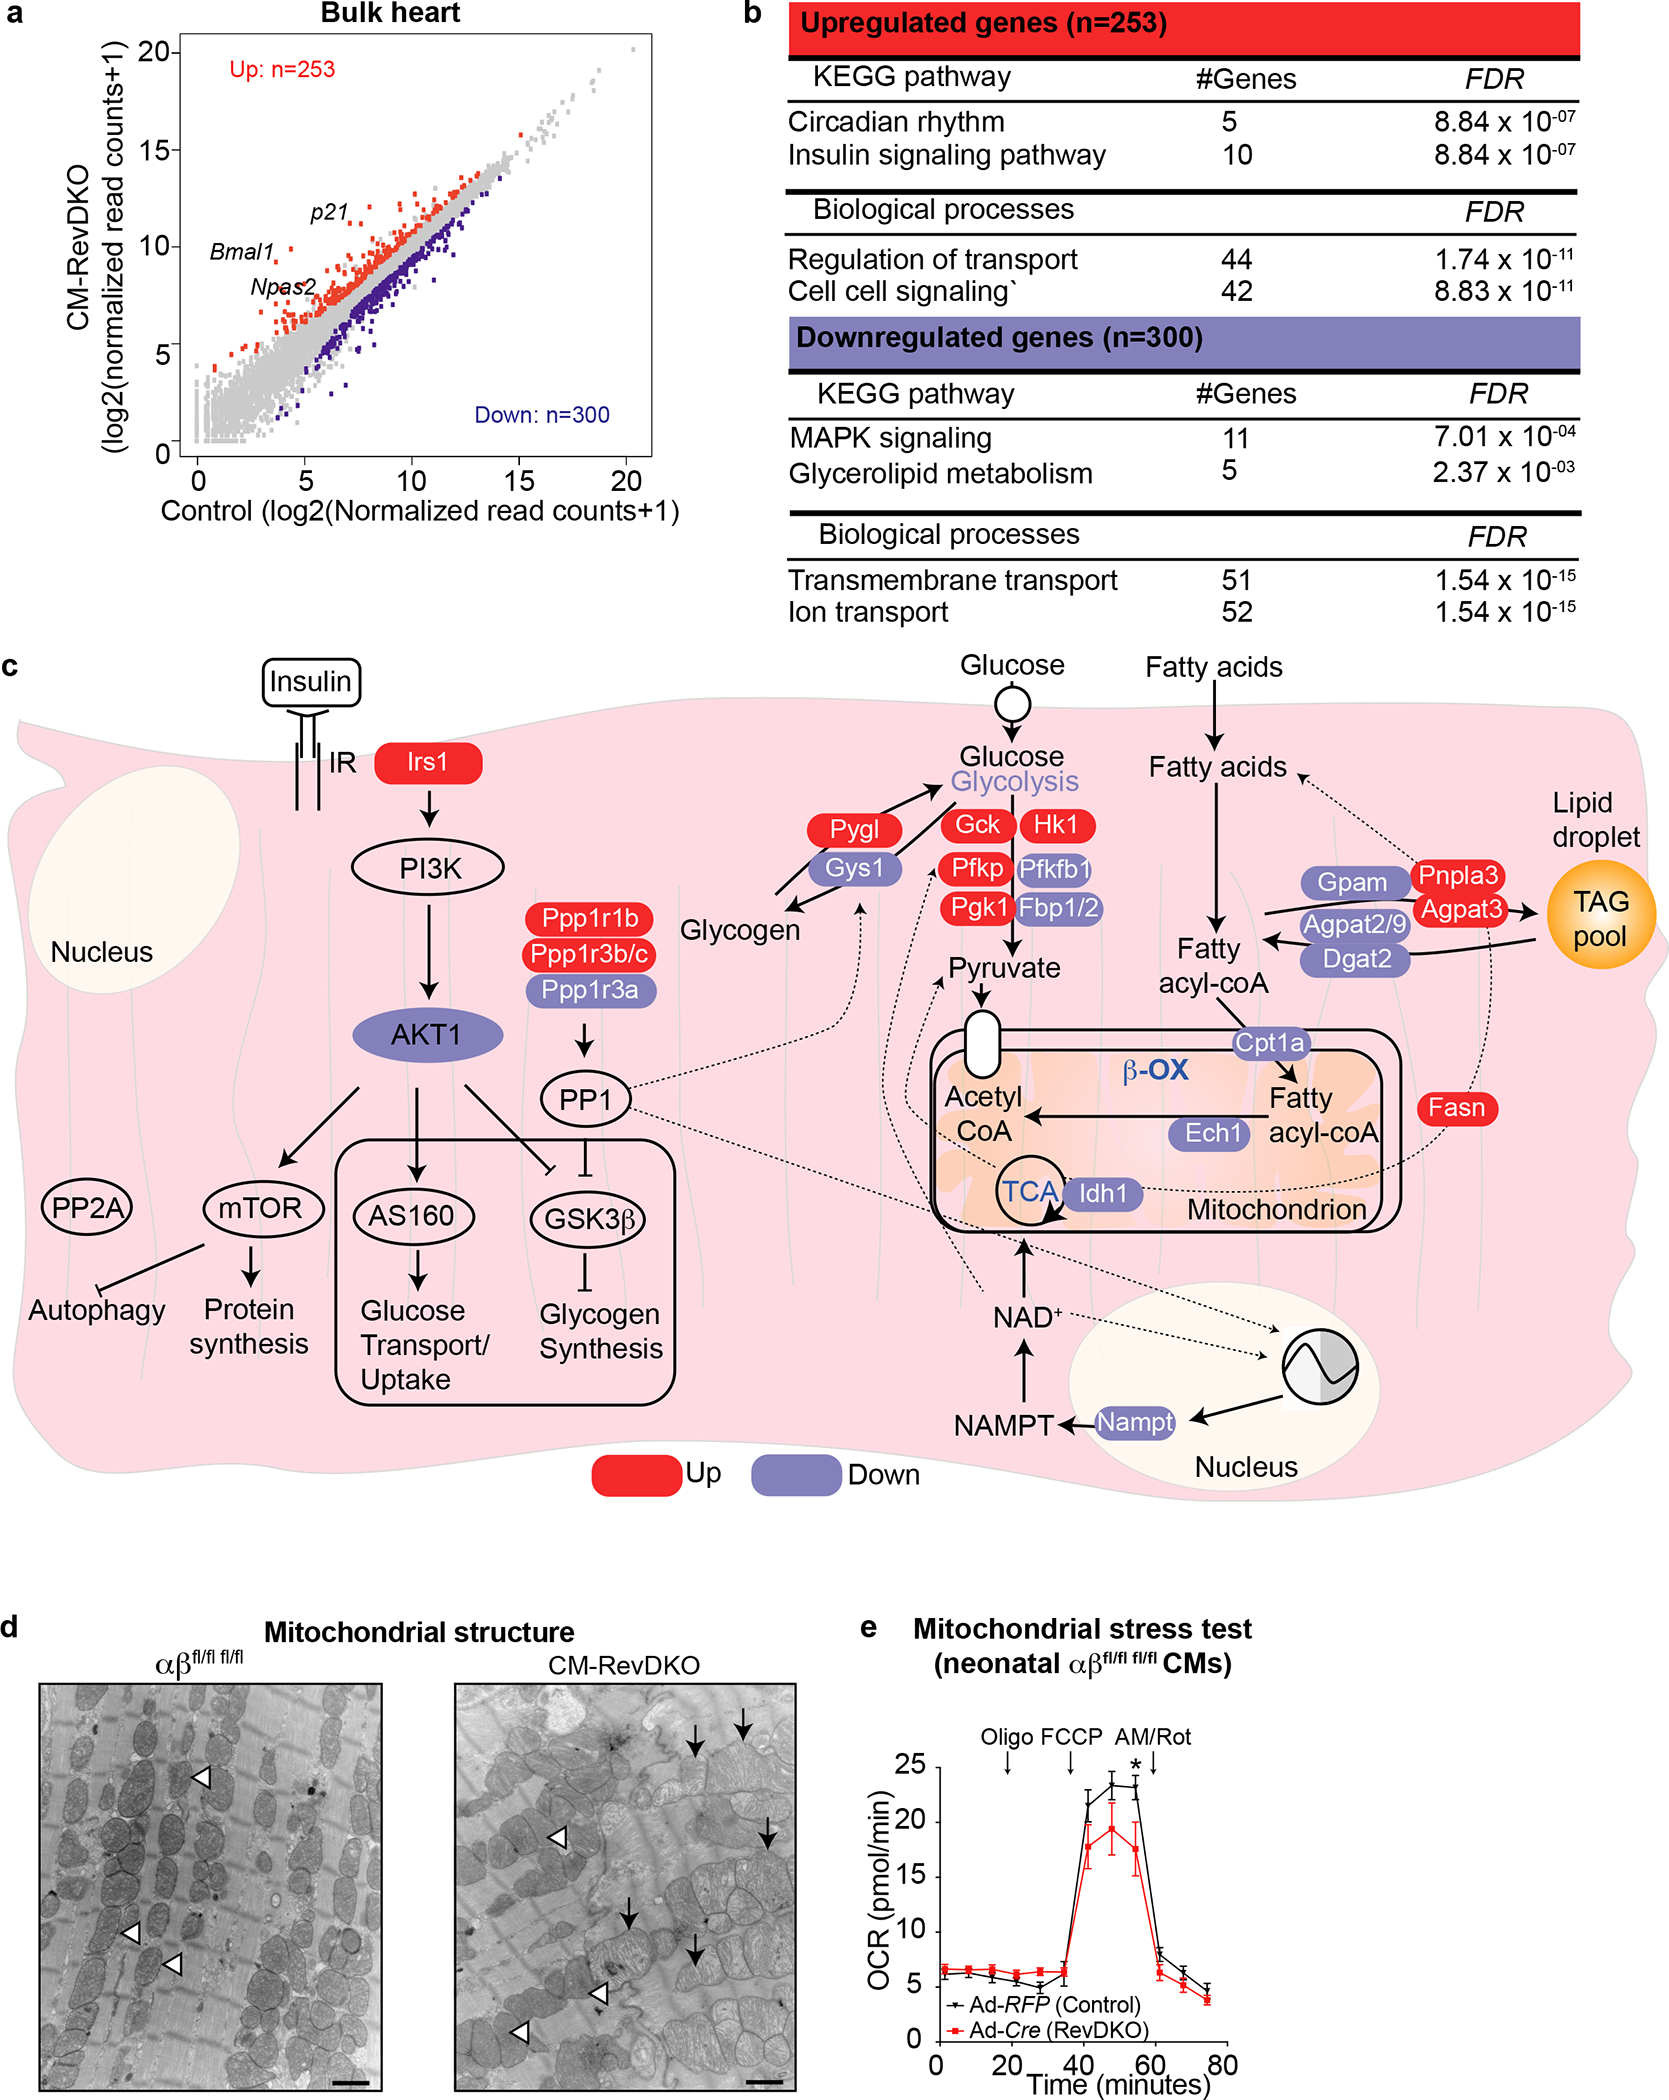
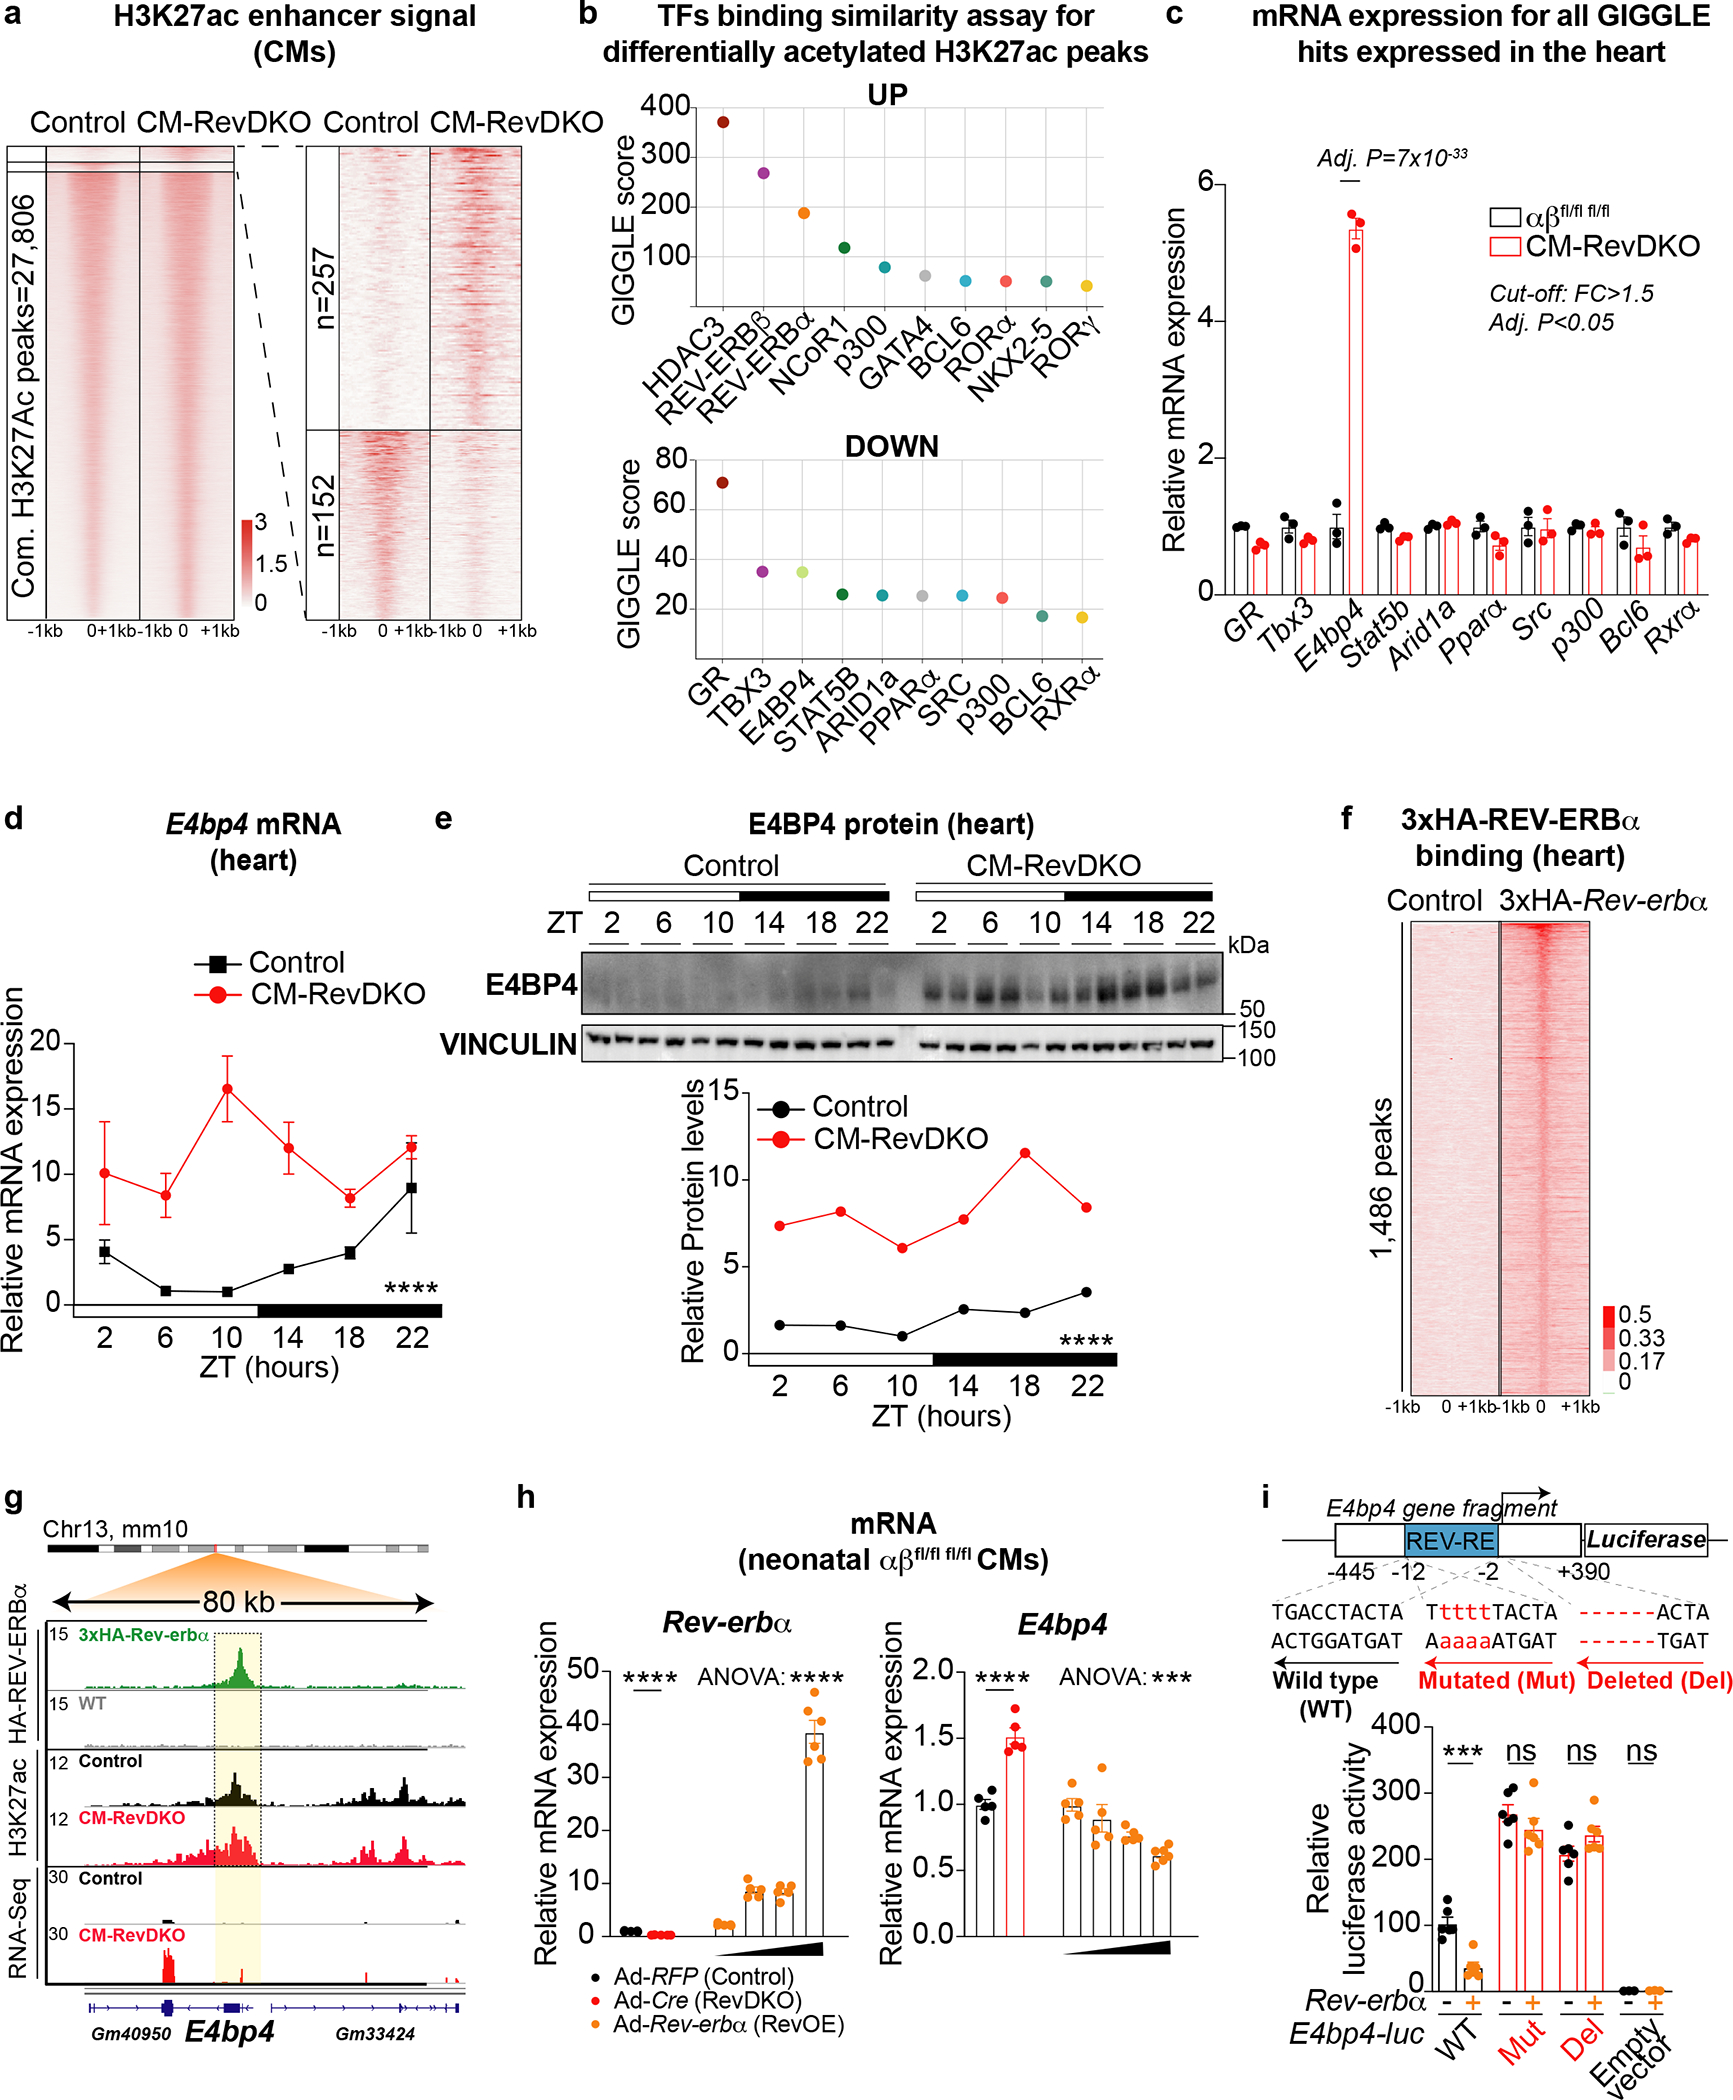
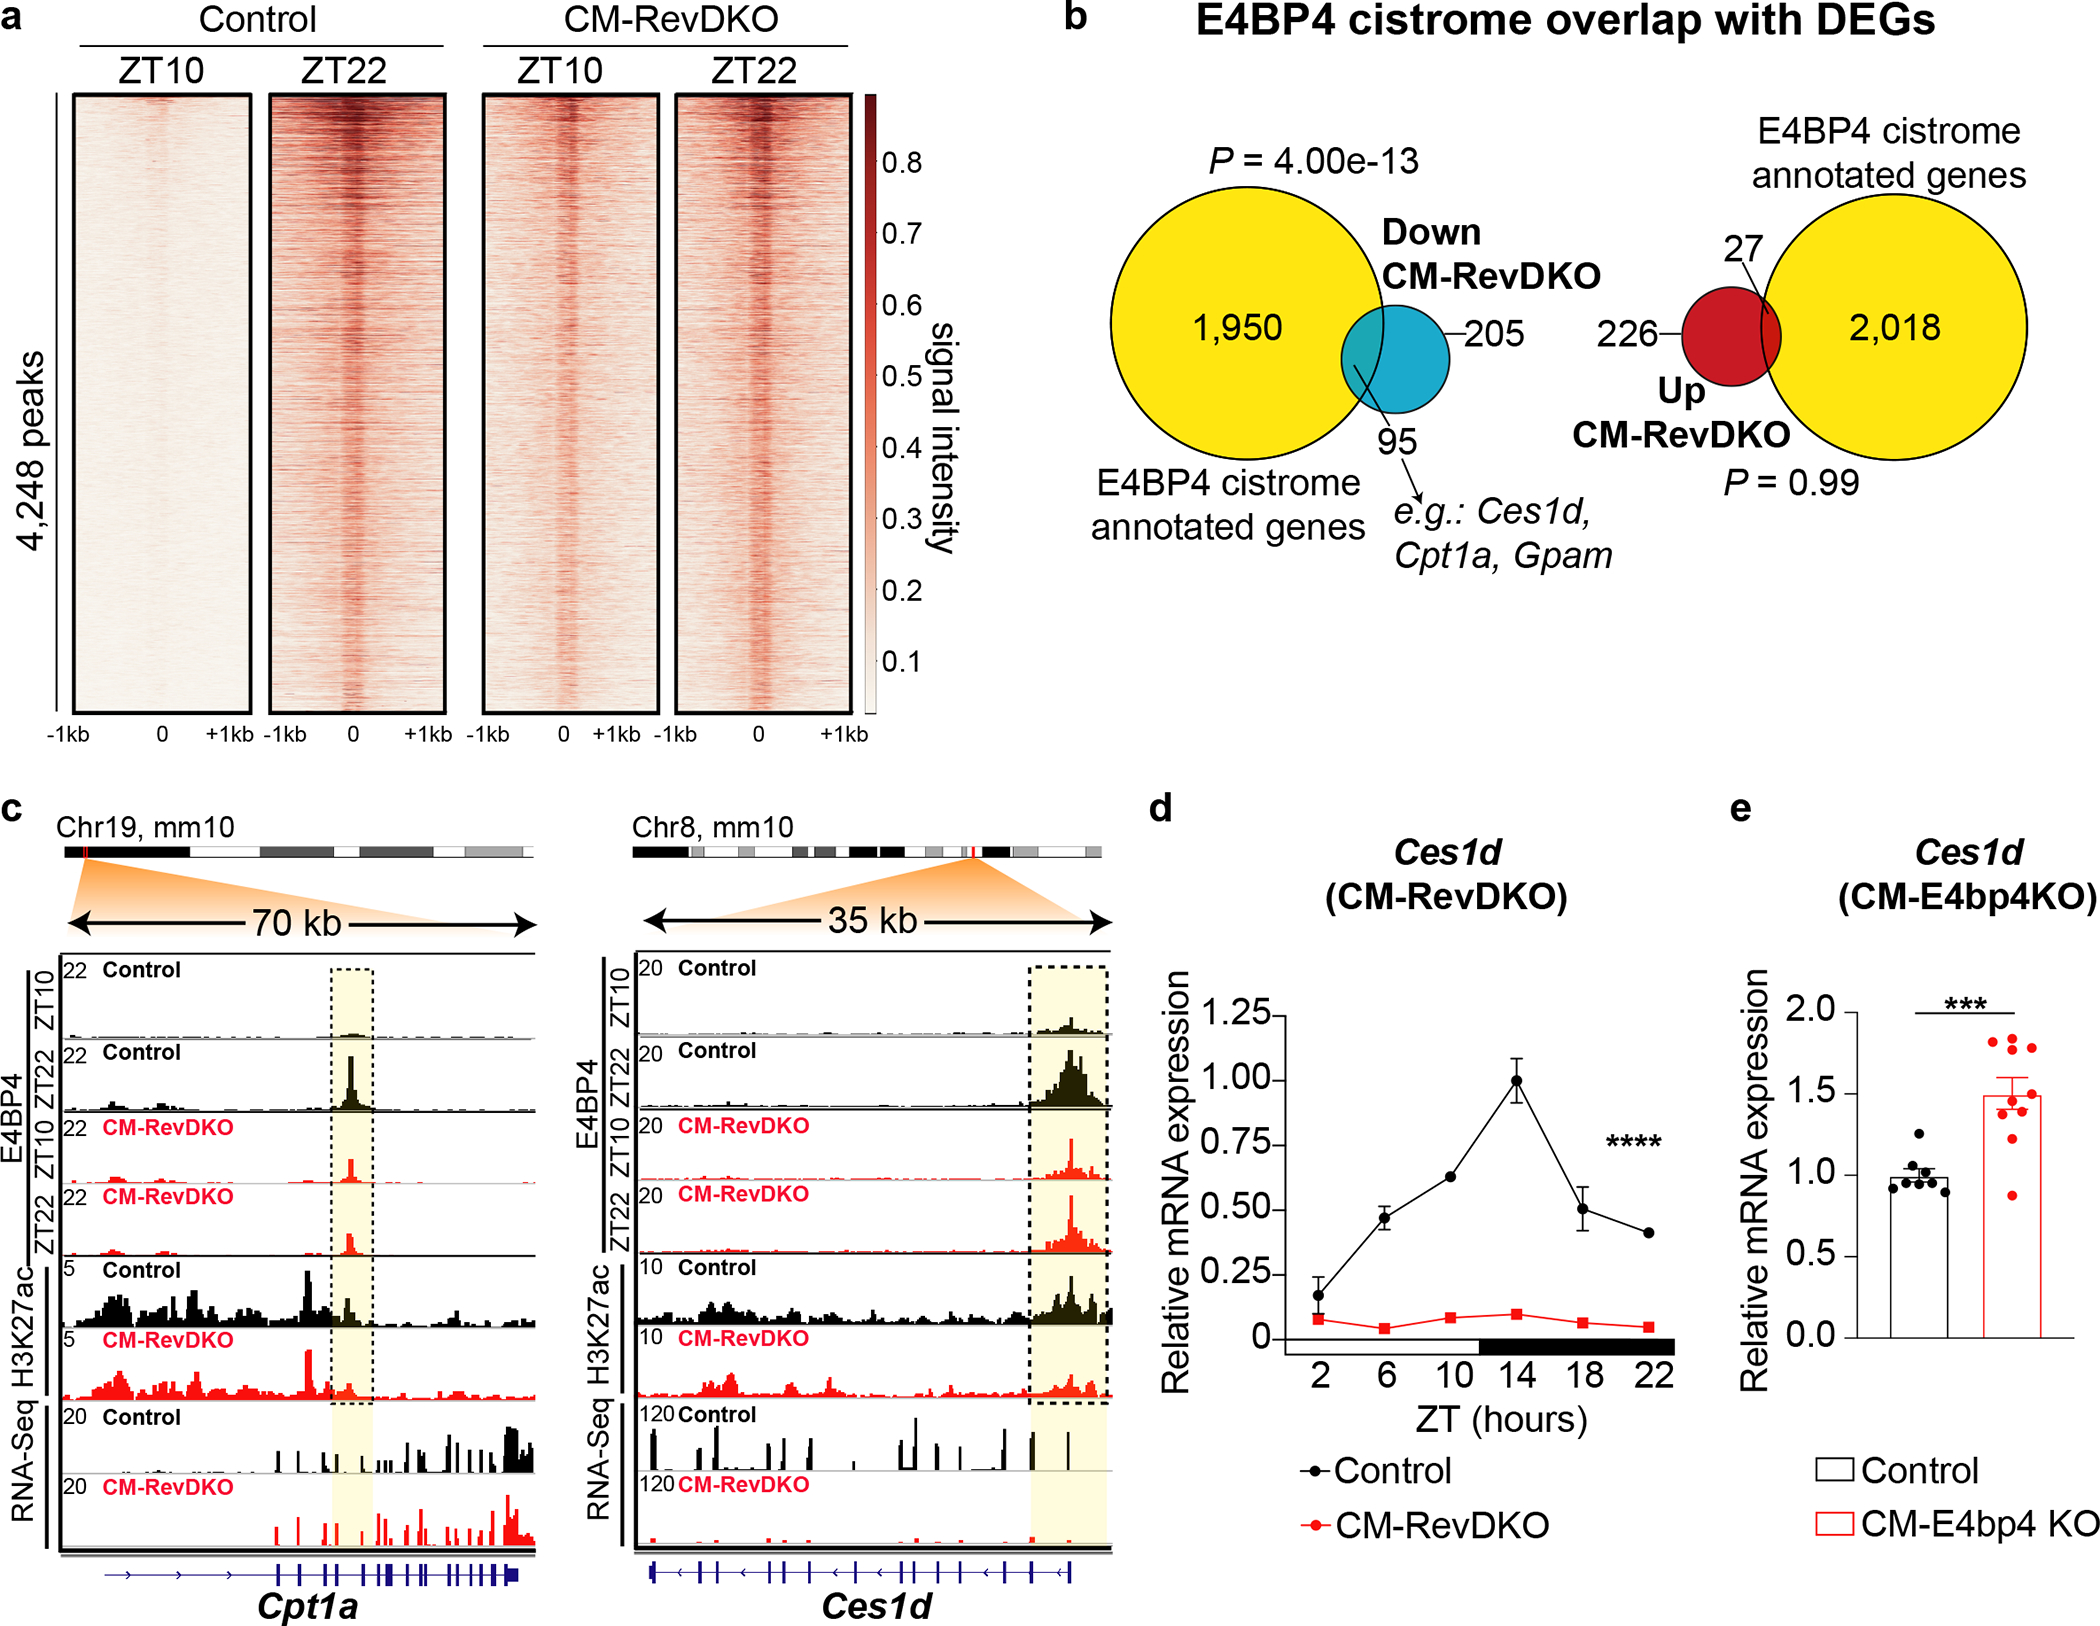
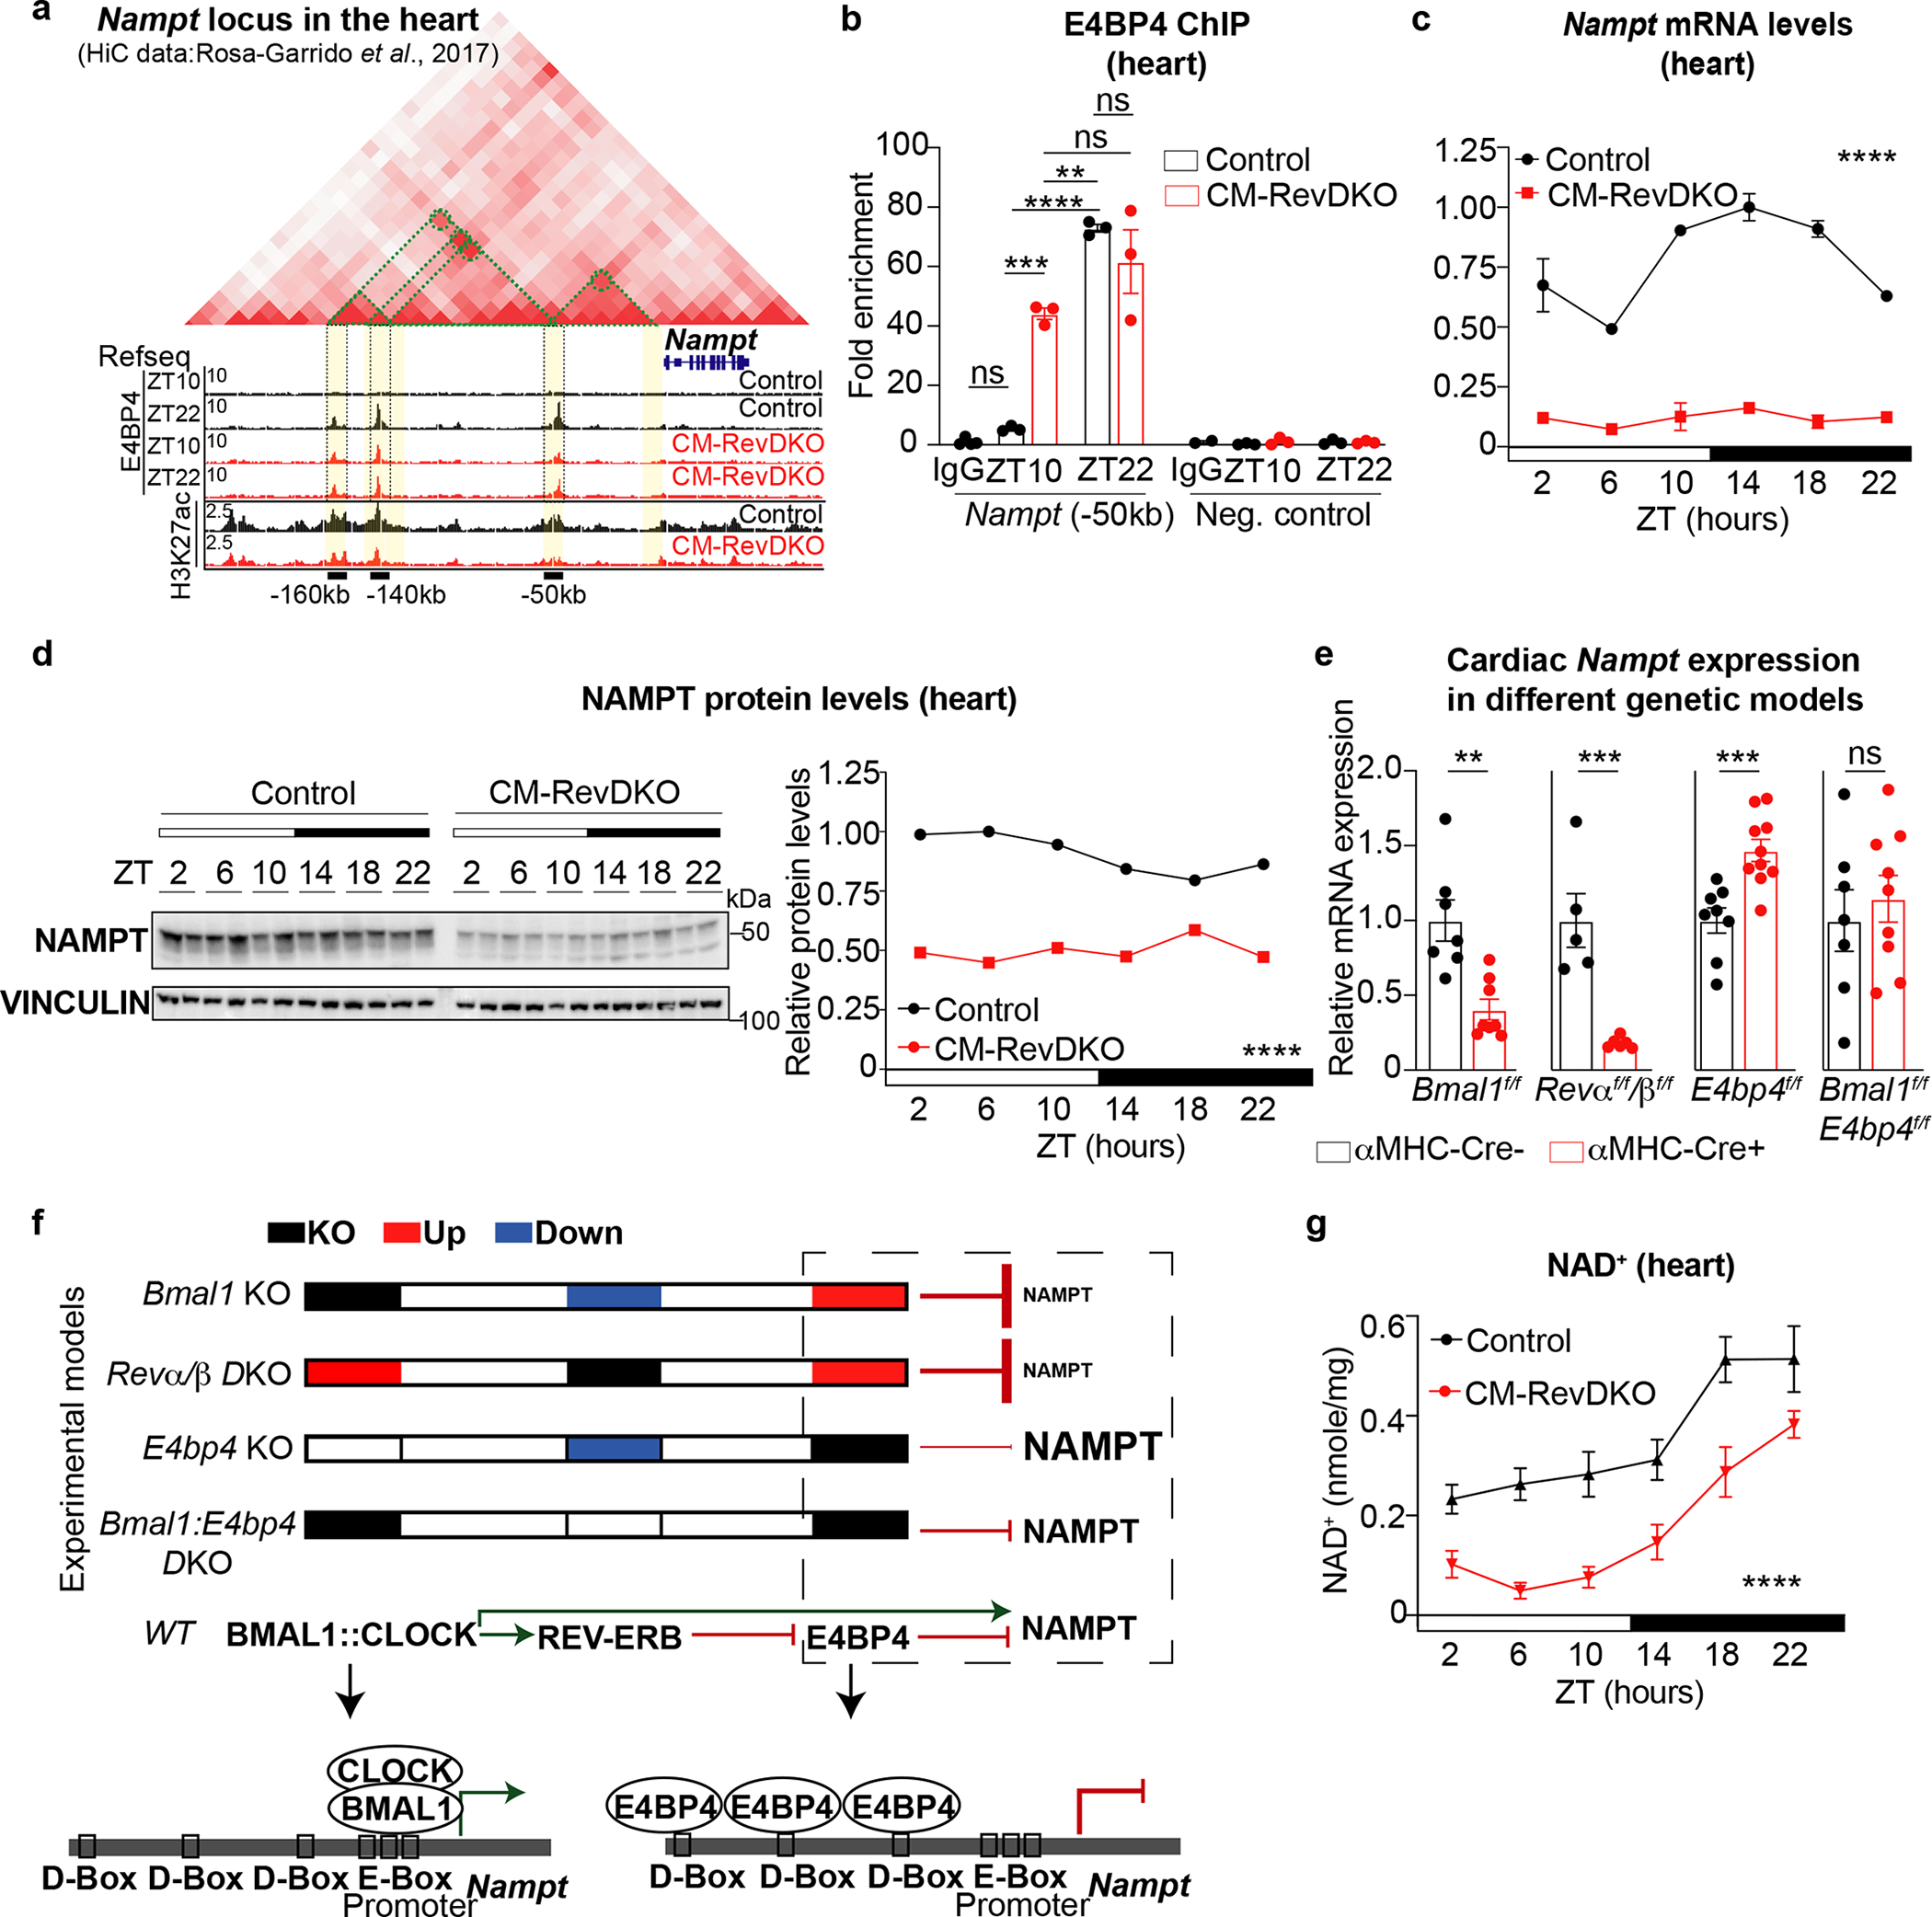
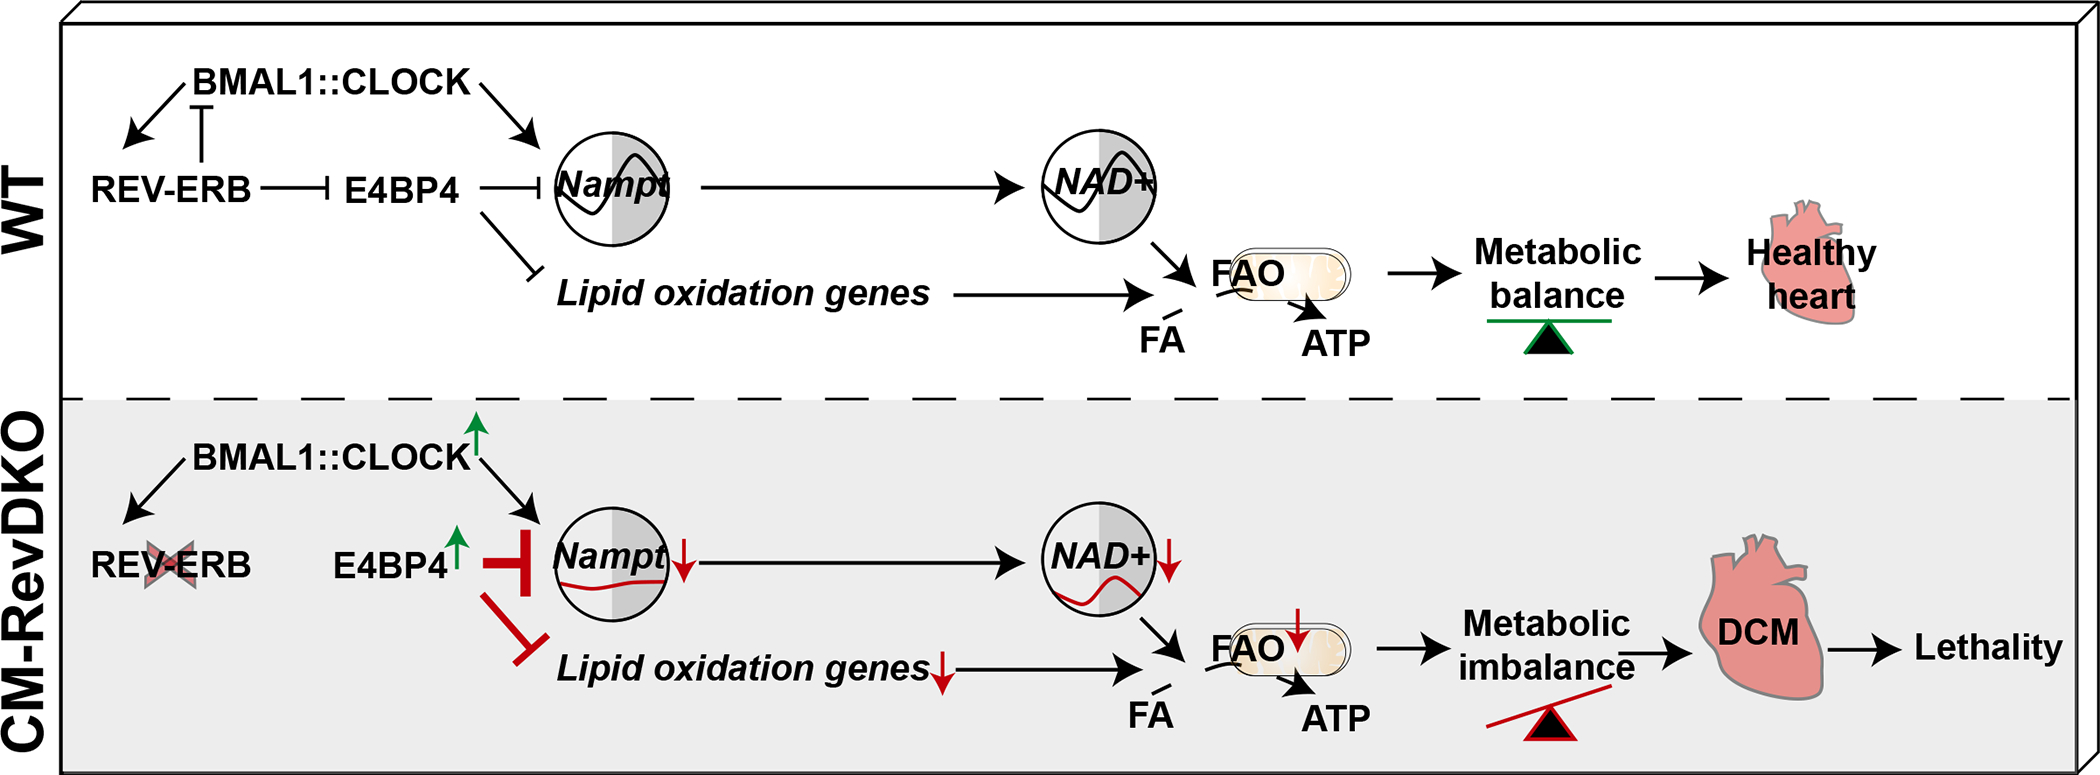
The heart is a highly metabolic organ that uses multiple energy sources to meet its demand for ATP production. Diurnal feeding-fasting cycles result in substrate availability fluctuations which, together with increased energetic demand during the active period, impose a need for rhythmic cardiac metabolism. The nuclear receptors REV-ERBα and β are essential repressive components of the molecular circadian clock and major regulators of metabolism. To investigate their role in the heart, here we generated mice with cardiomyocyte (CM)-specific deletion of both Rev-erbs, which died prematurely due to dilated cardiomyopathy. Loss of Rev-erbs markedly downregulated fatty acid oxidation genes prior to overt pathology, which was mediated by induction of the transcriptional repressor E4BP4, a direct target of cardiac REV-ERBs. E4BP4 directly controls circadian expression of Nampt and its biosynthetic product NAD+ via distal cis-regulatory elements. Thus, REV-ERB-mediated E4BP4 repression is required for Nampt expression and NAD+ production by the salvage pathway. Together, these results highlight the indispensable role of circadian REV-ERBs in cardiac gene expression, metabolic homeostasis and function.


Figures

Extended Data Fig. 1
Extended Data Fig. 1. Additional validation of CM-RevDKO.
a, Immunoblot for BMAL1 with quantification from control (αMHC-Cre-) vs CM-RevDKO (αMHC-Cre+) hearts from 2-month-old male mice (n = 2/timepoint/genotype). b, Relative mRNA expression in control vs CM-RevDKO hearts from 2-month-old male mice (n = 3 hearts/genotype/timepoint except for n = 2 for ZT2 and n = 4 for ZT22 in CM-RevDKO) and c, young and old WT mice (n = 3/genotype). n represents biologically independent replicates. Data are presented as mean ± SEM, except for a. ns: non significant, * P <0.05, ** P <0.01, *** P <0.001, ****P < 0.0001, by 2-way ANOVA (exact P values are provided in the Source Data).
Extended Data Fig. 2
Extended Data Fig. 2. Age-dependent impairment of cardiac structure and function in CM-RevDKO mice.
a, Birth rates for CM-RevDKO and littermate control animals. b, Locomotor activity and c, food consumption of 2-month-old male control (n = 3) and CM-RevDKO (n = 5) mice housed under 12:12 light:dark conditions. d, Body weight (in grams) of male control and CM-RevDKO mice at 2 (n = 17 for control and n = 34 for CM-RevDKO)-4 (n = 8 for control and n = 14 for CM-RevDKO)-6 (n = 8 for control and n = 11 for CM-RevDKO) months of age. e, Blood glucose concentrations of 6-months old male control (n = 6) and CM-RevDKO (n = 11) mice that underwent glucose tolerance test (GTT) and f, insulin tolerance test (ITT) (n=6 for control and n = 10 for CM-RevDKO). g, Biventricular to body weight (BVW/BW) ratios of from control (n = 5) and CM-RevDKO (n = 6) hearts. h, Cardiomyocyte size assesment of 6-month old control and CM-RevDKO hearts. Representative images (cardiac sarcolemma stained by WGA in red, nuclei by DAPI=blue) of 11 control and 9 CM-RevDKO hearts are shown. Scale bars, 50uM. i, Cardiac structure (LVIDd/s: Left ventricular internal diameter during diastole/systole) and function (EF: Ejection fraction and FS: Fractional shortening) data from 2-month-old control and CM-RevDKO mice obtained through echocardiagraphy (n = 4/genotype). j, Echocardiographic parameters from control vs CM-RevDKO mice age 2 months (n=4/genotype) versus 6 months (n = 11 for control and n = 8 for CM-RevDKO). (HR) Heart rate; (LVPWs/d) Left ventricular posterior wall during systole/diastole; (IVSs/d) Interventricular septum thickness during systole/diastole; (RWT) Relative wall thickness. k, Masson’s trichrome and l, TUNEL staining (green) on hearts of 6-month-old control and CM-RevDKO mice. Nuclei are stained with DAPI (blue). Representative images of n = 11 hearts for control and n = 9 hearts for CM-RevDKO are shown. Scale bars, (k) 50μM and (l), 100μM. n represents biologically independent replicates unless otherwise indicated. Data are presented as mean ± SEM. ns: non significant, *P < 0.05, ***P < 0.001, by 2-sided Student’s t test (exact P values are provided in the Source Data).
Extended Data Fig. 3
Extended Data Fig. 3. CM-RevDKO causes tissue specific deregulated expression of circadian genes.
a, Circadian Rev-erbα/β and Bmal1 mRNA expression in 2-month-old male control hearts (n = 5 timepoint, except for ZT7, n = 4 and ZT10, n = 6). b, Left: Venn diagram showing overlap between DEGs in CM-RevDKO hearts and hepatocyte-specific Rev-erb DKO (HepDKO) livers (at ZT10). Right: relative mRNA expression of commonly (in both CM-RevDKO and Hep-RevDKO) deregulated clock genes in CM-RevDKO vs control hearts (n=3 hearts/genotype, harvested at ZT10). c, qRT-PCR validation of genes derepressed upon CM-RevDKO in the heart of 2-month-old male mice (n = 5 for control and n = 6 for CM-RevDKO). d, Left: Venn diagram showing overlap between cardiac oscillators published in and all DEGs in CM-RevDKO that were assessed in. Right: phase plots of rhythmic, differentially expressed genes identified on the left. n represents biologically independent replicates. Data are presented as mean ± SEM. Adj. P values in b were calculated by DESeq2. ***P < 0.001, ****P < 0.0001, by 2-sided Student’s t test (exact P values are provided in the Source Data).
Extended Data Fig. 4
Extended Data Fig. 4. Mitochondrial size is affected in CM-RevDKO cardiomyocytes.
a, Relative Ppp1r1b mRNA expression in CM-RevDKO (n = 6) vs control (n = 5) hearts from 2-month-old male mice. b, Immunoblot for DARPP-32 in CM-RevDKO vs control hearts. c, Scatter plot and histogram of mitochondria area for ventricular CMs in control and CM-RevDKO hearts from 6-month-old male mice based on electron microscopy images (n = 86 mitochondria for control, measured from 5 images, n = 90 mitochondria for CM-RevDKO, measured from 7 images). d, Left: scatter plot of mitochondria area for ventricular CMs in control and CM-RevDKO hearts from 2-month-old mice. Right: Electron micrographs of ventricular tissue from control and CM-RevDKO hearts at 2 months (n = 108 mitochondria for control, measured from 7 images, n=100 mitochondria for CM-RevDKO, measured from 9 images). Scale bars, 1μM. e, Relative levels of mitochondrial DNA quantified by qRT-PCR. mtCo1/2 and mtNd1 levels were normalized to nuclear genomic βActin (n=3/genotype). n represents biologically independent replicates unless otherwise indicated. Data are presented as mean ± SEM. ns: non significant, *P < 0.05, ***P < 0.001, ****P < 0.0001, by 2-sided Student’s t test (exact P values are provided in the Source Data)
Extended Data Fig. 5
Extended Data Fig. 5. Characterization of the 3xHA-REV-ERBα cistrome in the heart.
a, Venn diagram showing the overlap between the downregulated differentially expressed genes (DEGs) in CM-RevDKO hearts and up/downregulated genes in cardiomyocyte-specific glucocorticoid receptor (GR) KO hearts. b, Pearson correlation plots comparing 3xHA ChIP-Seq replicate samples. c, Pie chart of annotated cardiac 3xHA-REV-ERBα ChIP-Seq peaks. d, Results of motif search at 3xHA-REV-ERBα ChIP-Seq peaks and enhancers that displayed increased H3K27ac Cut&Run signal (FC > 2) in CM-RevDKO vs control cardiomyocytes as reported by HOMER. e, Venn diagram showing overlap between DEGs in CM-RevDKO vs control hearts and annotated peaks from the cardiac 3xHA-REV-ERBα cistrome (at ZT10). f, ChIP-Seq, Cut&Run and RNA-Seq read distribution for REV-ERBα and H3K27ac near derepressed REV-ERBα canonical target genes Bmal1 and g, Cry1 and h, output genes p21 and Fbn2. i, Immunoblot and quantification for FLAG and REV-ERBα from DsRed (control) vs FLAG-Rev-erbα overexpressing plasmid transfected C2C12 cells (n = 2 independently transfected wells/condition). Significance of overlap in d is calculated via a hypergeometric test without multiple testing correction.
Extended Data Fig. 6
Extended Data Fig. 6. E4BP4-based repression is a unifying mechanism to explain transcriptional changes and cardiomyopathy common to the cardiac-specific loss of BMAL1 or REV-ERBs.
a, Results of motif search at cardiac E4BP4 ChIP-Seq peaks (Control at ZT22) as reported by HOMER. b, Pie chart of annotated cardiac E4BP4 ChIP-Seq peaks (control ZT22). c, Venn diagram showing overlap between annotated peaks from the cardiac control (at ZT22) and CM-RevDKO (at ZT10 and ZT22) E4BP4 cistromes. d, ChIP-Seq, Cut&Run and RNA-Seq read distribution for E4BP4 and H3K27ac near identified E4BP4 target genes in control and CM-RevDKO hearts. e, Overlap between upregulated and g, downregulated genes in CM-RevDKO hearts and cardiomyocyte-specific Bmal1 KO (CBK) hearts. Proposed models for normal (Norm) and experimental (Exp.) conditions are depicted on the right. f, Overlap between commonly upregulated and h, downregulated genes in CBK/CM-RevDKO hearts (identified in e and g respectively) and cardiac REV-ERBα/E4BP4 cistromes. CBK data in (e,f,g,h) was obtained from.
Extended Data Fig. 7
Extended Data Fig. 7. Deletion of Rev-erbs in cardiomyocytes derepresses key metabolic regulators leading to mitochondrial abnormalities and loss of normal heart function.
a, Relative Pgc-1α/β, Naprt1 and Nampt mRNA levels in CM-RevDKO and control hearts (n=3/genotype) from 2-month-old male mice. b, Relative Bmal1, Rev-erbα/β, and E4bp4 mRNA levels in CBK (n = 7 for control and n = 8 for KO), CM-RevDKO (n = 5 for control and n n = 6 for KO), E4bp4 (n = 8 for control and n = 10 for KO) and CBK/E4bp4 (double) KO (n = 6 for control and n = 9 for DKO) and control hearts from 2-month-old male mice for CM-RevDKO and control at ZT10 and from 3-month-old male mice for the rest at ZT12. c, Representative immunoblots and relative protein quantification for NAMPT in hearts from 3-month-old male mice with the following genetic background: CBK (n = 6/genotype), E4bp4 (n = 7/genotype), and CBK/E4bp4 (double) KO (n = 6/genotype), harvested at ZT12. n represents biologically independent replicates. All data are presented as mean ± SEM. Adj. P values in a were calculated by DESeq2, while ns: non significant, *P < 0.05, **P < 0.01,***P < 0.001,****P < 0.0001 by 2-sided Student’s t test in b and one-way ANOVA followed by a Tukey’s multiple comparisons test in c (exact P values are provided in the Source Data).
Fig. 1.
Fig. 1.. CM-RevDKO mice die from dilated cardiomyopathy.
a, Cartoon depicting strategy for cardiomyocyte-specific Rev-erbα/β double knock out model (CM-RevDKO) generation by crossing cardiomyocyte-specific Cre-deleter line (αMHC-Cre) with a recently developed Rev-erbαffff mouse model. b, Relative mRNA expression in hearts from 2-month-old male αMHC-Cre+ Rev-erbα/β double floxed (CM-RevDKO) vs littermate controls (αMHC-Cre-) (n = 3 hearts/genotype/timepoint except for n = 2 for ZT6 and ZT22 in control, ZT2 and ZT18 in CM-RevDKO, and n = 4 for ZT22 in CM-RevDKO). c, Immunoblot for REV-ERBα from control (αMHC-Cre-) vs CM-RevDKO (αMHC-Cre+) hearts from 2-month-old male mice (n = 2/timepoint/genotype). d, Relative REV-ERBα/β target gene mRNA expression in control vs CM-RevDKO hearts from 2-month-old male mice (n = 3 hearts/genotype/timepoint except for n = 2 for ZT6 and ZT22 in control, ZT2 and ZT18 in CM-RevDKO, and n = 4 for ZT22 in CM-RevDKO). e, Kaplan-Meier survival curves for control (αβfl/fl fl/fl) and CM-RevDKO male and female mice. f, Gross pictures of hearts at the age of 6 months and biventricular to body weight (BVW/BW) ratios (n=5 hearts/genotype for male, n=6 for control and n = 4 for CM-RevDKO female mice) g, Representative short axis M-mode images from echocardiography on 6-month-old female mice and h, Cardiac structure (LVIDd/s: Left ventricular internal diameter in diastole/systole) and function (EF: Ejection fraction and FS: Fractional shortening) data from echocardiagraphy (n = 11 for control and 8 for CM-RevDKO) for 6-month-old mice. i, Masson’s trichrome staining on 6-month-old female control and CM-RevDKO hearts. Scale bars, 2um. n represents biologically independent replicates. Data are presented as mean ± SEM. ns: non significant, *P < 0.05, ****P < 0.0001, by 2-sided Student’s t test, except for Chi-square (log rank Mantel-Cox) test in e (exact P values are provided in the Source Data).
Fig. 2.
Fig. 2.. REV-ERBs control metabolic gene expression in the heart.
a, Scatter plot showing 553 differentially expressed genes (DEGs) in CM-RevDKO vs control hearts (n = 3/genotype, cut-off: FC > 1.5-fold up (red) and down (blue), Adj. P (FDR) < 0.05). b, KEGG pathway and gene ontology analysis on all DEGs from (a). The analysis was performed via the use of https://www.gsea-msigdb.org/gsea/index.jsp. c, Schematic showing metabolic pathways with significantly upregulated (red) and downregulated (blue) genes in CM-RevDKO, determined in (a,b). d, Electron micrographs of ventricular tissue from control and CM-RevDKO hearts at 6 months. Open arrow heads denote normal looking mitochondria with dense cristae. Black arrows denote abberrant mitochondria with abnormal cristae. Scale bars, 1μM. e, Traces for oxidative phosphorylation (oxygen consumption rate (OCR)) from Seahorse measurements in a mitochondrial stress test on Rev-erbα/βfl/fl fl/fl neonatal CMs, transduced with Adeno-RFP (control) vs Adeno-Cre (RevDKO). Palmitate-BSA was added to the CMs right before the assay (n = 11 independently transduced wells for control and n = 12 for RevDKO). (Oligo) Oligomycin; (FCCP) Carbonyl cyanide-4 (trifluoromethoxy) phenylhydrazone; (AM) Antimycin; (Rot) Rotenone. n represents biologically independent replicates unless otherwise indicated. Data are shown as mean ± SEM. *P < 0.05 by 2-sided Student’s t test (exact P values are provided in the Source Data).
Fig. 3.
Fig. 3.. Enhancers of downregulated genes are enriched for E4BP4, a direct REV-ERB target that is induced in CM-RevDKO hearts.
a, Scaled H3K27ac Cut&Run enrichment for cardiomyocytes isolated from control and CM-RevDKO adult hearts. 257 and 152 peaks were increased (FC > 2) and decreased respectively in CM-RevDKO cardiomyocytes (compared to control). Plots depict identified H3K27ac peaks + and −1000 base pairs. b, Transcription factor binding similarity screening on H3K27ac in/decreased sites in CM-RevDKO cardiomyocytes from a using all published cistromes from heart, muscle and liver deposited in CistromeDB. c, Relative mRNA expression levels for all cardiac expressed putative transcription factors regulating decreased H3K27ac signal from b in hearts from 2-month-old male control vs CM-RevDKO mice (n = 3/genotype). d, Relative mRNA expression in control vs CM-RevDKO hearts from 2-month-old male mice (n=3 hearts/genotype/timepoint except for n = 2 for ZT6 and ZT22 in control, ZT2 and ZT18 in CM-RevDKO, and n = 4 for ZT22 in CM-RevDKO). e, Immunoblot and quantification for E4BP4 from control vs CM-RevDKO hearts (n=2/timepoint/genotype). f, Heat map showing 3xHA ChIP-Seq tag densities (at ZT10) in WT and 3xHA-REV-ERBα hearts at 1,486 REV-ERBα peaks. g, ChIP-Seq, Cut&Run and RNA-Seq read distribution for REV-ERBα and H3K27ac near derepressed REV-ERB target gene E4bp4 upon CM-RevDKO. h, Relative mRNA expression in Rev-erbα/βfl/fl fl/fl neonatal CMs, transduced with Adeno-RFP (control), Adeno-Cre (RevDKO) and increasing concentrations (1:100,000, 1:10,000, 1:5,000 and 1:1,000) of Adeno-RFP-Rev-erbα (RevOE, stock= 3.5×10^10 IFU/ml) (n = 5 independently transduced cell samples/condition). i, Rev-erbα overexpression induces repression of E4bp4 promoter activity in C2C12 cells. The schematic diagram indicates a putative REV-ERB response element (REV-RE) within an 835bp E4bp4 promoter proximal region fragment, where numbers indicate distance from the transcriptional start site of E4bp4. Cells were transfected with E4bp4-luc, E4bp4-luc Mut (4bp mutated in the REV-RE) or E4bp4-luc Del (6bp deleted in the REV-RE) together with TK-Renilla-luc and CMV-DsRed (control) vs CMV-Rev-erbα. Reporter luciferase activity was normalized to Renilla-luc signal and plotted values are relative to promoterless (empty) pGL4.21 vector signal (n = 6 independently transfected cell samples/condition, except for n = 3 for empty pGL4.21 vector transfected samples). n represents biologically independent replicates unless otherwise indicated. Data are presented as mean ± SEM, except for e. Adj. P was calculated by DESeq2 for c. ****P < 0.0001 by 2-way ANOVA for d and e, and ***P < 0.001, ****P < 0.0001, ns: non significant by 2-sided Student’s t test (RevDKO vs Control) and ***P < 0.001, ****P < 0.0001 by one-way ANOVA for gradient of RevOE in h and i (exact P values are provided in the Source Data).
Fig. 4.
Fig. 4.. Constitutive binding of E4BP4 contributes to downregulated gene expression in CM-RevDKO hearts.
a, Heat map showing E4BP4 ChIP-Seq tag densities (at ZT10 vs ZT22) in control and CM-RevDKO hearts, at 4,248 high-confidence E4BP4 peaks. b, Venn diagram showing overlap between differentially expressed genes (DEGs) in CM-RevDKO vs control hearts and annotated peaks from the control cardiac E4BP4 cistrome (at ZT22). c, ChIP-Seq, Cut&Run and RNA-Seq read distribution for E4BP4 and H3K27ac near identified E4BP4 target genes in control and CM-RevDKO hearts. d, Relative E4BP4-target mRNA expression in control vs CM-RevDKO hearts from 2-month-old male mice (n = 3 hearts/genotype/timepoint, except for n = 2 at ZT2 n = 4 at ZT18 for CM-RevDKO), and e, CM-E4bp4 KO hearts from 3-month-old male mice (at ZT12) (n = 8 for control and n = 10 for CM-E4bp4 KO). n represents biologically independent replicates. Data are presented as mean ± SEM. ****P < 0.0001, by 2-way ANOVA in d and ***P < 0.001, by 2-sided Student’s t test in e. Significance of overlap in b is calculated via a hypergeometric test (exact P values are provided in the Source Data).
Fig. 5.
Fig. 5.. REV-ERBs control cardiac NAD+ biosynthesis via E4BP4-mediated repression of Nampt.
a, Hi-C from the heart (obtained from), H3K27ac Cut&Run data from isolated adult control and CM-RevDKO hearts (at ZT10) and E4BP4 ChIP-Seq data (at ZT10 and ZT22) from control and CM-RevDKO hearts. Green dotted lines delineate 3D contacts. Identified cis-regulatory elementals (CREs) are highlighted in yellow, 3 of them were found to be bound by E4BP4, marked by black bars and their respective distance to the TSS of Nampt. Data were visualized via Juicebox. b, E4BP4 ChIP-qPCR at the CRE, identified in (a), 50kb upstream of the Nampt TSS (at ZT10 and ZT22) from control and CM-RevDKO hearts. A random locus in the genome was chosen as negative control. (n = 3/condition/genotype). c, Relative Nampt mRNA expression in control vs CM-RevDKO hearts from 2-month-old male mice (n = 3 hearts/genotype/timepoint except for n = 2 for ZT6/ZT10 and ZT22 in control, ZT2 and ZT18 in CM-RevDKO, and n = 4 for ZT22 in CM-RevDKO). d, Immunoblot and protein quantification for NAMPT from control vs CM-RevDKO hearts from 2-month-old male mice (n=2/timepoint/genotype). e, Relative Nampt mRNA expression in hearts from multiple genetic cardiomyocyte-specific (CM) KO models: CBK (n = 7 for control and n = 8 for KO), CM-RevDKO (n = 5 for control and n = 6 for KO), E4bp4 (n = 8 for control and n = 10 for KO) and CBK/E4bp4 (double) KO (n = 6 for control and n = 9 for DKO) and control hearts from 2-month-old male mice for CM-RevDKO and control at ZT10 and from 3-month-old male mice for the rest at ZT12. f, cartoon of summarized experimental data and proposed mechanism of transcriptional regulation of Nampt in different genetic KO models. g, NAD+ levels from control vs CM-RevDKO hearts from 2-month-old mice (n = 6 hearts/timepoint except for n = 5 for ZT6 in control, n = 5 except for n = 4 for ZT6, n = 6 for ZT18 and n = 7 for ZT22 in CM-RevDKO). n represents biologically independent replicates. All data are presented as mean ± SEM, except for d. ns: non significant, **P < 0.01,***P < 0.001,****P < 0.0001 by two-way ANOVA (in c,d,g), one-way ANOVA followed by a Tukey’s multiple comparisons test (in b), and by 2-sided Student’s t test in e (exact P values are provided in the Source Data).
Fig. 6.
Fig. 6.. Scheme of metabolic deregulation in hearts of CM-RevDKO mice.

References

    1. Kummitha CM, Kalhan SC, Saidel GM & Lai N Relating tissue/organ energy expenditure to metabolic fluxes in mouse and human: experimental data integrated with mathematical modeling. Physiol Rep 2, e12159 (2014). - PMC - PubMed
    1. Cederroth CR et al. Medicine in the Fourth Dimension. Cell Metab. 30, 238–250 (2019). - PMC - PubMed
    1. Dierickx P, van Laake LW & Geijsen N Circadian clocks: from stem cells to tissue homeostasis and regeneration. EMBO Rep. 19, 18–28 (2017). - PMC - PubMed
    1. Dierickx P et al. in Stem Cells and Cardiac Regeneration 57–78 (Springer International Publishing, 2015). doi:10.1007/978-3-319-25427-2_5 - DOI
    1. Crnko S, Pré, Du BC, Sluijter JPG & van Laake LW Circadian rhythms and the molecular clock in cardiovascular biology and disease. Nat Rev Cardiol 16, 437–447 (2019). - PubMed

Publication types

MeSH terms

Substances