. 2022 Mar;9(7):e2104112.
doi: 10.1002/advs.202104112. Epub 2022 Jan 17.

Single-Nucleus RNA Sequencing Reveals that Decorin Expression in the Amygdala Regulates Perineuronal Nets Expression and Fear Conditioning Response after Traumatic Brain Injury

Affiliations

Single-Nucleus RNA Sequencing Reveals that Decorin Expression in the Amygdala Regulates Perineuronal Nets Expression and Fear Conditioning Response after Traumatic Brain Injury

Yingwu Shi et al. Adv Sci (Weinh). 2022 Mar.

Abstract

Traumatic brain injury (TBI) is a risk factor for posttraumatic stress disorder (PTSD). Augmented fear is a defining characteristic of PTSD, and the amygdala is considered the main brain region to process fear. The mechanism by which the amygdala is involved in fear conditioning after TBI is still unclear. Using single-nucleus RNA sequencing (snRNA-seq), transcriptional changes in cells in the amygdala after TBI are investigated. In total, 72 328 nuclei are obtained from the sham and TBI groups. 7 cell types, and analysis of differentially expressed genes (DEGs) reveals widespread transcriptional changes in each cell type after TBI are identified. In in vivo experiments, it is demonstrated that Decorin (Dcn) expression in the excitatory neurons of the amygdala significantly increased after TBI, and Dcn knockout in the amygdala mitigates TBI-associated fear conditioning. Of note, this effect is caused by a Dcn-mediated decrease in the expression of perineuronal nets (PNNs), which affect the glutamate-γ-aminobutyric acid balance in the amygdala. Finally, the results suggest that Dcn functions by interacting with collagen VI α3 (Col6a3). Consequently, the findings reveal transcriptional changes in different cell types of the amygdala after TBI and provide direct evidence that Dcn relieves fear conditioning by regulating PNNs.

Keywords: amygdala; decorin; fear conditioning; perineuronal nets; traumatic brain injury.


Conflict of interest statement

The authors declare no conflict of interest.

Figures

Figure 1
Figure 1
Classification of cell types in the mouse amygdala based on snRNA‐seq data. A) Photomicrographs showing dissection of the BLA and CeA subregions of the amygdala. B) t‐SNE plot showing the different cell types in the amygdala based on transcriptome data. C) t‐SNE plot showing sample types from the sham and TBI groups. D) Expression of marker genes (highlighted with green color) in the cell types on the t‐SNE plot. E) Violin plot showing cell type‐specific gene marker expression in the different cell clusters.
Figure 2
Figure 2
The amygdala contains distinct neuron subtypes. A) t‐SNE plot showing that neurons in the amygdala can be further divided into 14 clusters. B) Violin plot showing the expression of marker genes in the 14 clusters. C) Results of RNA ISH analysis of marker genes in the amygdala. D) Expression of Gad1 and Slc17a7 (highlighted by green color) on the t‐SNE plots. E) The neurons are divided into 4 subtypes on the t‐SNE plots according to the location of marker gene expression (the BLA, CeA, or total) and neuronal properties (inhibitory or excitatory).
Figure 3
Figure 3
Broad transcriptional differences in each amygdala cell type between the sham and TBI groups. A) Numbers of up‐ and downregulated genes in the different cell types. B) Heatmap showing representative enriched functional pathways based on the DEGs of the different cell types. C) Expression of Dcn (highlighted by green color) in all cells and the neuron subtypes on the t‐SNE plots. D) The results of RNA ISH analysis showing the expression of Dcn mainly in the BLA.
Figure 4
Figure 4
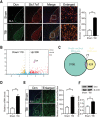
Validation that Dcn expression is upregulated in the BLA after TBI. A) Representative FISH micrographs showing that Dcn expression in the BLA was upregulated in the TBI group compared to the sham group. Scale bar, 100 µm; enlarged: scale bar 100 µm. Data are presented as the mean ± SEM, n = 3, **p < 0.01 (t‐test). B) Volcano plot showing that Dcn is one of the upregulated DEGs in the TBI group compared to the sham group identified by bulk RNA‐seq. C) Venn diagram showing that more DEGs were captured by single nucleus RNA‐seq than by bulk RNA‐seq. D) RT‐qPCR results showing that Dcn expression was upregulated after TBI. Data are presented as the mean ± SEM, n = 3, **p<0.01 (t‐test). E) Immunofluorescence analysis showing the number of Dcn+ neurons in the BLA in sham and TBI group. Scale bar, 100 µm. Data are presented as the mean ± SEM, n = 3, **p<0.01 (t‐test). F) Western blotting results showing the increase in Dcn at the protein level after TBI in the BLA. Data are presented as the mean ± SEM, n = 3, **p<0.01 (t‐test).
Figure 5
Figure 5
Dcn knockout increased the expression of PNNs and attenuated TBI‐induced fear conditioning. A) Timeline of the experimental design. Before CCI, AAV was injected into the BLA of Dcnflox/flox mice to knock out Dcn, and the mice were then used for subsequent experiments. B) Quantification of Dcn mRNA levels in animals injected with cre AAV or control AAV. Data are presented as the mean ± SEM, n = 3, **p<0.01 (t‐test). C) Contextual and cued fear conditioning analyses of the 5 groups. Data are presented as the mean ± SEM, n = 6, **p<0.01 (one‐way ANOVA with Bonferroni's post hoc test). D) Representative stained images showing PNNs expression in the BLA of the 5 groups. Scale bar, 100 µm. Data are presented as the mean ± SEM, n = 6, **p<0.01 (one‐way ANOVA with Bonferroni's post hoc test). E) The numbers of PNNs+CaMK II+ neurons in the BLA in the different groups. Scale bar, 10 µm. Data are presented as the mean ± SEM, n = 6, **p<0.01 (one‐way ANOVA with Bonferroni's post hoc test). F) The numbers of PNNs+Gad67+ neurons in the BLA in the different groups. Scale bar, 10 µm. Data are presented as the mean ± SEM, n = 6, **p<0.01 (one‐way ANOVA with Bonferroni's post hoc test).
Figure 6
Figure 6
Dcn knockout maintained the glutamate‐GABA balance in the BLA after TBI. A,C) Western blotting results showing the expression levels of NR1 and Gad67 in BLA tissue. Data are presented as the mean ± SEM, n = 6, **p<0.01, *p<0.05 (one‐way ANOVA with Bonferroni's post hoc test). B) TEM image of excitatory neuron and inhibitory neuron synapses in the BLA in the different groups. Scale bar, 100 nm. D) The depths and lengths of postsynaptic densities in the glutamatergic neurons. Data are presented as the mean ± SEM, n = 50 synapses from 10 mice, **p<0.01 (one‐way ANOVA with Bonferroni's post hoc test). E) The depths and lengths of postsynaptic densities in the GABA neurons. Data are presented as the mean ± SEM, n = 50 synapses from 10 mice, **p<0.01 (one‐way ANOVA with Bonferroni's post hoc test).
Figure 7
Figure 7
The Col6a3 protein binds Dcn. A) IP samples were run on SDS‐PAGE gels and then stained with Coomassie Brilliant Blue. B) Results of co‐IP analysis confirming the interaction between Dcn and Col6a3. C) IF micrographs showing the colocalization of Dcn and Col6a3 in the mouse BLA. Scale bar, 10 µm. D) Western blotting analysis of the expression of Dcn and Col6a3 in the mouse BLA of the TBI and Dcn‐knockout groups. Data are presented as the mean ± SEM, n = 6, **p<0.01 (one‐way ANOVA with Bonferroni's post hoc test). E) Graphical abstract for the study.

References

    1. Rohling M. L., Binder L. M., Demakis G. J., Larrabee G. J., Ploetz D. M., Langhinrichsen‐Rohling J., Clin. Neuropsychol. 2011, 25, 608. - PubMed
    1. Stein M. B., Jain S., Giacino J. T., Levin H., Dikmen S., Nelson L. D., Vassar M. J., Okonkwo D. O., Diaz‐Arrastia R., Robertson C. S., Mukherjee P., McCrea M., Mac Donald C. L., Yue J. K., Yuh E., Sun X., Campbell‐Sills L., Temkin N., Manley G. T., Investigators T.‐T., Adeoye O., Badjatia N., Boase K., Bodien Y., Bullock M. R., Chesnut R., Corrigan J. D., Crawford K., Diaz‐Arrastia R., Dikmen S., et al., JAMA Psychiatry 2019, 76, 249. - PMC - PubMed
    1. Sah P., Neuron 2017, 96, 1. - PubMed
    1. Lepage C., Muehlmann M., Tripodis Y., Hufschmidt J., Stamm J., Green K., Wrobel P., Schultz V., Weir I., Alosco M. L., Baugh C. M., Fritts N. G., Martin B. M., Chaisson C., Coleman M. J., Lin A. P., Pasternak O., Makris N., Stern R. A., Shenton M. E., Koerte I. K., Brain Imaging Behav. 2019, 13, 725. - PMC - PubMed
    1. Sydnor V. J., Bouix S., Pasternak O., Hartl E., Levin‐Gleba L., Reid B., Tripodis Y., Guenette J. P., Kaufmann D., Makris N., Fortier C., Salat D. H., Rathi Y., Milberg W. P., McGlinchey R. E., Shenton M. E., Koerte I. K., Neuroimage Clin. 2020, 26, 102190. - PMC - PubMed

Publication types