. 2022 Feb 3;39(2):msac013.
doi: 10.1093/molbev/msac013.

The Emergence of SARS-CoV-2 Variants of Concern Is Driven by Acceleration of the Substitution Rate

Affiliations

The Emergence of SARS-CoV-2 Variants of Concern Is Driven by Acceleration of the Substitution Rate

John H Tay et al. Mol Biol Evol. .

Abstract

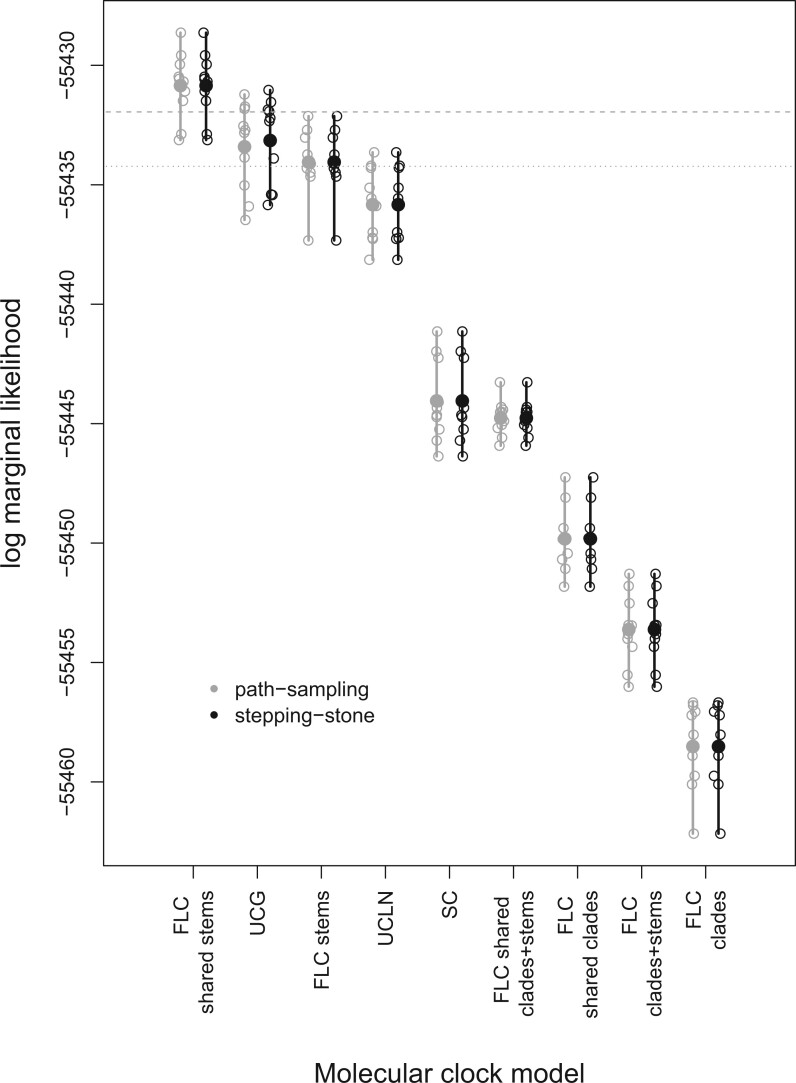
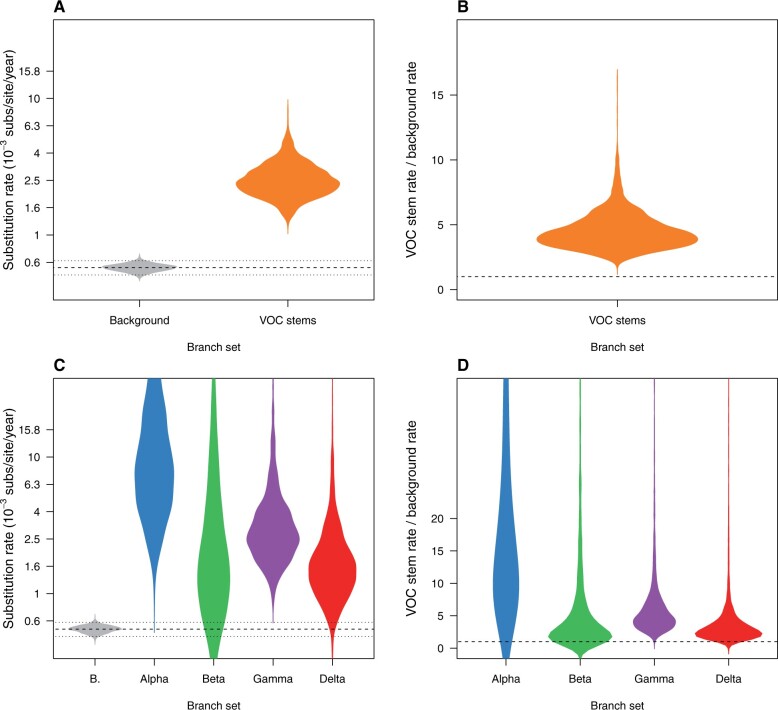
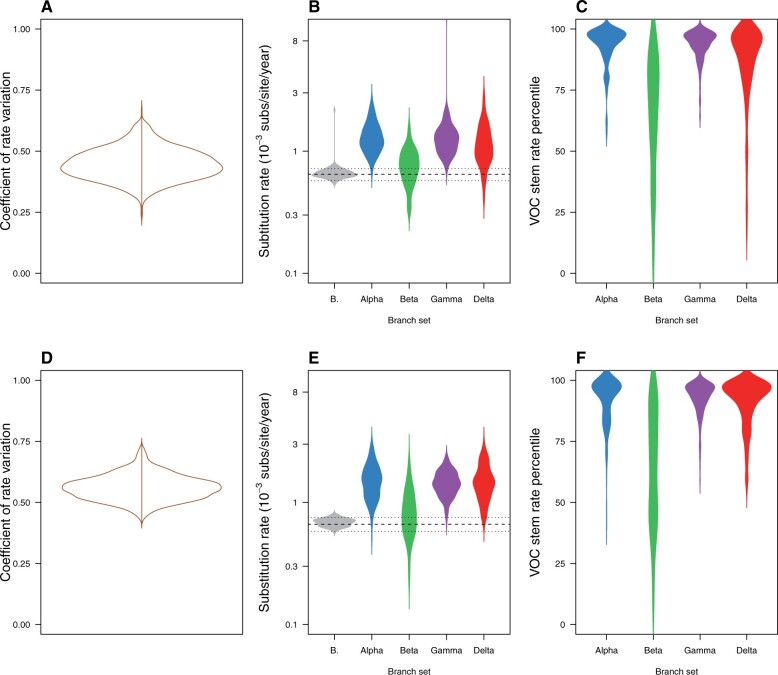
The ongoing SARS-CoV-2 pandemic has seen an unprecedented amount of rapidly generated genome data. These data have revealed the emergence of lineages with mutations associated to transmissibility and antigenicity, known as variants of concern (VOCs). A striking aspect of VOCs is that many of them involve an unusually large number of defining mutations. Current phylogenetic estimates of the substitution rate of SARS-CoV-2 suggest that its genome accrues around two mutations per month. However, VOCs can have 15 or more defining mutations and it is hypothesized that they emerged over the course of a few months, implying that they must have evolved faster for a period of time. We analyzed genome sequence data from the GISAID database to assess whether the emergence of VOCs can be attributed to changes in the substitution rate of the virus and whether this pattern can be detected at a phylogenetic level using genome data. We fit a range of molecular clock models and assessed their statistical performance. Our analyses indicate that the emergence of VOCs is driven by an episodic increase in the substitution rate of around 4-fold the background phylogenetic rate estimate that may have lasted several weeks or months. These results underscore the importance of monitoring the molecular evolution of the virus as a means of understanding the circumstances under which VOCs may emerge.

Keywords: Bayesian model selection; SARS-CoV-2 molecular evolution; molecular clock; variants of concern.


Figures

Fig. 1.
Fig. 1.
Calculations of log marginal likelihoods for all molecular clock models using path sampling and stepping-stone. The hollow circles represent individual estimates, with ten replicates per model, and solid circles denote the mean value over replicates. The vertical lines represent the range of values in each case. The horizontal dashed line corresponds to a log BF of 1.1 (“substantial evidence”) relative to the mean log marginal likelihood of the best model (FLC shared stems), whereas the dotted line is the same value relative to the lowest log marginal likelihood of the best model.
Fig. 2.
Fig. 2.
Violin plots for posterior statistics of FLC. (A) is for a model where the stem branches of VOCs share a substitution rate that is different to that of the background (model “FLC shared stems” in supplementary table S1 and fig. S1, Supplementary Material online). The substitution rate for VOCs stem branches is shown in orange and the background in gray. The dashed line represents the mean background rate and the dotted lines are the 95% credible interval. (B) is the ratio of the substitution rate for VOC stem branches and the background under the same model and the dashed line represents a value of 1.0 where the background and VOC stem rate would be the same. (C) and (D) show the corresponding statistics for the FLC stems model, where the stem branch of every VOC has a different rate. Abbreviation “B” stands for background.
Fig. 3.
Fig. 3.
Violin plots of posterior statistics for the uncorrelated relaxed clocks with lognormal (UCLN) and gamma (UCG) distributions (see Supplementary Material online). The top row, (A) through (C), is for the UCLN and the bottom row, (D) through (F), is for the UCG. (A) and (D) show the coefficient of rate variation, which is the standard deviation of branch rates divided by the mean rate, and indicates clock-like behavior when it is abutting zero (Drummond et al. 2006; Ho et al. 2015). In (B) and (E), the substitution rate is shown for the stem branches of VOCs and for the mean of background branches (i.e., those that are not the stems of VOCs), abbreviated as “B.” The dashed line denotes the mean background rate, whereas the dotted lines represent the upper and lower 95% credible interval. (C) and (F) show the percentile in which stem branches for VOCs fall with respect to other branches. Note that the densities have been smoothed, but the maximum values are 100.

References

    1. Abdool Karim SS, de Oliveira T.. 2021. New SARS-CoV-2 variants—clinical, public health, and vaccine implications. N Engl J Med. 384(19):1866–1868. - PMC - PubMed
    1. Anisimova M, Gil M, Dufayard J-F, Dessimoz C, Gascuel O.. 2011. Survey of branch support methods demonstrates accuracy, power, and robustness of fast likelihood-based approximation schemes. Syst Biol. 60(5):685–699. - PMC - PubMed
    1. Baele G, Lemey P, 2014. Bayesian model selection in phylogenetics and genealogy-based population genetics. In: Chen M, Kuo L, Lewis P, editors. Bayesian phylogenetics, methods, algorithms, and applications. Chapter 4. Boca Raton (FL): CRC Press. p. 59–93.
    1. Baele G, Lemey P, Bedford T, Rambaut A, Suchard MA, Alekseyenko AV.. 2012. Improving the accuracy of demographic and molecular clock model comparison while accommodating phylogenetic uncertainty. Mol Biol Evol. 29(9):2157–2167. - PMC - PubMed
    1. Baele G, Lemey P, Suchard MA.. 2016. Genealogical working distributions for Bayesian model testing with phylogenetic uncertainty. Syst Biol. 65(2):250–264. - PMC - PubMed

Publication types

Substances

Supplementary concepts