. 2022 Jan 17;5(4):e202101272.
doi: 10.26508/lsa.202101272. Print 2022 Apr.

Malaria abrogates O'nyong-nyong virus pathologies by restricting virus infection in nonimmune cells

Affiliations

Malaria abrogates O'nyong-nyong virus pathologies by restricting virus infection in nonimmune cells

Anthony Torres-Ruesta et al. Life Sci Alliance. .

Abstract

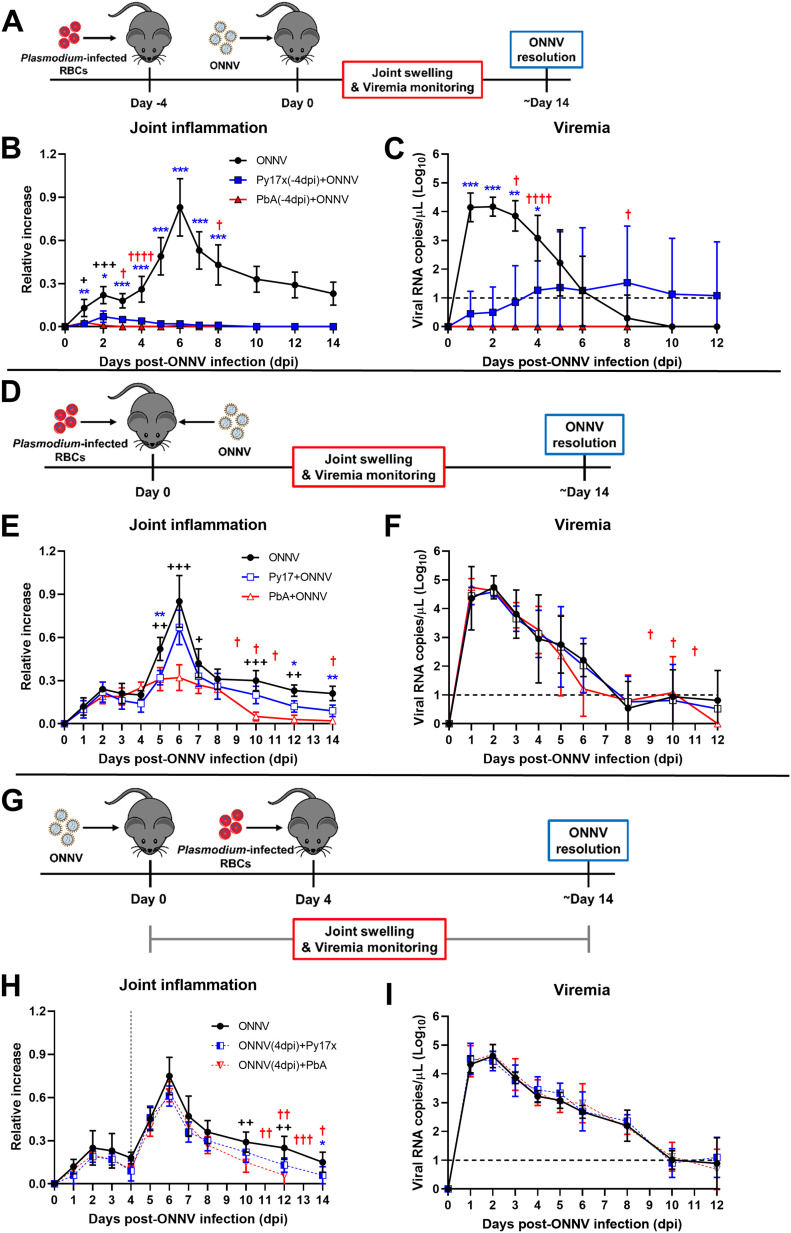
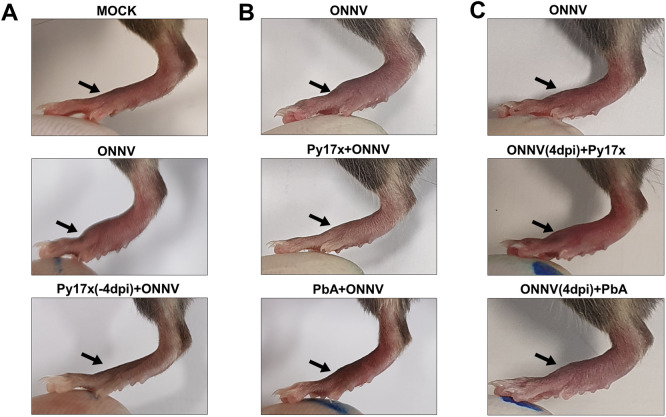
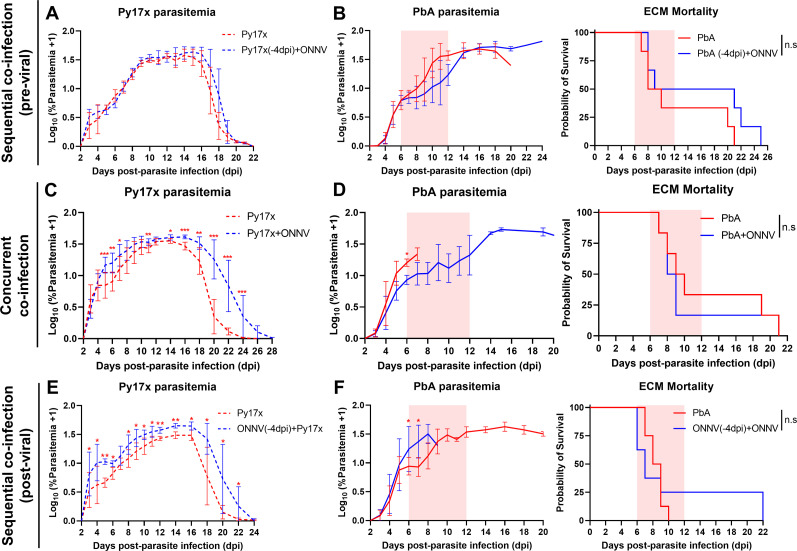
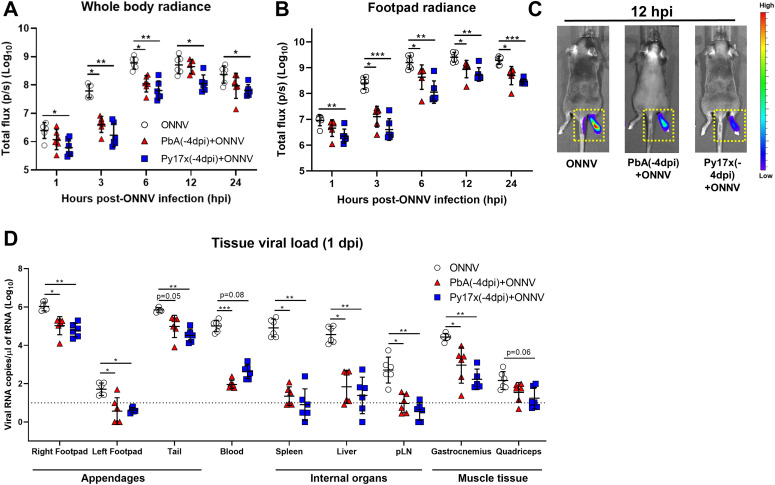
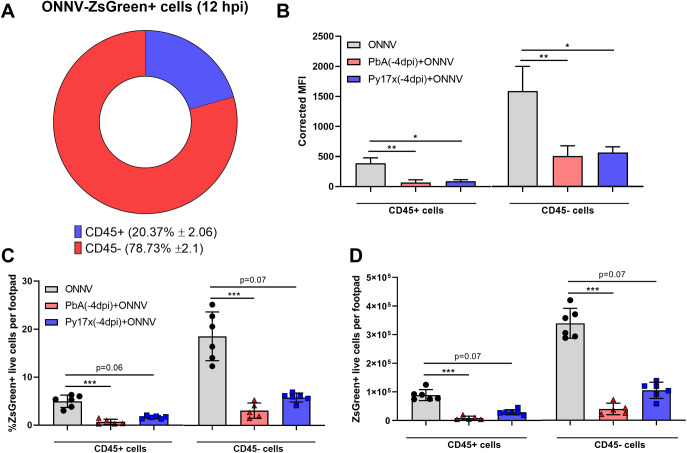
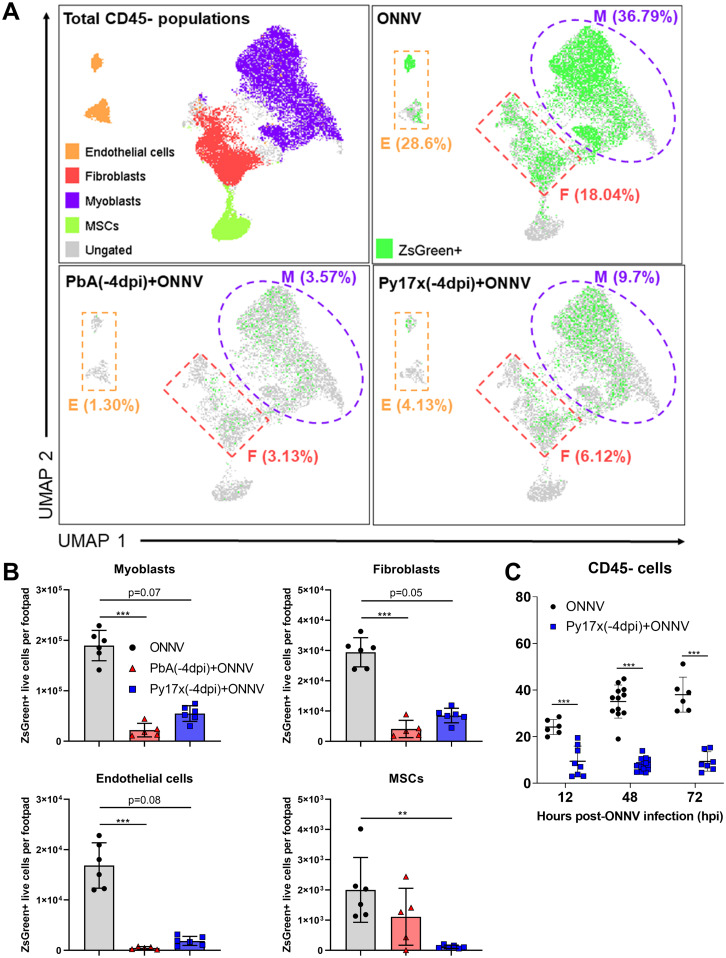
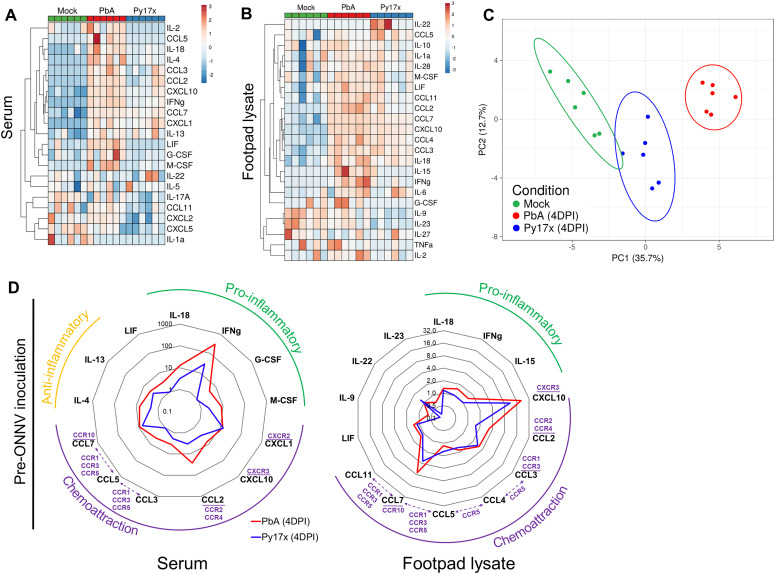
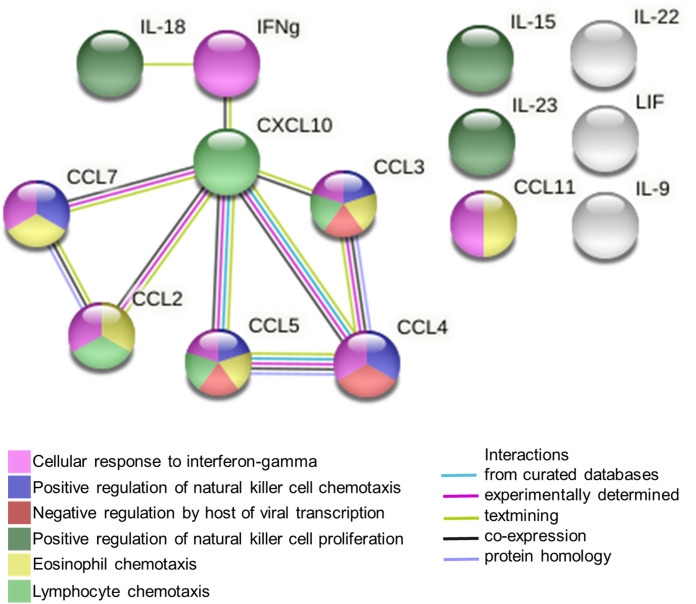
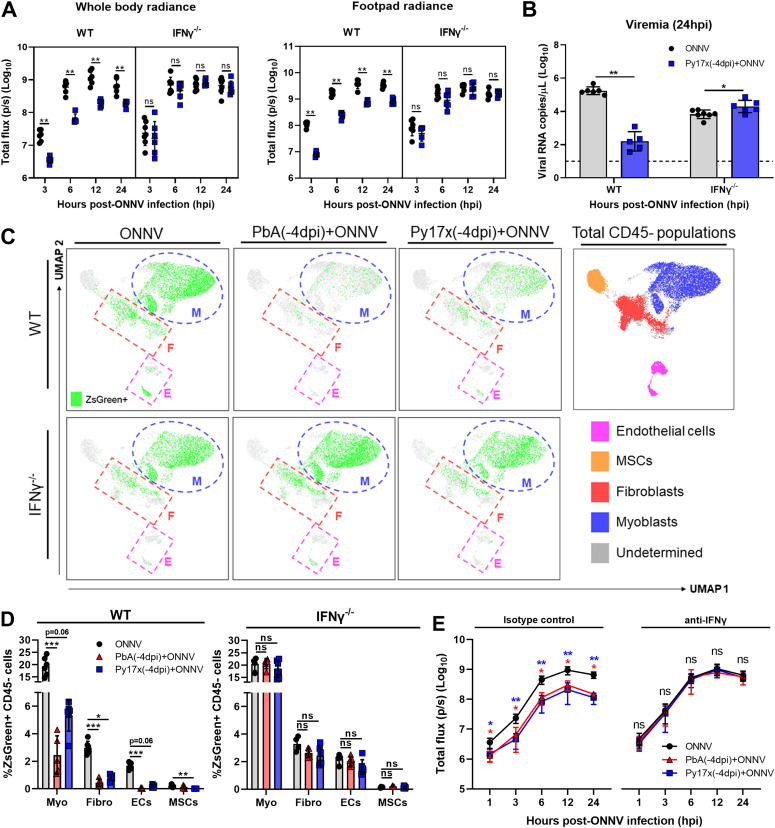
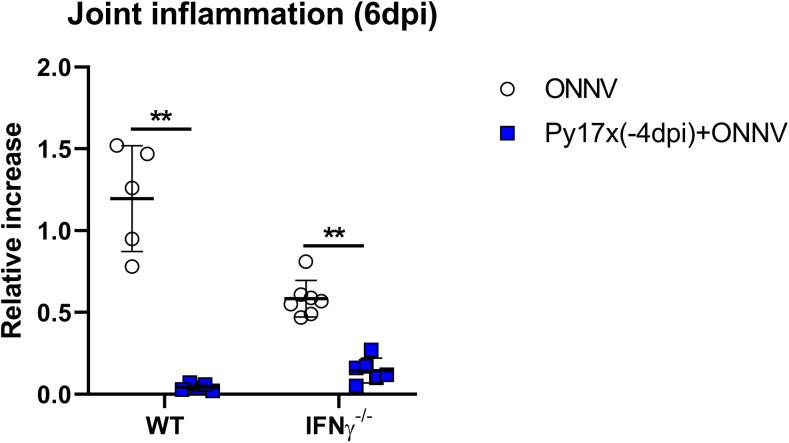
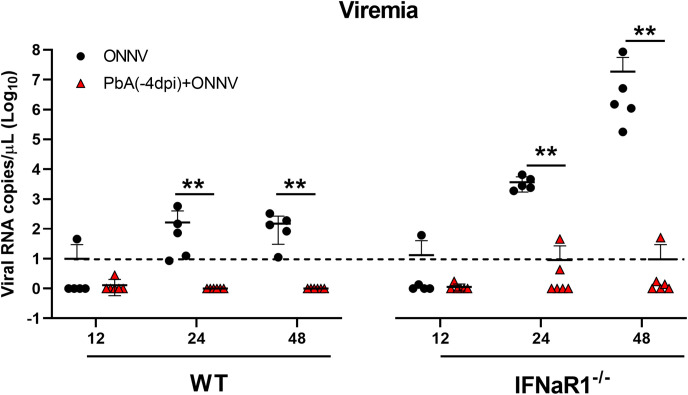
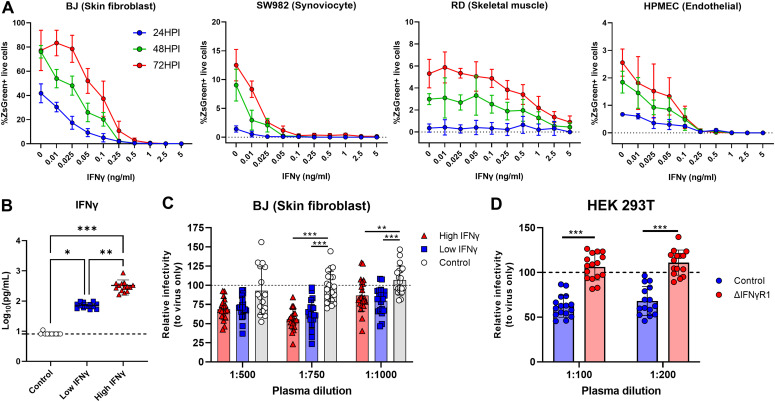
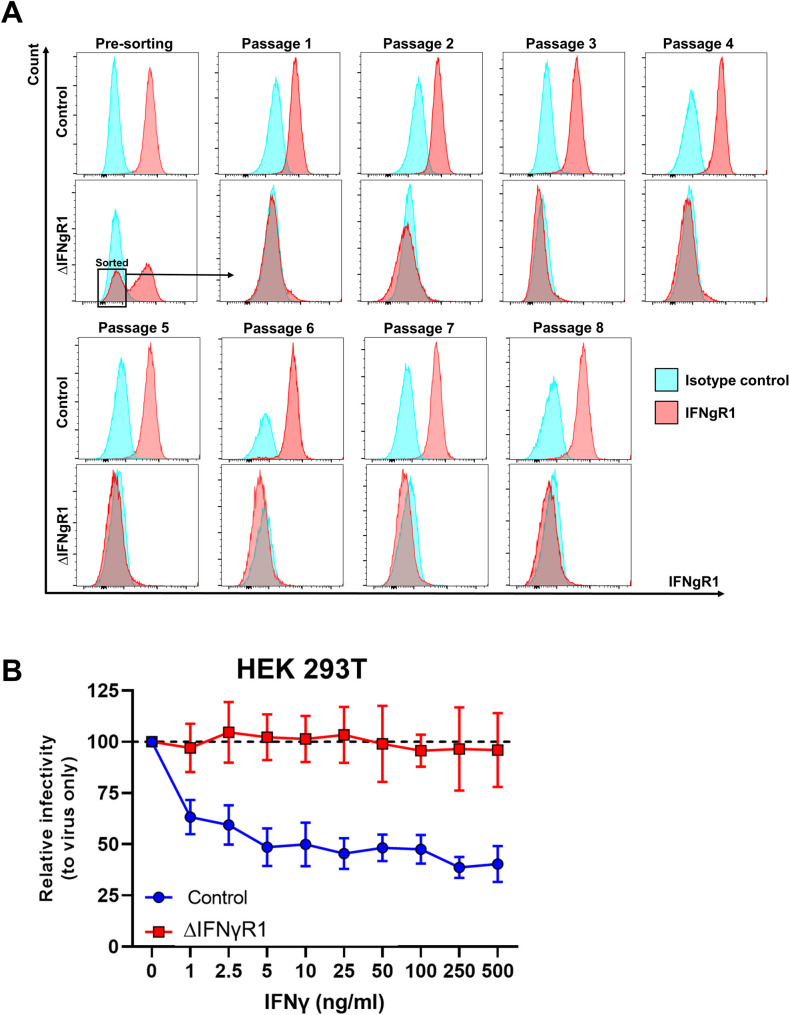
O'nyongnyong virus (ONNV) is a re-emerging alphavirus previously known to be transmitted by main malaria vectors, thus suggesting the possibility of coinfections with arboviruses in co-endemic areas. However, the pathological outcomes of such infections remain unknown. Using murine coinfection models, we demonstrated that a preexisting blood-stage Plasmodium infection suppresses ONNV-induced pathologies. We further showed that suppression of viremia and virus dissemination are dependent on Plasmodium-induced IFNγ and are associated with reduced infection of CD45- cells at the site of virus inoculation. We further proved that treatment with IFNγ or plasma samples from Plasmodium vivax-infected patients containing IFNγ are able to restrict ONNV infection in human fibroblast, synoviocyte, skeletal muscle, and endothelial cell lines. Mechanistically, the role of IFNγ in restricting ONNV infection was confirmed in in vitro infection assays through the generation of an IFNγ receptor 1 α chain (IFNγR1)-deficient cell line.


Conflict of interest statement

The authors declare that they have no conflict of interest.

Figures

Figure 1.
Figure 1.. Preexisting murine malaria protects mice from ONNV-induced pathologies.
(A) Previral Plasmodium infection: mice were infected with PbA or Py17x 4 d prior ONNV inoculation according to the schematic in (A). (B, C) Joint swelling and (C) viremia measurements in ONNV, Py17x(-4dpi)+ONNV, and PbA(-4dpi)+ONNV groups. (D) Concurrent coinfection: animals were simultaneously infected with ONNV and PbA or Py17x on the same day according to the schematic in (D). (E, F) Joint swelling and (F) viremia measurements in ONNV, Py17x+ONNV, and PbA+ONNV groups. (G) Postviral Plasmodium infection: mice were infected with ONNV 4 d prior PbA or Py17x inoculation according to the schematic in (G). (H, I) Joint swelling and (I) viremia measurements in ONNV, ONNV(-4dpi)+Py17x, and ONNV(-4dpi)+PbA groups. Data are presented as mean ± SD of at least five animals per experimental group and are representative of two independent experiments. Differences between ONNV controls and coinfected mice with PbA (++P < 0.01, +++P < 0.01) or Py17x (*P < 0.05, **P < 0.01, ***P < 0.001) were calculated using two-tailed Kruskal–Wallis and post hoc Dunn’s tests. When PbA-infected animals succumbed to ECM, differences between ONNV singly infected controls and coinfected mice with Py17x were computed using two-tailed Mann–Whitney U test instead. “†” represents one mouse that succumbed of PbA-induced ECM on the respective day. Horizontal dashed lines in (C), (F) and (I) represent the qRT-PCR detection limit. Vertical dashed line in (H) represents the day on which Plasmodium parasites were inoculated.
Figure S1.
Figure S1.. Effect of Plasmodium infection on ONNV-induced joint swelling.
(A, B, C) depict infected footpads at 6 d post-ONNV inoculation (major peak of joint swelling in ONNV-infected animals) upon sequential (previral), concurrent, and sequential (postviral) coinfection.
Figure S2.
Figure S2.. Effect of ONNV infection on Plasmodium pathologies.
For (A, B), mice were infected with Plasmodium parasites (PbA or Py17x) 4 d before ONNV inoculation. For (C, D), animals were concurrently coinfected with ONNV and Plasmodium parasites on the same day. For (E, F) mice were infected with ONNV 4 d before Plasmodium parasite inoculation. (A) Py17x parasitemia in Py17x and Py17x(-4dpi)+ONNV groups. (B) PbA parasitemia and ECM mortality in PbA and PbA(-4dpi)+ONNV groups. (C) Py17x parasitemia in Py17x and Py17x+ONNV groups. (D) PbA parasitemia and ECM mortality in PbA and PbA+ONNV groups. (E) Py17x parasitemia in Py17x and ONNV(-4dpi)+Py17x groups. (F) PbA parasitemia and ECM mortality in PbA and ONNV(-4dpi)+PbA groups. For (B, D, F), area in pink indicates ECM window. Data are presented as mean ± SD. Differences between groups were calculated using two-tailed Mann–Whitney U test (*P < 0.05, **P < 0.01, ***P < 0.001). ECM mortality curves were analyzed by log rank (Mantel–Cox) test (n.s, not significant).
Figure 2.
Figure 2.. Early stages of ONNV replication and dissemination are supressed by preexisting Plasmodium infection.
Mice were infected with Py17x or PbA and 4 d postinfection were inoculated with a firefly luciferase-tagged ONNV clone in the right hind limb footpad. Before data acquisition, mice were injected with 100 μl of D-Luciferin (5 mg/ml) subcutaneously. (A, B) Whole body radiance and (B) footpad radiance of ONNV, Py17x(-4dpi)+ONNV, and PbA(-4dpi)+ONNV groups at 1, 3, 6, 12, and 24 hpi. (C) Representative pseudo-coloured images of bioluminescence readings depicting reduction of tissue viral load and restriction of viral dissemination in coinfected animals at 12 hpi (yellow-doted boxes). (D) Tissue viral load in mouse appendages, internal organs and muscle detected by qRT-PCR at 24 hpi. Data are presented as mean ± SD of at least five animals per experimental group. Differences between ONNV controls and coinfected mice with PbA or Py17x were calculated using two-tailed Kruskal–Wallis and post hoc Dunn’s tests (*P < 0.05 **P < 0.01, ***P < 0.001).
Figure S3.
Figure S3.. CD45 cells display higher ONNV infection rates than CD45+ cells in mouse footpads at 12 hpi.
(A) Pie chart representing the identity of ONNV-ZsGreen+ footpads cells at 12 hpi in ONNV-infected animals. (B) Corrected ONNV-ZsGreen median fluorescence intensity values of CD45+ and CD45 cells at 12 hpi. (C, D) Frequency and (D) total counts of ZsGreen+ live events in CD45+ and CD45 footpad cells of ONNV, PbA(-4dpi)+ONNV, and Py17x(-4dpi)+ONNV groups at 12 hpi. Data are presented as mean ± SD of at least five animals per experimental group. Differences between ONNV controls and coinfected mice with PbA or Py17x were calculated using two-tailed Kruskal–Wallis and post hoc Dunn’s tests (*P < 0.05 **P < 0.01, ***P < 0.001).
Figure 3.
Figure 3.. Prior Plasmodium infection restricts ONNV replication in CD45 footpad cells.
(A) UMAP analysis of 105,000 live CD45 footpad cells from naive, ONNV, PbA(-4dpi)+ONNV, and Py17x(-4dpi)+ONNV groups at 12 hpi. The UMAP plot was generated by concatenation of samples containing 5,000 randomly selected live CD45 cells from each sample. ONNV, PbA(-4dpi)+ONNV, and Py17x(-4dpi)+ONNV UMAP plots show the global distribution of ZsGreen+ events (ONNV-infected cells). Colored dashed boxes highlight myoblasts (M), fibroblasts (F), and endothelial cells (E) and median ONNV infection rates per population. (B) Total counts of ONNV-ZsGreen+ cells in endothelial cells, myoblasts, fibroblasts and mesenchymal stem cells (MSCs) in ONNV, PbA(-4dpi)+ONNV, and Py17x(-4dpi)+ONNV at 12 hpi. (C) Percentages of infected CD45 cells in ONNV and Py17x(-4DPI)+ONNV groups at 12, 48, and 72 hpi. Data are presented as mean ± SD of at least five animals per experimental group. Differences between ONNV controls and coinfected mice with PbA or Py17x were calculated using two-tailed Kruskal–Wallis and post hoc Dunn’s tests (**P < 0.01, ***P < 0.001).
Figure 4.
Figure 4.. Footpads of Plasmodium-infected mice display a pro-inflammatory milieu.
(A, B) Heat map plots showing the detected cytokines/chemokines in (A) serum and (B) footpad lysates of mock-infected (green), PbA-infected (red), and Py17x-infected (blue) mice at 4 dpi. Analyte concentrations (pg/ml + 1) were logarithmically transformed (Log10) and Z-scores were calculated for representation purposes. Principal component analysis (PCA) and heat map plots were constructed using ClustVis. (C) PCA using differentially expressed analytes in footpad lysates and sera of mock, PbA-infected (4 dpi), and Py17x-infected (4 dpi) groups. PCA plot shows that PC1 (responsible for 35.7% of the variation) and PC2 (responsible for 12.7% of the variation) segregate the populations in three clusters: mock (green), PbA-infected (red), and Py17x-infected (blue). Colored ellipses were calculated with 95% confidence levels. (D) Radar plots showing median fold changes of differentially expressed cytokines/chemokines in serum and footpad lysates of PbA-infected (4 dpi) and Py17x-infected (4 dpi) groups relative to mock animals. Each cytokine/chemokine is grouped according to its immunological function (green: pro-inflammatory, yellow: anti-inflammatory) or homing receptors (purple) as indicated. Shared chemokine receptors are shown in dashed lines. Data correspond six animals per experimental group. Differences between naïve, PbA, or Py17x-infected mice calculated using two-tailed Kruskal–Wallis and post hoc Dunn’s tests.
Figure S4.
Figure S4.. STRING interaction network was generated using differentially expressed analytes in footpad lysates of PbA-infected and Py17x-infected groups with highest confidence threshold (0.9) and false discovery rate of 1%.
Cytokines/chemokines involved in some of the top Gene Ontology biological processes are represented in different colors. Connecting lines represent expected interactions as indicated in the legend. IFNg, interferon gamma; IL-18, interleukin-18; CXCL10, C-X-C motif chemokine ligand 10; CCL2, chemokine (C–C motif) ligand 2; CCL3, chemokine (C–C motif) ligand 3; CCL4, chemokine (C–C motif) ligand 4; CCL5, chemokine (C–C motif) ligand 5; CCL7, chemokine (C–C motif) ligand 7; CCL11, C–C motif chemokine 11; IL-9, interleukin-9; IL-15, interleukin-15; IL-22, interleukin-22; IL-23, interleukin-23.
Figure 5.
Figure 5.. Plasmodium-induced IFNγ mediates the suppression of ONNV replication and dissemination in coinfected animals.
(A, B) In vivo luminescence readings of (A) whole body and footpad radiance at 3, 6, 12, and 24 hpi and (B) viremia at 24 hpi of ONNV and Py17x(-4dpi)+ONNV wild-type (WT), or IFNγ-deficient (IFNγ−/−) animals. (C) UMAP analysis of 160,000 live CD45 footpad cells from WT or IFNγ−/− ONNV, PbA(-4dpi)+ONNV, and Py17x(-4dpi)+ONNV groups at 12 hpi. The UMAP plot was generated by concatenation of samples containing 5,000 randomly selected live CD45 cells from each sample. ONNV, PbA(-4dpi)+ONNV, and Py17x(-4dpi)+ONNV UMAP plots show the global distribution of ZsGreen+ events (ONNV-infected cells). Colored dashed boxes highlight ONNV infection in myoblasts, M; fibroblasts, F and endothelial cells, E. (D) Frequency of CD45-ZsGreen+ footpad cells of WT or IFNγ−/− ONNV, PbA(-4dpi)+ONNV, and Py17x(-4dpi)+ONNV groups at 12 hpi. Myo, myoblasts; Fibro, fibroblasts; ECs, endothelial cells and MSCs, mesenchymal stem cells. (E) Footpad radiance at 1, 3, 6, 12, and 24 hpi of ONNV, PbA(-4dpi)+ONNV, and Py17x(-4dpi)+ONNV groups in animals treated with mouse anti-IFNγ or isotype control. Data are presented as mean ± SD of at least five animals per experimental group. (A, B) Two-tailed Mann–Whitney U test was used to compute differences between ONNV and Py17x(-4dpi)+ONNV groups in (A) and (B) (*P < 0.05 **P < 0.01). Differences between ONNV, PbA(-4dpi)+ONNV, and Py17x(-4dpi)+ONNV groups were calculated using two-tailed Kruskal–Wallis and post hoc Dunn’s tests (*P < 0.05 **P < 0.01, ***P < 0.001).
Figure S5.
Figure S5.. Footpad swelling measurements in wild type and INFγ-deficient animals at 6 dpi (peak of inflammation).
Data are presented as mean ± SD. Differences between ONNV singly infected controls and coinfected mice with Py17x were computed using two-tailed Mann–Whitney U test (**P < 0.01).
Figure S6.
Figure S6.. Type I IFN responses are not involved in the antiviral effects exerted by Plasmodium infection.
Viremia measurements of ONNV and Py17x(-4dpi)+ONNV WT mice and ONNV and Py17x(-4dpi)+ONNV IFNaR1−/− mice at 12, 24, and 48 hpi. Data are presented as mean ± SD. Differences between groups were calculated using two-tailed Mann–Whitney U test (*P < 0.05, **P < 0.01). Horizontal dashed lines represent the qRT-PCR detection limit.
Figure 6.
Figure 6.. In vitro stimulation with human IFNγ or plasma from malaria patients reduces susceptibly to ONNV infection.
For (A), cells were treated with recombinant human IFNγ for 24 h before ONNV infection at MOI 10. (A) ONNV infection rates in BJ, SW982, HPMEC, and RD at 24, 48, and 72 hpi. (B) IFNγ levels in plasma of healthy controls (HC, n = 10), low (n = 13), and high (n = 14) IFNγ responders. For (C), BJ cells were treated with pooled plasma dilutions from P. vivax–infected patients or healthy controls for 12 h before ONNV infection at MOI 1. For (D), control or ∆IFNγR1 HEK293T cells were treated with pooled plasma (1:100 or 1:200) from P. vivax-infected patients for 12 h before ONNV infection at MOI 1. Differences between three groups were calculated using two-tailed Kruskal–Wallis and post hoc Dunn’s tests, differences between two groups were calculated using two-tailed Mann–Whitney U test (*P < 0.05 **P < 0.01, ***P < 0.001). Data are presented as mean ± SD values and representative of two independent experiments.
Figure S7.
Figure S7.. ∆IFNγR1 HEK293T cell line lacks protection against ONNV upon IFNγ stimulation.
(A) IFNγR1 expression profile in control or ∆IFNγR1 HEK293T cells. After puromycin selection, ∆IFNγR1 HEK293T cells were assessed for IFNγR1 expression (presorting). The IFNγR1-negative fraction was sorted by FACS and expanded for up to eight passages. IFNγR1 expression was analyzed after every passage. (B) Control or ∆IFNγR1 HEK293T were treated with serial dilutions of recombinant human IFNγ for 24 h and infected with ONNV (MOI = 5).

References

    1. Rezza G, Chen R, Weaver SC (2017) O’nyong-nyong fever: A neglected mosquito-borne viral disease. Pathog Glob Health 111: 271–275. 10.1080/20477724.2017.1355431 - DOI - PMC - PubMed
    1. Powers AM, Brault AC, Shirako Y, Strauss EG, Kang W, Strauss JH, Weaver SC (2001) Evolutionary relationships and systematics of the alphaviruses. J Virol 75: 10118–10131. 10.1128/JVI.75.21.10118-10131.2001 - DOI - PMC - PubMed
    1. Sanders EJ, Rwaguma EB, Kawamata J, Kiwanuka N, Lutwama JJ, Ssengooba FP, Lamunu M, Najjemba R, Were WA, Bagambisa G, et al. (1999) O’nyong-nyong fever in south-central Uganda, 1996-1997: Description of the epidemic and results of a household-based seroprevalence survey. J Infect Dis 180: 1436–1443. 10.1086/315073 - DOI - PubMed
    1. Williams MC, Woodall JP, Corbet PS, Gillett JD (1965) O’nyong-Nyong fever: An epidemic virus disease in East Africa. 8. Virus isolations from Anopheles mosquitoes. Trans R Soc Trop Med Hyg 59: 300–306. 10.1016/0035-9203(65)90012-x - DOI - PubMed
    1. Haddow AJ, Davies CW, Walker AJ (1960) O’nyong-nyong fever: An epidemic virus disease in East Africa 1. Introduction. Trans R Soc Trop Med Hyg 54: 517–522. 10.1016/0035-9203(60)90025-0 - DOI - PubMed

Publication types