. 2022 Jan 17;13(1):334.
doi: 10.1038/s41467-021-27923-z.

RNF43/ZNRF3 loss predisposes to hepatocellular-carcinoma by impairing liver regeneration and altering the liver lipid metabolic ground-state

Affiliations

RNF43/ZNRF3 loss predisposes to hepatocellular-carcinoma by impairing liver regeneration and altering the liver lipid metabolic ground-state

Germán Belenguer et al. Nat Commun. .

Abstract

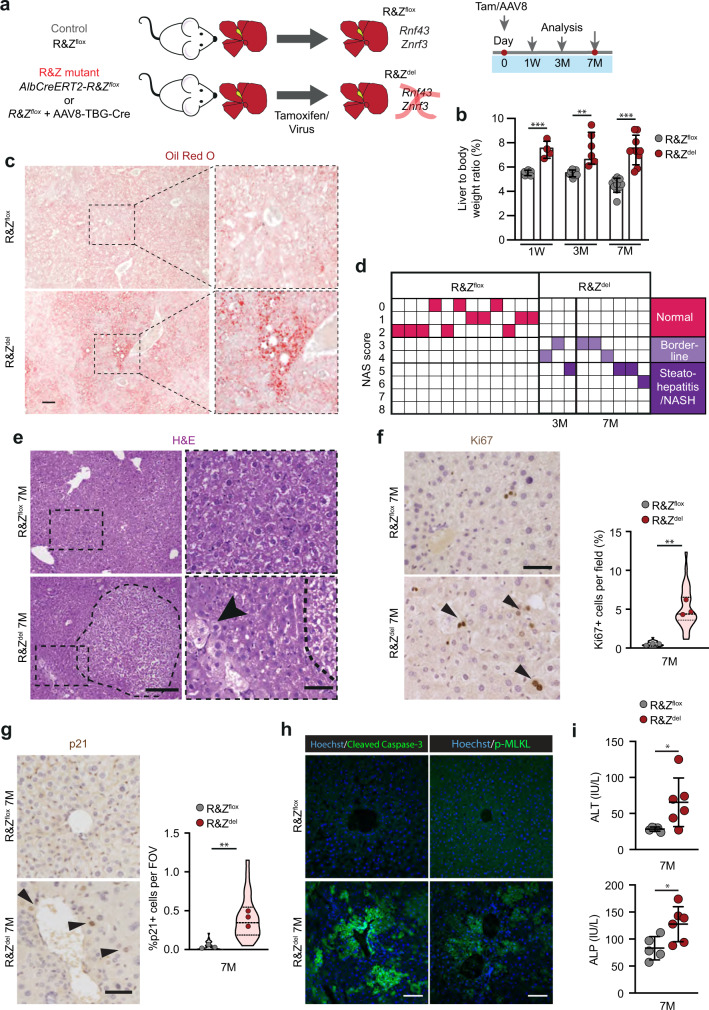
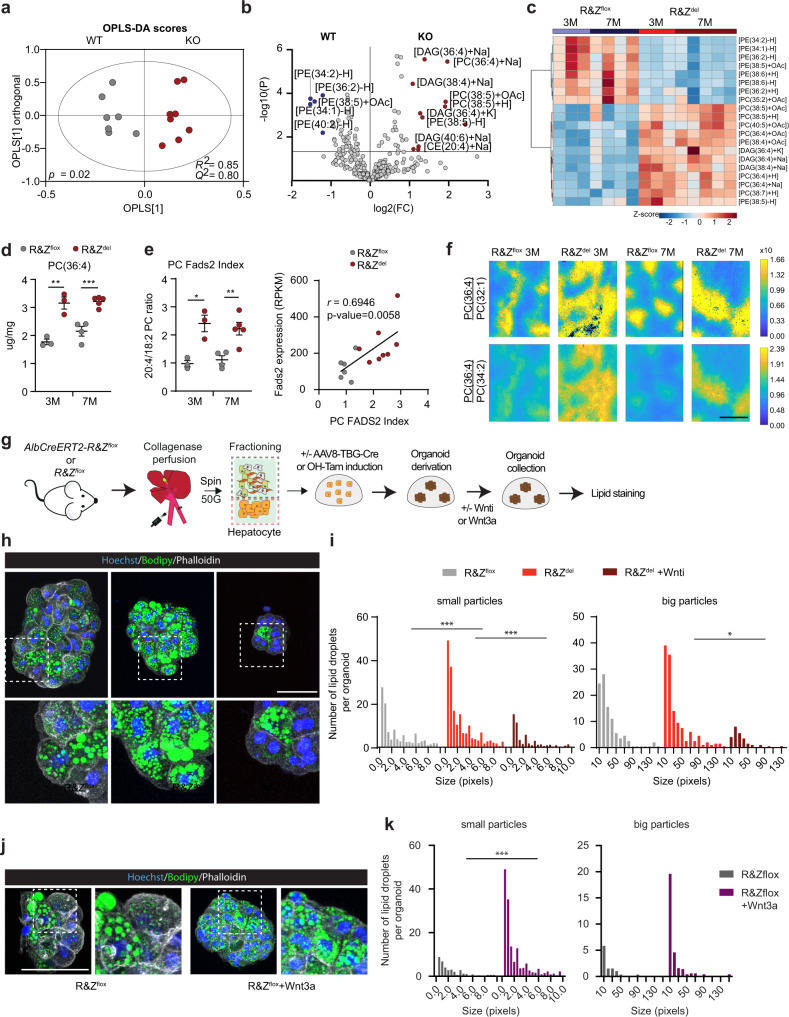
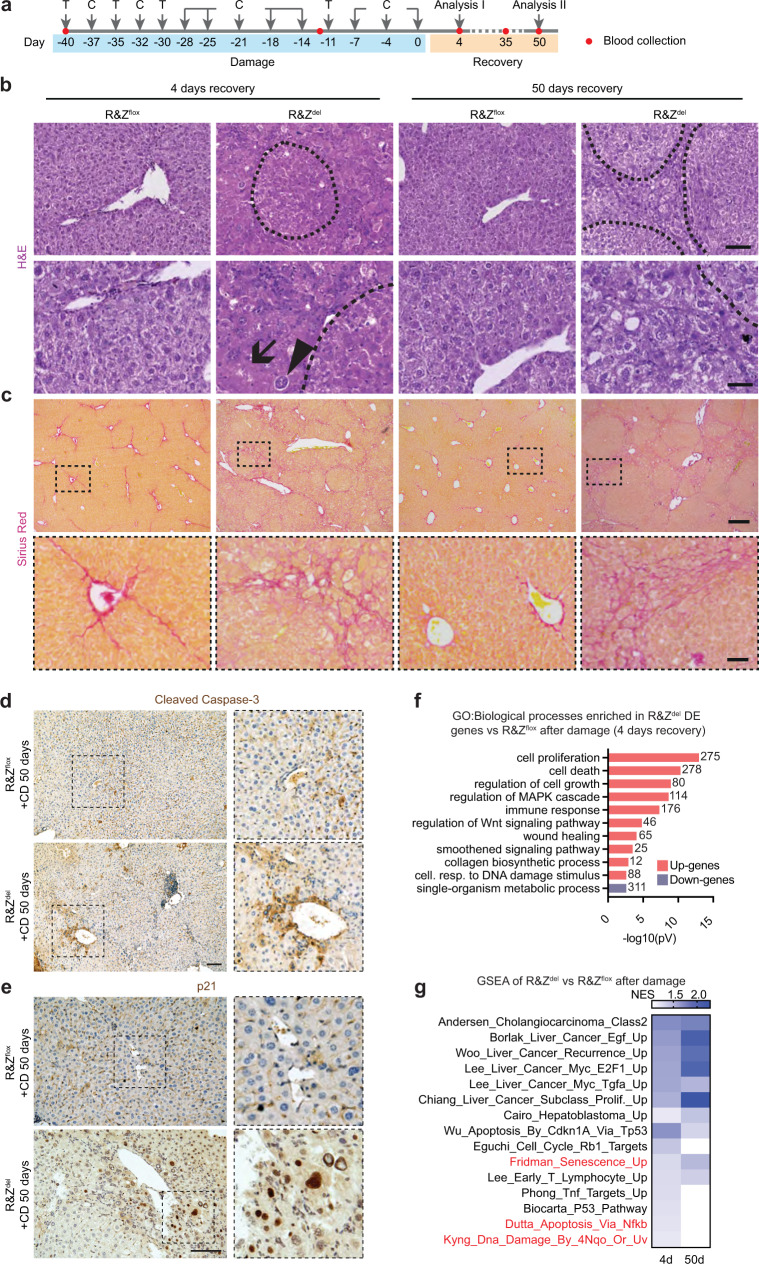
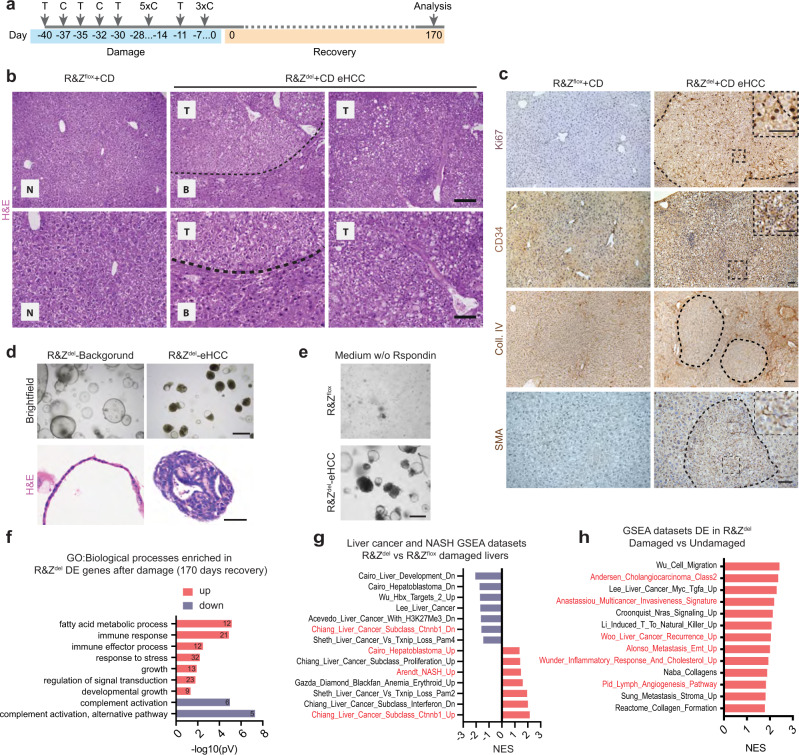
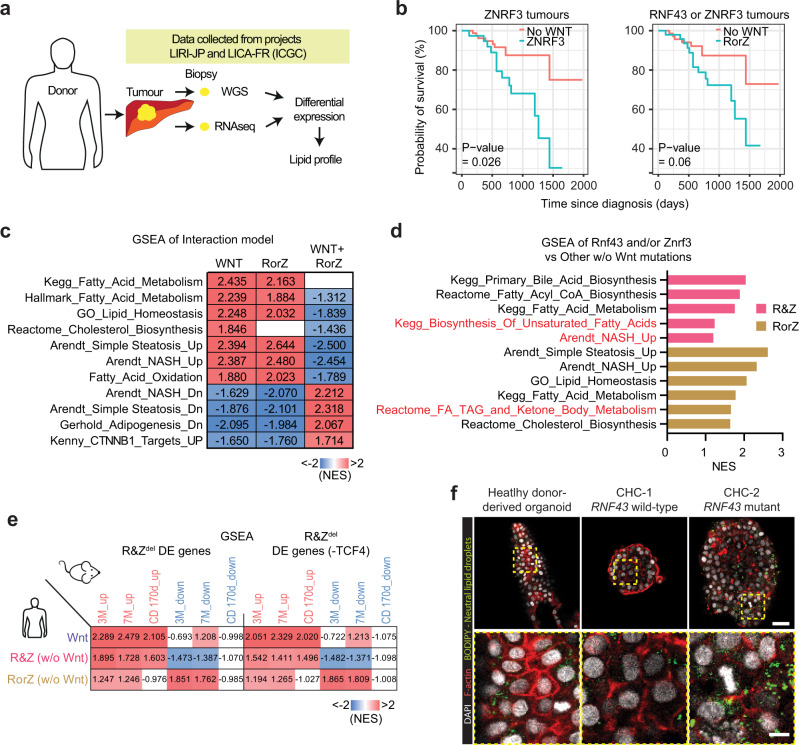
RNF43/ZNRF3 negatively regulate WNT signalling. Both genes are mutated in several types of cancers, however, their contribution to liver disease is unknown. Here we describe that hepatocyte-specific loss of Rnf43/Znrf3 results in steatohepatitis and in increase in unsaturated lipids, in the absence of dietary fat supplementation. Upon injury, Rnf43/Znrf3 deletion results in defective hepatocyte regeneration and liver cancer, caused by an imbalance between differentiation/proliferation. Using hepatocyte-, hepatoblast- and ductal cell-derived organoids we demonstrate that the differentiation defects and lipid alterations are, in part, cell-autonomous. Interestingly, ZNRF3 mutant liver cancer patients present poorer prognosis, altered hepatic lipid metabolism and steatohepatitis/NASH signatures. Our results imply that RNF43/ZNRF3 predispose to liver cancer by controlling the proliferative/differentiation and lipid metabolic state of hepatocytes. Both mechanisms combined facilitate the progression towards malignancy. Our findings might aid on the management of those RNF43/ZNRF3 mutated individuals at risk of developing fatty liver and/or liver cancer.


Conflict of interest statement

M.H. is an inventor in a patent (PCT/EP2015/060815) on liver organoids. The remaining authors declare no competing interests.

Figures

Fig. 1
Fig. 1. Rnf43/Znrf3 (R&Z) deletion induces hepatocyte proliferation, hepatomegaly, tissue degeneration and steatohepatitis.
a Experimental design. Liver-specific Rnf43/Znrf3del mice (R&Zdel) were generated by injecting AAV8-TGB-Cre virus to 8–12week-old Rnf43/Znrf3flox mice (R&Zflox) or by injecting tamoxifen (Tam) to 8–12-week-old AlbCre-ERT2-R&Zflox mice. Control R&Zflox mice received AAV8-null virus or vehicle. Livers were collected at 1 week (1W), 3 months (3 M) or 7 months (7M) later. Red dot, blood collection. b R&Zdel results in hepatomegaly. The graph represents the percentage of liver-to-body weight ratio. Results are presented as mean + /− SD from R&Zflox 1W, n = 5; R&Zdel 1W; R&Zflox 3M, n = 7; R&Zdel 3M, n = 6; R&Zdel 7M, n = 9; R&Zflox 7M, n = 10. Unpaired two-tail t test. 1W, ***p = 0.0007; 3M, **p = 0.0017; 7M, ***p = 0.0001. c Oil red-O staining in R&Zdel 3M. Representative pictures of n = 3 independent experiments. Scale bar, 100 μm. d NAS scoring. Each column represents an independent mouse. Pink = NAS score 0–2 = Normal; clear violet = NAS score 3–4= borderline; dark violet = NAS score 5–8= steatohepatitis. e Representative histopathological analysis showing nodules (dashed circle) with cellular degeneration and ballooned hepatocytes (arrowheads) in R&Zdel livers (n = 7). Scale bar, 100 μm (left) and 50 μm (right). f R&Zdel livers present a significant increase in the number of proliferating (Ki67+, arrowheads) cells. Representative pictures. Scale bar, 50 μm. Graphs represent the percentage of Ki67+ hepatocytes per field-of-view (FOV). Violin plot represents median, IQR and full distribution of all FOVs (n  = 10 per mouse). Dots, mean of all FOV per mouse (n  = 3). Unpaired two-tail t test of means, **p = 0.0011. g Representative pictures of liver sections stained for p21 (arrowheads, p21+ cells). Scale bar, 50 μm. The graph represents the quantification of p21+ cells at 7M of age. Data are represented as violin plots showing median, IQR and full distribution of FOVs (n  = 10). Dots, mean of all FOV per mouse (n  = 3). Unpaired two-tail t test of means, **p = 0.0034. h Cleaved Caspase-3 and p-MLKL staining in control (top) and R&Zdel (bottom). Representative images from n = 3 independent 7M old mice. Scale bar, 100 μm. i Serum levels for ALT and ALP. Data represent mean + /− SD of n = 5 R&Zflox and n = 6 R&Zdel samples. Unpaired two-tail t test. ALT, *p = 0.0376; ALP, *p = 0.0279. Source data are provided as a Source data file.
Fig. 2
Fig. 2. Rnf43 and Znrf3 (R&Z) null hepatocytes present lipid metabolic transcriptional changes.
af Liver tissues from 1- 3- and 7-month-old R&Zdel mice and R&Zflox littermates were collected and processed for RNAseq analysis. Differentially expressed (DE) gene profiles were obtained as described in “Methods.” a Principal component analysis (PCA) of R&Zflox and R&Zdel. Each data point represents one sample. Note that PC1 is strongly correlated with gender, whereas PC3 separates R&Zflox mice from R&Zdel mice. PC2 corresponded to the two batches (batch1 and batch 2) from which the data were generated. b Graphs showing top 3 gene ontology (GO) terms significantly enriched for genes upregulated (red) and downregulated (purple) in R&Zdel compared to R&Zflox. Full list in Supplementary Data 1. c Venn diagram showing a correlation between genes involved in lipid metabolism (brown), TCF4 target genes (green) and genes DE at any time point in R&Zdel livers (purple). The numbers denote the number of genes in each comparison. Details are given in Supplementary Data 3. d, e Heatmaps of the lipid metabolism genes DE in R&Zdel livers. d Genes DE averaged between all mice per time point and ranked by fold change with respect to their respective R&Zflox control. e DE genes showing some representative lipid metabolic genes. Likelihood ratio test and Benjamini–Hochberg correction; Fasn, 3M *p = 0.0446, 7M ***p = 0.0001; Fads1, 3M ***p = 0.0006; Fads2, 1M ***p = 0.0038, 3M ***p = 0.0001, 7M *p = 0.0282; Elovl2, 3M *p = 0.0392, 7M **p = 0.0088; Elovl6, 3M **p = 0.0020, 7M **p = 0.0088. f Heatmap of the RPKM values (raw z-scored) of DE lipid metabolic genes found to be TCF4 targets. Each column, one independent biological replicate. Source data are provided as a Source data file.
Fig. 3
Fig. 3. Rnf43/Znrf3del livers present altered lipid composition and zonation and cell-autonomous accumulation of lipid droplets.
ae Lipidomics analysis in the mutant (R&Zdel) and control (R&Zflox) mice at 3 (3M) and 7 months (7M) post-deletion. a Orthogonal Partial Least Squares Discriminant Analysis (OPLS-DA) model of hepatic lipid profiles discriminates between genotypes. R2 = 0.85, Q2 = 0.80, p = 0.02. b Volcano plot highlights significantly changed lipids; horizontal line shows p = 0.05 as determined by unpaired t test. c Heatmap analysis of lipid features across the two genotypes and time points. The top 20 features (based on ANOVA) are shown. d PC(36:4) abundance. Unpaired two-tail t test. 3M, **p = 0.0042; 7M, ***p = 0.0005. e PC Fads2 index and RNA correlation. Left, Fads2 index [PC(36:4) + PC(38:4)/PC(34:2) + PC(36:2)]. Data are represented as mean + /− SD of n = 3 (3M) and n = 4–5 (7M) mice per group. Unpaired two-tail t test. 3M, *p = 0.0103; 7M, **p = 0.0059. Right, the correlation between PC Fads2 index and Fads2 RNA expression. Pearson correlation, r = 0.69, CI 95% (0.2597–0.8952), two-tailed p = 0.005. f Mass spectrometric imaging analysis shows increased intensity and expansion of area covered by PC(36:4) relative to PC(32:1) and PC(34:2) in R&Zdel liver. gk Isolated adult hepatocytes derived from either AlbCreERT-R&Zflox or R&Zflox livers were expanded and treated or not with hydroxy-tamoxifen (OH-Tam) or AAV8-TGB-Cre infection to induce Rnf43/Znrf3 deletion in vitro. The derived organoid lines and parental non-recombined lines were treated with Wnt inhibitors (Wnti, h, i) or WNT3A conditioned media (Wnt3a, j, k) and analysed for lipid droplet content by Bodipy staining. g Experimental design. hk Bodipy staining and quantification of R&Zflox and R&Zdel hepatocyte organoids grown in control medium or medium supplemented with Wnti. h Representative pictures from n = 2 independent experiments. Scale bar, 100 μm. i Image analysis quantification of the intracellular lipid droplets size and content (n  = 5). Two-way ANOVA with Tukey’s multiple comparisons. Small particles, R&ZfloxvsR&Zdel ***p = 0.0001; R&ZdelvsR&Zdel + Wnti ***p = 0.0001. Big particles, R&ZdelvsR&Zdel + Wnti *p = 0.0198. j, k Bodipy staining and quantification of R&Zflox wild-type hepatocyte organoids grown in control or WNT3A media. j Representative pictures from n = 2 independent experiments. Scale bar, 100 μm. k Image analysis quantification of the intracellular lipid droplets size and content (n  = 5), two-way ANOVA, *p = 0.0000. Source data provided in Source data file.
Fig. 4
Fig. 4. Liver-specific Rnf43/Znrf3 deletion leads to defective tissue regeneration after chronic CCl4 treatment.
ag Adult AlbCreERT2xRnf43/Znrf3flox mice received tamoxifen to generate Rnf43/Znrf3 null livers. After a washout period, CCl4 was injected twice a week for a total of 6 weeks and mice were collected at 4, 35 and 50 days after the last injection. These time points are equivalent to 1.5, 2.5 and 3 months post recombination, and hence comparable to the 1 month and 3 months undamaged mutant mice. Tamoxifen was re-administered to prevent expansion from un-recombined hepatocytes, which ensured a >80% recombination of both alleles (See Supplementary Fig 5). a Experimental design. T tamoxifen, C CCl4. b Representative pictures of H&E staining of n = 4 (CD 4d) and n = 3 (CD 50d) independent replicates. Histopathological analysis revealed increased tissue damage as evidenced by the presence of giant hepatocytes (arrowhead), de-cellularised areas (arrow) and regenerative nodules (dashed line) in Rnf43/Znrf3 mutant livers compared to littermate controls. Scale bar, 100 μm (top) and 50 μm (bottom). c Collagen deposition (Pico-Sirius red staining) in mutant livers after damage indicate mild fibrosis. Representative pictures of n = 4 (CD 4d) and n = 3 (CD 50d) independent biological replicates. Scale bar, 500 μm. Quantification of the fibrotic area is given in Supplementary Fig 5f. d, e Cleaved caspase-3 (d) and senescence marker p21 (e) stainings at 50 days of recovery from chronic damage. Representative images of n = 3 independent replicates. Scale bar, 100 μm. f Graph showing selected gene ontology (GO) terms significantly enriched for genes upregulated (red) and downregulated (purple) in R&Zdel compared to R&Zflox after damage. Numbers on the bars denote the number of genes associated with each term. Full list in Supplementary Data 1_S29–S32. g Heatmap of the normalised enrichment score (NES) of selected GSEA data sets at 4 and 50 days of recovery. Red, gene sets of apoptosis and senescence. Full list in Supplementary Data 1_S38–S45. Source data in Source data file.
Fig. 5
Fig. 5. Rnf43/Znrf3 loss impacts the regenerative capacity of hepatocytes by altering their proliferation/differentiation states.
ag Adult R&Zflox mice were treated with tamoxifen or AAV8-TGB-Cre to generate R&Zdel. Controls were treated with vehicle or AAV8-null virus. Induced mice underwent partial hepatectomy (PHx) and samples were collected at the indicated time points. a, b Experimental design (a) and timeline (b). c Fold change of the number of proliferating (Ki67+) cells in R&Zdel livers with respect to corresponding controls in homoeostasis (3 or 7 months of deletion), after CCl4 (4 or 50 days recovery) or PHx (7 or 21 days recovery) damage. Violin plot showing median, IQR and full distribution of a minimum of 10 FOV per mouse (n = 3 or n = 4, CD 4d). Two-way ANOVA with Sidak multiple comparisons. Homeostasis, **p = 0.0023; PHx, ***p = 0.0003. d, e Common signature of 92 genes upregulated in the mutant upon PHx and CCl4 chronic damage. d Venn diagram. e Top 10 GO biological processes. Details in Supplementary Data 5. f, g Hepatocyte markers are significantly downregulated in the R&Zdel vs WT upon CCl4 (f) and PHx (g) damage. f Left, GSEA analysis between hepatocyte signature and CCl4-damaged. Details in Supplementary Data 1_S37. Right, DE genes in R&Zdel vs R&Zflox after chronic CCl4 treatment. Heatmaps present the Top500 (FDR < 10%) ranked by Log2FC and averaged between all mice. g Heatmaps of DE genes upon PHx ranked by Log2FC and p value <0.01 and averaged between all mice (Likelihood ratio test and Benjamini–Hochberg correction). Number, the number of genes. hl Wild-type and R&Zdel adult liver ductal, hepatocyte or hepatoblasts organoids were generated as detailed in “Methods” and grown in expansion media (EM, devoid of WNT3a) or differentiation media (DM, devoid of WNT3a and RSPO1) or treated with Wnt inhibitors (Wnti) or WNT3a media before collection. Note that, for WNT3a, two conditions were used: WNT3a in expansion medium (Wnt3a) and Wnt3a in the absence of CHIR 99021 and RSPO (Wnt3a −CHIR/RSPO). h Experimental design. i Representative pictures of hepatoblast organoids stained for Albumin (magenta). j, k qPCR expression analysis on the indicated genes in R&Zdel vs R&Zflox in differentiated cholangiocyte (left) or hepatoblast (middle) or adult hepatocyte (right) organoids grown in the indicated media (j) or R&Zflox adult hepatocyte organoids treated or not with WNT3A or Wnti. Heatmap represents the fold change values of R&Zdel vs R&Zflox (j) or R&Zflox treated vs untreated (k). Each column is a biological replicate. nd not detected. l Albumin secretion in R&Zflox hepatocyte organoids in WNT3A in the absence of CHIR and RSPO. Data represents mean + /− SEM from n = 2 replicates from n = 3 independent experiments. Paired two-tail t test was used, *p = 0.0135. Source data in Source data file.
Fig. 6
Fig. 6. Liver-specific Rnf43 and Znrf3 (R&Z) deletion leads to early hepatocellular carcinoma after chronic damage.
a Timeline of the experiment. T tamoxifen, C CCl4. b, c Histopathological analysis revealed the presence of early hepatocellular carcinomas. Dashed black lines mark eHCC border. b Representative pictures of six different biological replicates of H&E stainings of tumours and background tissues. N normal tissue, B background tissue, T tumoural tissue. Scale bar, 200 μm (top panel); 100 μm (bottom panel). c Tumours were characterised by increased proliferation (Ki67), vascularisation (CD34), disruption of tissue architecture (Collagen IV, Coll.IV) and stromal invasion (SMA). Representative images of at least four different samples analysed are shown. Scale bars, 100 μm. Dashed black lines mark eHCC border. d Brightfield and H&E staining representative images of tumouroids isolated from an eHCC lesion. Isolation of tumouroids was repeated three times. Scale bar, 500 μm (brightfield) and 50 μm (H&E). e Brightfield pictures of organoids cultured without R-spondin in two independent experiments. Scale bar, 200 μm. f Graph showing selected gene ontology (GO) terms significantly enriched for genes upregulated (red) and downregulated (purple) in R&Zdel compared to R&Zflox. The numbers denote the number of genes associated with each term. The full list of significant terms can be found in Supplementary Data 1_S33–S34. g, h Graphs show normal enrichment score (NES) for selected GSEA data sets significantly enriched (FDR < 25%; p < 0.05). g GSEA of the DE genes in R&Zdel-damaged vs WT-damaged (R&Zflox) at 170 days recovery. The full list can be found in Supplementary Data 1_S42–S43. h GSEA of the DE genes in R&Zdel-damaged livers at 170 days of recovery vs R&Zdel undamaged livers at the same time point post deletion (7M). The full list can be found in Supplementary Data 1_S46–S47. Source data are provided as a Source data file.
Fig. 7
Fig. 7. Human HCC patients mutated in RNF43 and/or ZNRF3 present lipid metabolic alterations and poor prognosis.
ae Clinical data, whole genomic sequencing and RNAseq data were downloaded from ICGC database and used to determine the prognosis and expression pattern of human tumours mutated in RNF43 and/or ZNRF3 or other WNT pathway components (APC, AXIN1 or CTNNB1). Full details in “Methods”, Supplementary Fig. 8 and Supplementary Data 6. a Experimental design. b Survival analysis after Cox proportional hazards model found a significant interaction with gender, tumour stage and WNT mutation status. All covariates passed the proportional hazards test except WNT mutation. The graph shows the survival analysis of HCC patients with ZNRF3 (ZNRF3, left) or RNF43 or ZNRF3 (RorZ, right) mutations compared to patients with no-WNT mutations (No-WNT). p Values obtained by Wald statistic, CI 95%. c, d Differential gene expression for patients with RorZ and R&Z mutations compared to non-WNT mutants (other w/o Wnt mutation). c A multiple regression model indicated an interaction between WNT mutation status and the signatures of RNF43 or ZNRF3 patients. Note that the presence of WNT mutation (WNT + RorZ) negatively impacts the expression of RorZ patients, with gene sets positively enriched in RorZ mutants becoming negatively enriched. d Significantly enriched (p value <0.05, two-sided permutation test) gene sets in R&Z and RorZ-mutated patients compared to patients with no-WNT mutations. e Comparison between the mouse differentially expressed genes including or excluding TCF4 targets and the signatures of patients with mutations in R&Z, RorZ and WNT (APC, CTNNB1 or AXIN1). The table represents the GSEA (NES) of the DE genes in R&Zdel (3 and 7 months homeostasis or 170 days after damage, including or excluding TCF4 targets) against WNT, R&Z or RorZ human liver tumour signatures. NES scores are presented as a heatmap where red is positively enriched and blue is negatively enriched. Note the significant correlation. f Human liver organoids from healthy donors or patients with liver cancer (mixed subtype, CHC and mutations or not in RNF43) were grown and stained for neutral lipids (Bodipy, Green). Representative images from n = 2 independent experiments. Red, F-actin staining. White, Dapi. Scale bar, 60 μm (top panel); 15 μm (bottom panel).

References

    1. Clevers H, Nusse R. Wnt/beta-catenin signaling and disease. Cell. 2012;149:1192–1205. - PubMed
    1. Nusse R, Clevers H. Wnt/beta-catenin signaling, disease, and emerging therapeutic modalities. Cell. 2017;169:985–999. - PubMed
    1. Behrens J, et al. Functional interaction of beta-catenin with the transcription factor LEF-1. Nature. 1996;382:638–642. - PubMed
    1. Molenaar M, et al. XTcf-3 transcription factor mediates beta-catenin-induced axis formation in Xenopus embryos. Cell. 1996;86:391–399. - PubMed
    1. Hu M, et al. Wnt/beta-catenin signaling in murine hepatic transit amplifying progenitor cells. Gastroenterology. 2007;133:1579–1591. - PubMed

Publication types

MeSH terms