. 2022 Jan 17;13(1):342.
doi: 10.1038/s41467-022-28034-z.

Microbiome differential abundance methods produce different results across 38 datasets

Affiliations

Microbiome differential abundance methods produce different results across 38 datasets

Jacob T Nearing et al. Nat Commun. .

Erratum in

Abstract

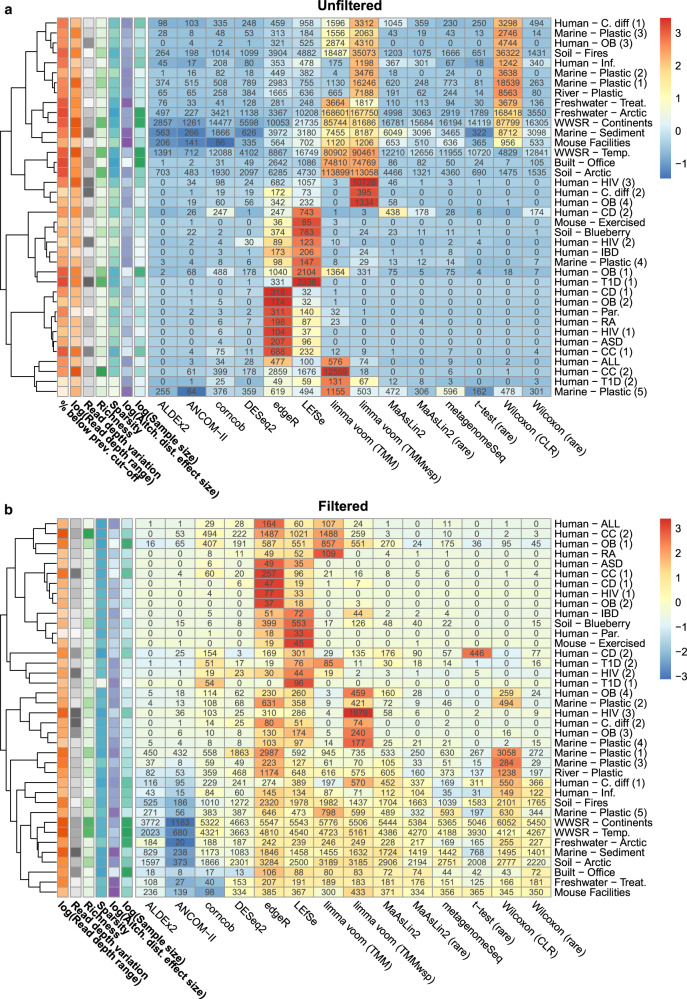
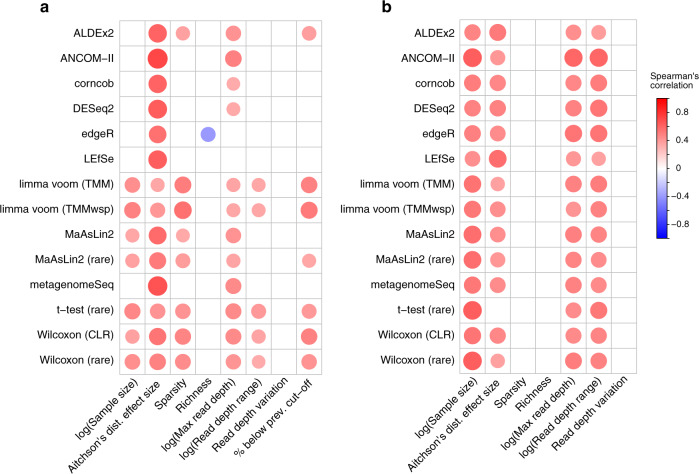
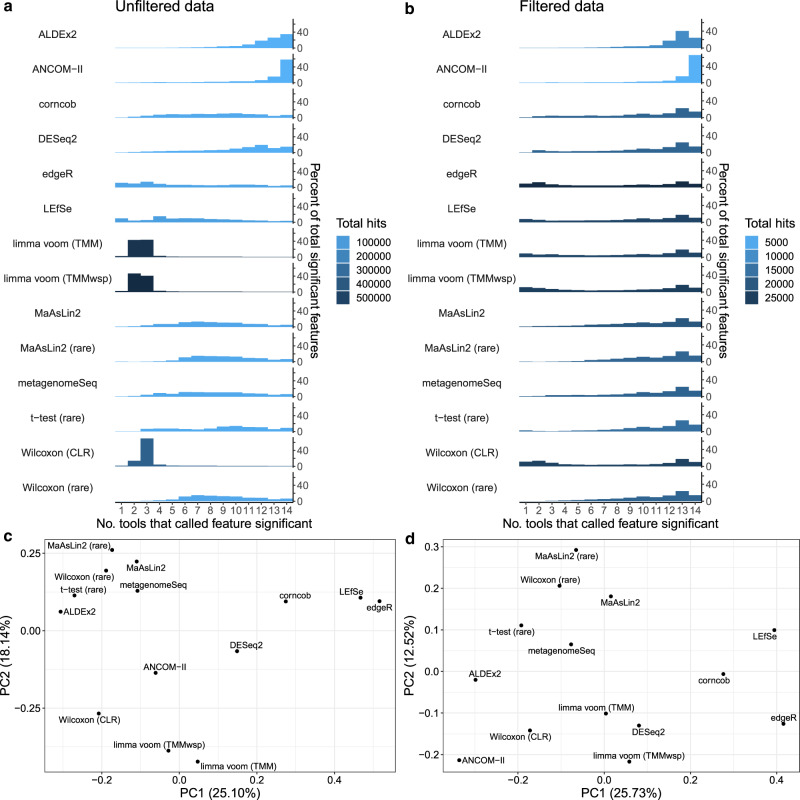
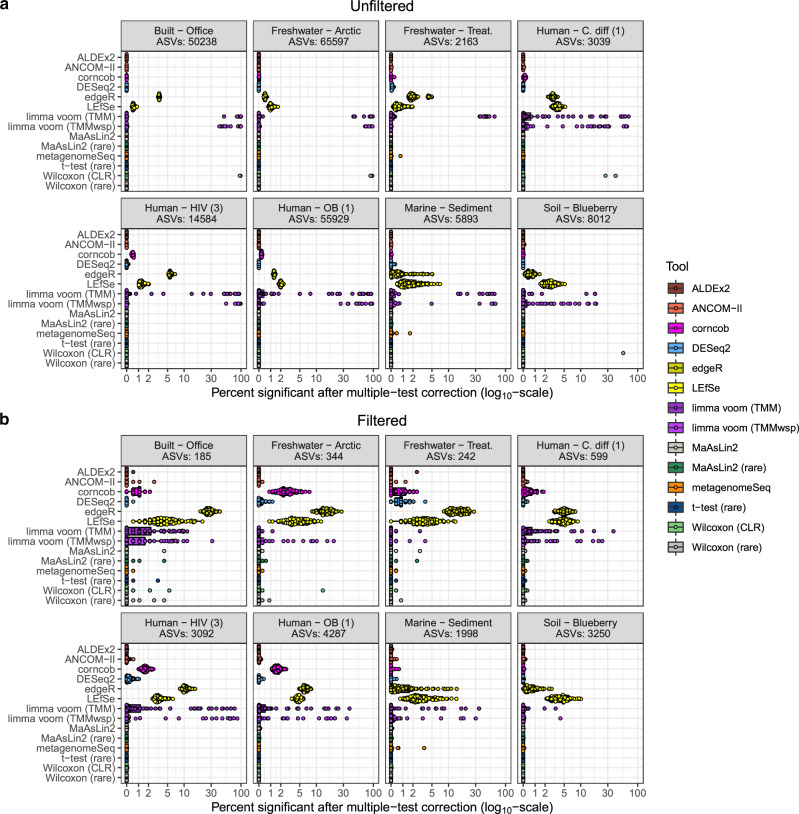
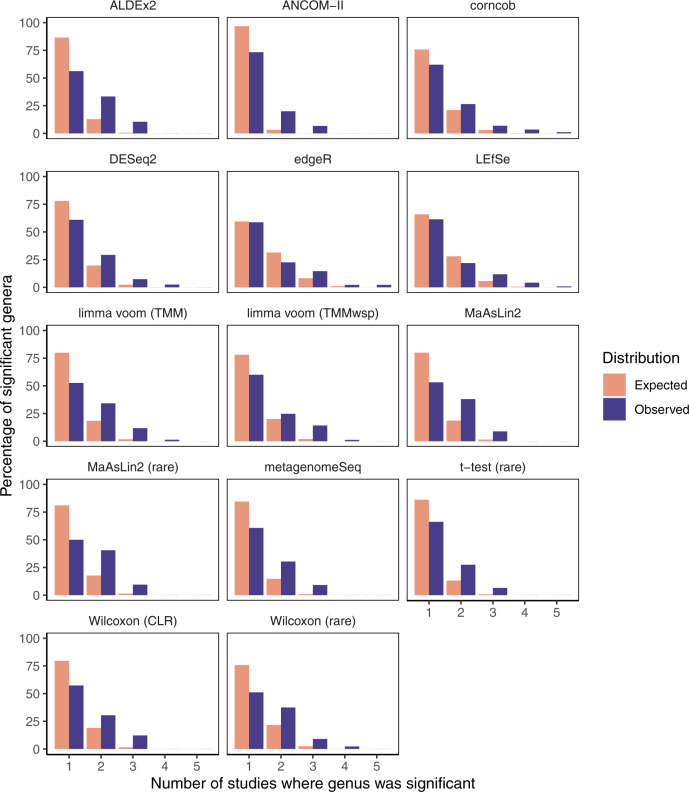
Identifying differentially abundant microbes is a common goal of microbiome studies. Multiple methods are used interchangeably for this purpose in the literature. Yet, there are few large-scale studies systematically exploring the appropriateness of using these tools interchangeably, and the scale and significance of the differences between them. Here, we compare the performance of 14 differential abundance testing methods on 38 16S rRNA gene datasets with two sample groups. We test for differences in amplicon sequence variants and operational taxonomic units (ASVs) between these groups. Our findings confirm that these tools identified drastically different numbers and sets of significant ASVs, and that results depend on data pre-processing. For many tools the number of features identified correlate with aspects of the data, such as sample size, sequencing depth, and effect size of community differences. ALDEx2 and ANCOM-II produce the most consistent results across studies and agree best with the intersect of results from different approaches. Nevertheless, we recommend that researchers should use a consensus approach based on multiple differential abundance methods to help ensure robust biological interpretations.


Conflict of interest statement

The authors declare no competing interests.

Figures

Fig. 1
Fig. 1. Variation in the proportion of significant features depending on the differential abundance method and dataset.
Heatmaps indicate the numbers of significant amplicon sequence variants (ASVs) identified in each dataset by the corresponding tool based on a unfiltered data and b 10% prevalence-filtered data. Cells are colored based on the standardized (scaled and mean centered) percentage of significant ASVs for each dataset. Additional colored cells in the left-most six columns indicate the dataset characteristics we hypothesized could be driving variation in these results (darker colors indicate higher values). Datasets were hierarchically clustered based on Euclidean distances using the complete method. Abbreviations: prev., previous; TMM, trimmed mean of M-values; TMMwsp, trimmed mean of M-values with singleton pairing; rare, rarefied; CLR, center-log-ratio. Source data are provided as a Source Data file.
Fig. 2
Fig. 2. Dataset characteristics associated with percentage of significant amplicon sequence variants.
The correlation coefficients (Spearman’s rho) are displayed by size and color for the a unfiltered and b prevalence-filtered data. These correspond to the dataset characteristics correlated with the percentage of significant amplicon sequence variants identified by that tool per dataset. Only significant correlations before multiple comparison correction (p < 0.05) are displayed. Abbreviations: prev., previous; TMM, trimmed mean of M-values; TMMwsp, trimmed mean of M-values with singleton pairing; rare, rarefied; CLR, center-log-ratio. Source data are provided as a Source Data file.
Fig. 3
Fig. 3. Overlap of significant features across tools and tool clustering.
a, b The number of tools that called each feature significant, stratified by features called by each individual tool for the a unfiltered and b 10% prevalence-filtered data. Results are shown as a percentage of all ASVs identified by each tool. The total number of significant features identified by each tool is indicated by the bar colors. For example, based on the unfiltered data these bars indicate that almost 40% of significant ASVs identified by ALDEx2 were shared across all other tools, while ALDEx2 did not identify any significant ASVs shared by fewer than eight tools. Note that when interpreting these results that they are dependent on which methods were included, and whether they are represented multiple times. For instance, two different workflows for running MaAslin2 are included, which produced similar outputs. c, d Plots are displayed for the first two principal coordinates (PCs) for both c non-prevalence-filtered and d 10% prevalence-filtered data. These plots are based on the mean inter-tool Jaccard distance across the 38 main datasets that we analyzed, computed by averaging over the inter-tool distance matrices for all individual datasets to weight each dataset equally. Abbreviations: TMM, trimmed mean of M-values; TMMwsp, trimmed mean of M-values with singleton pairing; rare, rarefied; CLR, center-log-ratio. Source data are provided as a Source Data file.
Fig. 4
Fig. 4. Distribution of false discovery rate simulation replicates for both unfiltered and filtered data.
The percentage of amplicon sequence variants that are significant after performing Benjamini–Hochberg correction of the p-values (using a cut-off of 0.05) are shown for each separate dataset and tool. Interquartile range (IQR) of boxplots represent the 25th and 75th percentiles while maxima and minima represent the maximum and minimum values outside 1.5 times the IQR. Notch in the middle of the boxplot represent the median. Note that the x-axis is on a pseudo-log10 scale. a Represents unfiltered datasets while b represents datasets filtered using a 10% prevalence requirement for each ASV. Datasets and tools were run 100 times while randomly assigning samples from the same environment and original groupings to one of two new randomly selected groupings. Differential abundance analysis was then performed on the two random groupings. Note that in the unfiltered datasets 100 replicates was only run 3 of the 8 datasets (Freshwater—Arctic, Soil—Blueberry, Human—OB (1)) with 100 ALDEx2 replications also being run in the Human - HIV (3) dataset. All other unfiltered datasets were run with 10 replicates due to computational limitations. Abbreviations: TMM, trimmed mean of M-values; TMMwsp, trimmed mean of M-values with singleton pairing; rare, rarefied; CLR, center-log-ratio. Source data are provided as a Source Data file.
Fig. 5
Fig. 5. Observed consistency of significant genera across diarrhea datasets is higher than the random expectation overall.
These barplots illustrate the distributions of the number of studies for which each genus was identified as significant (excluding genera never found to be significant). The random expectation distribution is based on replicates of randomly selecting genera as significant and then computing the consistency across studies. Abbreviations: TMM, trimmed mean of M-values; TMMwsp, trimmed mean of M-values with singleton pairing; rare, rarefied; CLR, center-log-ratio. Source data are provided as a Source Data file.

References

    1. Pollock J, Glendinning L, Wisedchanwet T, Watson M. The madness of microbiome: attempting to find consensus “Best Practice” for 16S microbiome studies. Appl. Environ. Microbiol. 2018;84:e02627–17. - PMC - PubMed
    1. Allaband C, et al. Microbiome 101: studying, analyzing, and interpreting gut microbiome data for clinicians. Clin. Gastroenterol. Hepatol. 2019;17:218–230. - PMC - PubMed
    1. Weiss S, et al. Normalization and microbial differential abundance strategies depend upon data characteristics. Microbiome. 2017;5:27. - PMC - PubMed
    1. McMurdie PJ, Holmes S. Waste not, want not: why rarefying microbiome data is inadmissible. PLoS Comput. Biol. 2014;10:e1003531. - PMC - PubMed
    1. Segata N, et al. Metagenomic biomarker discovery and explanation. Genome Biol. 2011;12:R60. - PMC - PubMed

Publication types