Comparative Study
. 2022 Jan 17;5(1):58.
doi: 10.1038/s42003-022-03002-x.

Heterogeneous digital biomarker integration out-performs patient self-reports in predicting Parkinson's disease

Affiliations
Comparative Study

Heterogeneous digital biomarker integration out-performs patient self-reports in predicting Parkinson's disease

Kaiwen Deng et al. Commun Biol. .

Abstract

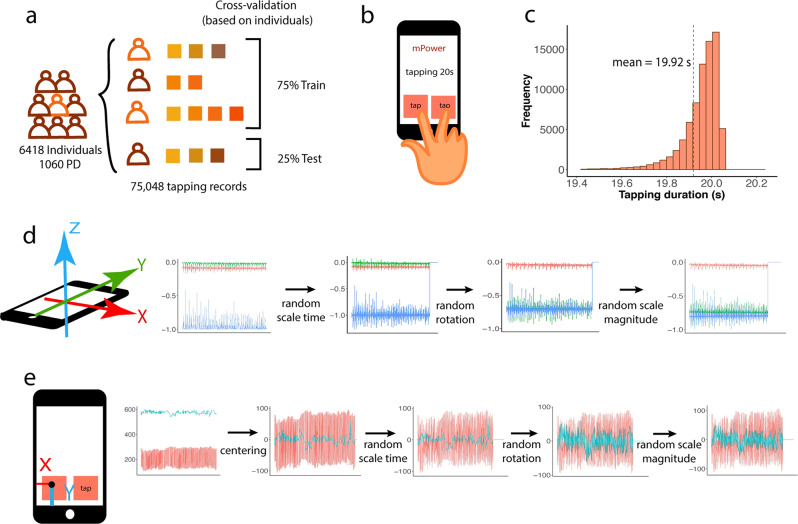
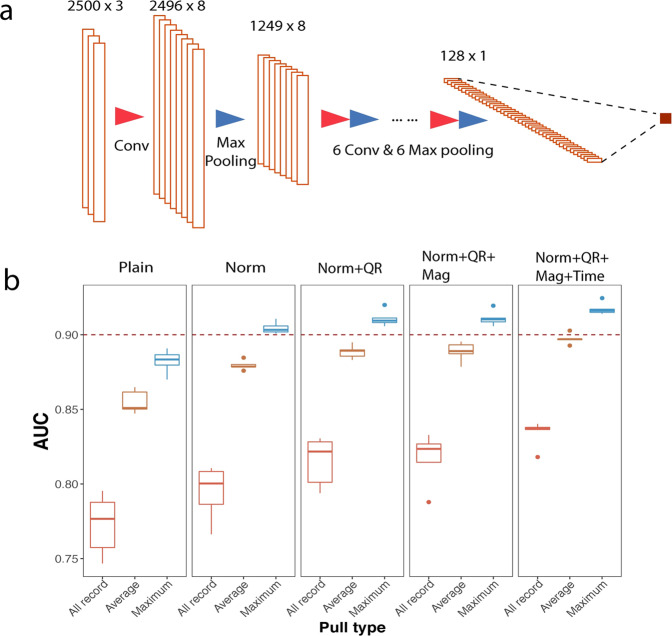
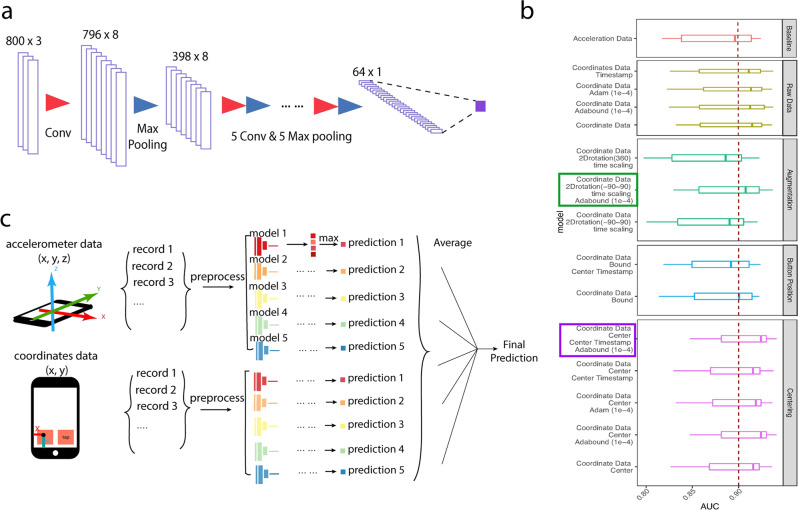
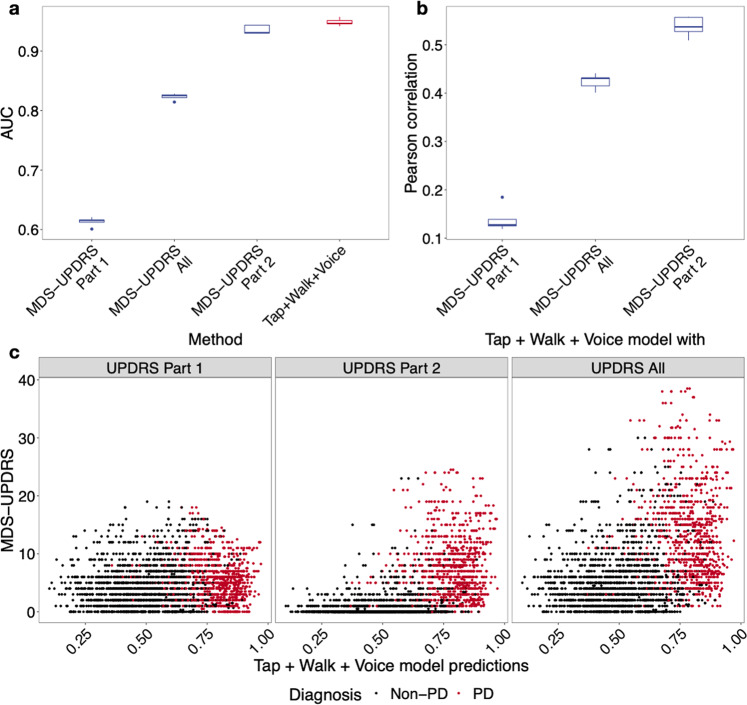
Parkinson's disease (PD) is one of the first diseases where digital biomarkers demonstrated excellent performance in differentiating disease from healthy individuals. However, no study has systematically compared and leveraged multiple types of digital biomarkers to predict PD. Particularly, machine learning works on the fine-motor skills of PD are limited. Here, we developed deep learning methods that achieved an AUC (Area Under the receiver operator characteristic Curve) of 0.933 in identifying PD patients on 6418 individuals using 75048 tapping accelerometer and position records. Performance of tapping is superior to gait/rest and voice-based models obtained from the same benchmark population. Assembling the three models achieved a higher AUC of 0.944. Notably, the models not only correlated strongly to, but also performed better than patient self-reported symptom scores in diagnosing PD. This study demonstrates the complementary predictive power of tapping, gait/rest and voice data and establishes integrative deep learning-based models for identifying PD.


Conflict of interest statement

The authors declare the following competing interests: J.W. is a current Eli Lilly and Company employee. Y.G. serves as the scientific advisor for Eli Lilly and Company on the tapping part of this study. R.L.A. serves on the DSMBs for the COMPASS and PASSPORT trials (Biogen), the M-STAR trial (Biohaven), and the Signal-AD trial (Vaccinex). R.L.A. has received consulting fees from the Michael J. Fox Foundation and Takeda. The remaining authors declare no competing interests.

Figures

Fig. 1
Fig. 1. Summary of tapping data and preprocessing techniques.
a Training and test data are separated by individuals to avoid contamination. b Participants were asked to tap successively in turns on the screen of the phone for 20 s. Machine learning models are trained for accelerometer and coordinate data separately. c Distribution of the length of the records (d, e) demonstrate the preprocessing and augmentation techniques for raw accelerometer and coordinate data. Normalization/centering, random time scaling, rotation, and magnitude scaling were applied in a sequential order. At the last step, magnitude scaling was applied to each channel of the accelerometer and coordinated data.
Fig. 2
Fig. 2. Augmentation and normalization improve the performance of the tapping accelerometer model.
a represents the model structure for the accelerometer data tapping model with seven convolutional layers, seven max-pooling layers, and 1 fully connected layer. b “Plain Model” represents the model using raw data without augmentation or normalization. “Norm” represents the model with Z-score normalization. “Quaternion Rotation” (QR), “Magnitude”, and “Time” denote the three types of augmentation methods. The data were pre-processed in sequential order of the methods shown above the plot. “All record” indicates the performance evaluated on the record level; “Average” and “Maximum” represent the individual level performance by using the average or the maximum prediction of all records of the same individual. The models with normalization and all augmentation methods showed the top performance.
Fig. 3
Fig. 3. Model design for tapping coordinate data.
a depicts the model structure for the coordinate data tapping model (inputs: x, y coordinates and timestamp). The model contains six convolutional layers, six max-pooling layers, and one fully connected layer. b Experiments were designed to search for the optimal data processing methods and network hyperparameters, including the normalization strategy on the coordinates and the timestamps, augmentations with 2D-rotation and time scale, and the network optimizer. Best performing models by augmentation and centering groups are enclosed in squares. c A combined model is generated by averaging the prediction scores from accelerometer and from coordinates.
Fig. 4
Fig. 4. Combining tapping, voice and gait/rest data improves performance in diagnosing PD.
a A total of 2729 individuals (645 PD) who had all three types of data were split into the same cross-validation folds and to train gait/rest, voice, and tapping models. The models are combined together by averaging the prediction scores from each model. b Assembling accelerometer and coordinate tapping data models exceeds the performance of either single model. (c) and (d) depict the comparison among gait/rest, voice, tapping, and assembled models. The combined model achieves the best performance.
Fig. 5
Fig. 5. Performance comparison of different demographic groups.
ac Performances in AUC and the predictions in different groups of data, separated by gender, smoking and age. df Distribution of prediction scores of Non-PD and PD for different gender, smoking, and age groups.
Fig. 6
Fig. 6. Correlation with patient self-reports.
a AUCs of evaluating self-reported MDS-UPDRS against diagnosis and deep learning models against diagnosis. b Pearson correlations between self-reported MDS-UPDRS scores and deep learning-based predictions. c Visualization of the relationship between the MDS-UPDRS and the prediction values.

References

    1. Postuma RB, et al. MDS clinical diagnostic criteria for Parkinson’s disease. Mov. Disord. 2015;30:1591–1601. doi: 10.1002/mds.26424. - DOI - PubMed
    1. Bot BM, et al. The mPower study, Parkinson disease mobile data collected using ResearchKit. Sci. Data. 2016;3:160011. doi: 10.1038/sdata.2016.11. - DOI - PMC - PubMed
    1. Trister AD, Dorsey ER, Friend SH. Smartphones as new tools in the management and understanding of Parkinson’s disease. NPJ Parkinson’s Dis. 2016;2:16006. doi: 10.1038/npjparkd.2016.6. - DOI - PMC - PubMed
    1. Mei J, Desrosiers C, Frasnelli J. Machine learning for the diagnosis of Parkinson’s disease: a review of literature. Front. Aging Neurosci. 2021;13:633752. doi: 10.3389/fnagi.2021.633752. - DOI - PMC - PubMed
    1. Frank, A. & Asuncion, A. UCI Machine Learning Repository (University of California, 2010).

Publication types