. 2022 Jan 18:11:e72072.
doi: 10.7554/eLife.72072.

Genetic basis and dual adaptive role of floral pigmentation in sunflowers

Affiliations

Genetic basis and dual adaptive role of floral pigmentation in sunflowers

Marco Todesco et al. Elife. .

Abstract

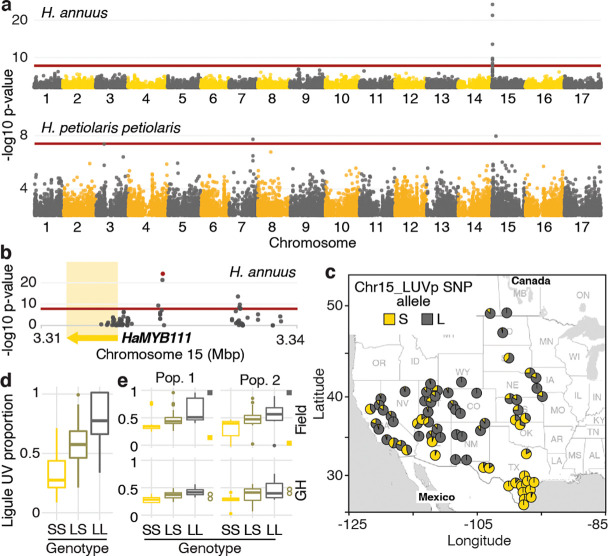
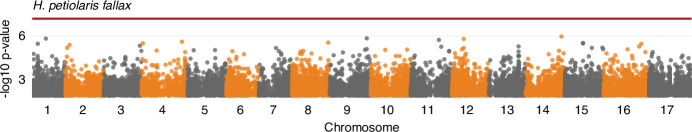
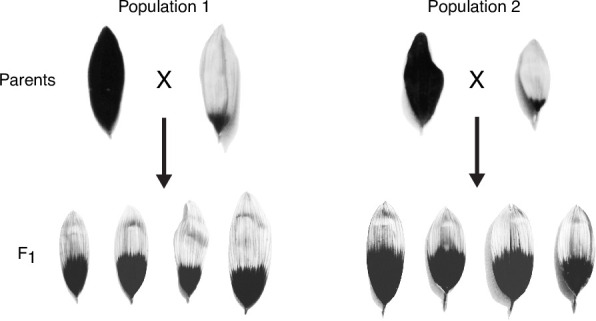
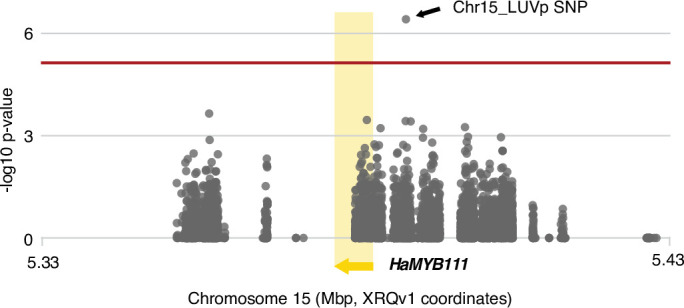
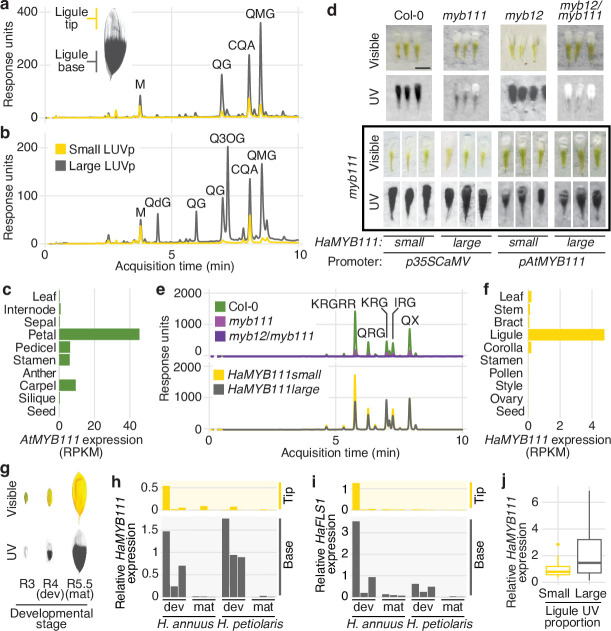
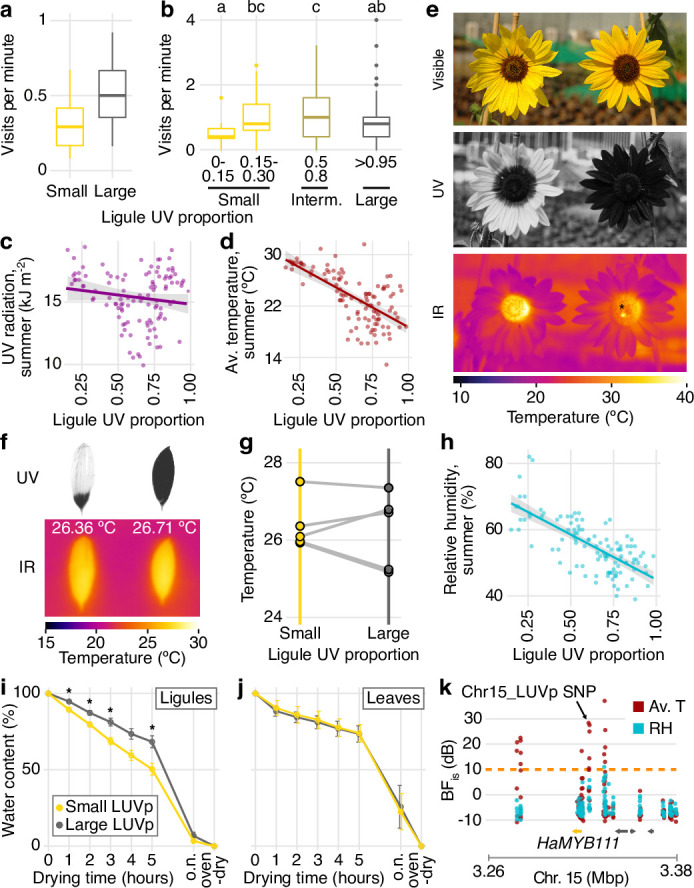
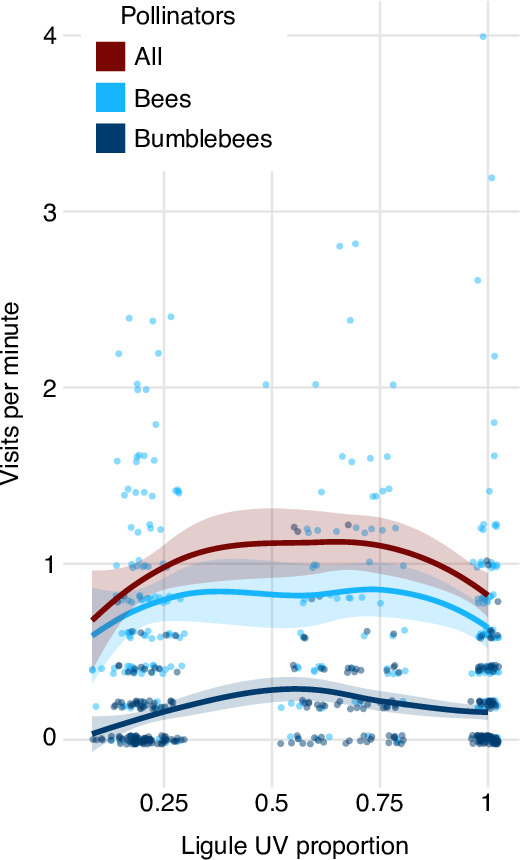
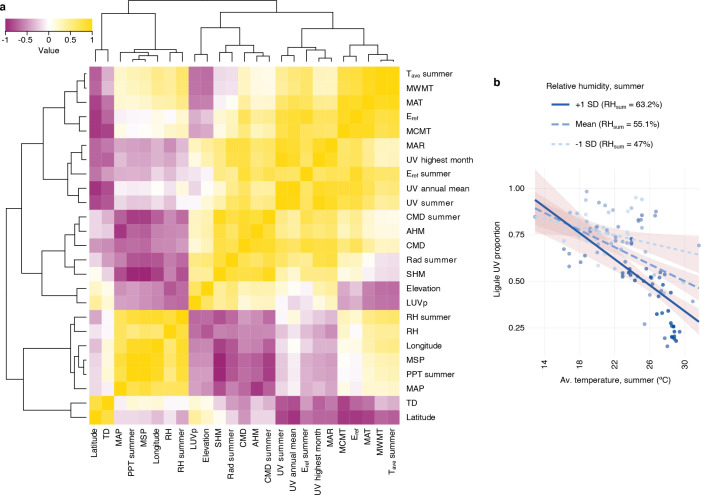
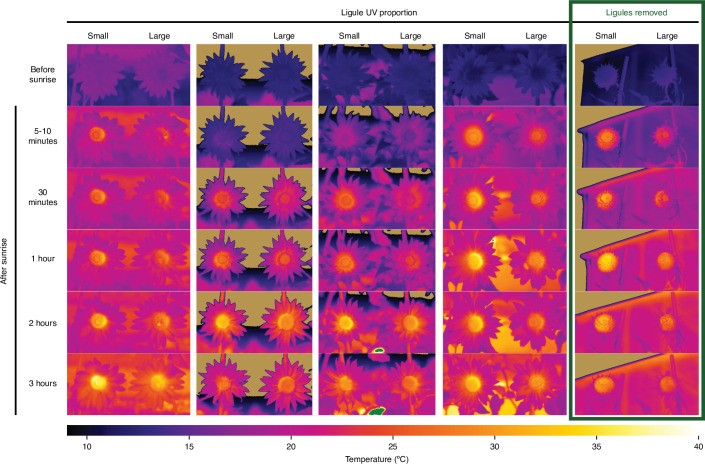
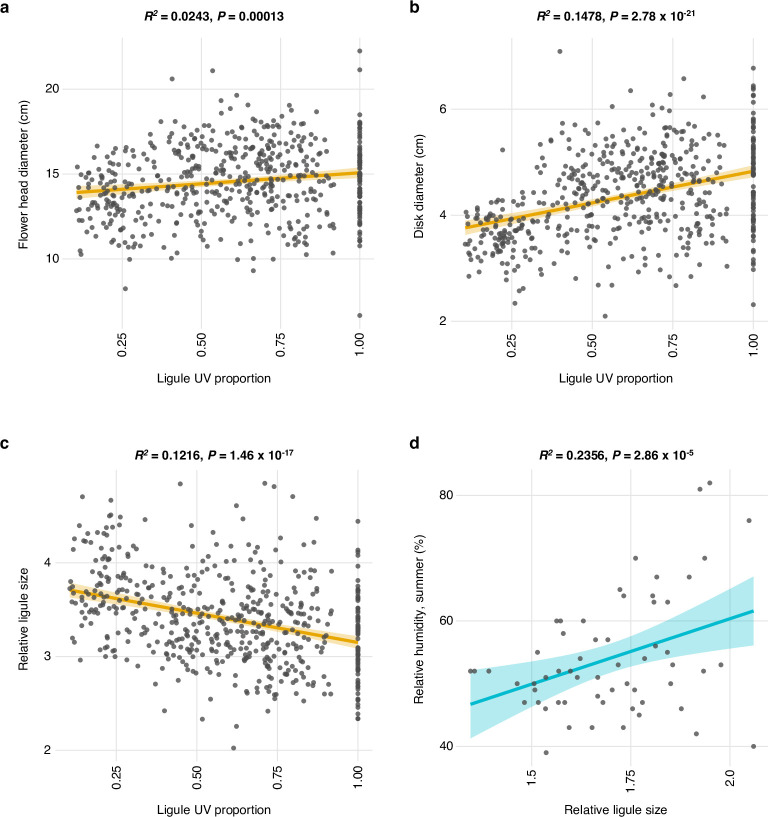
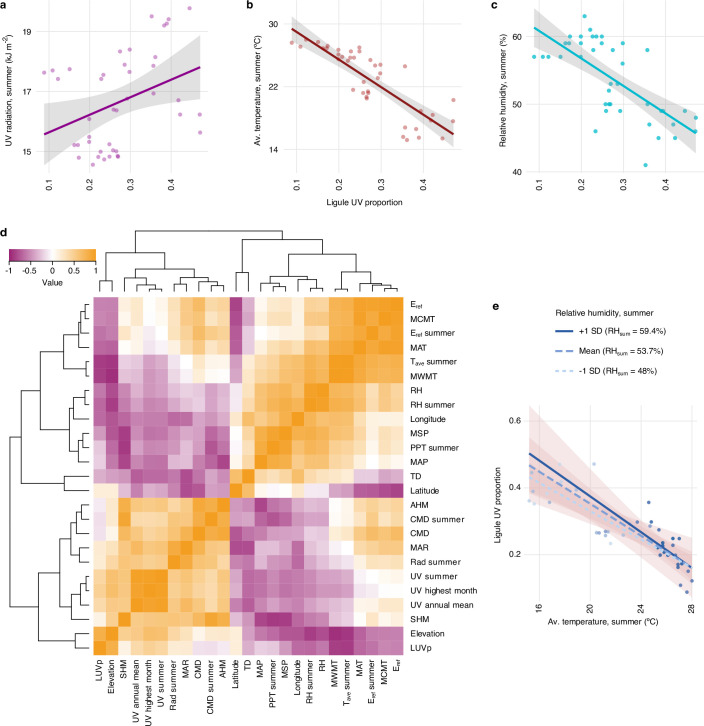
Variation in floral displays, both between and within species, has been long known to be shaped by the mutualistic interactions that plants establish with their pollinators. However, increasing evidence suggests that abiotic selection pressures influence floral diversity as well. Here, we analyse the genetic and environmental factors that underlie patterns of floral pigmentation in wild sunflowers. While sunflower inflorescences appear invariably yellow to the human eye, they display extreme diversity for patterns of ultraviolet pigmentation, which are visible to most pollinators. We show that this diversity is largely controlled by cis-regulatory variation affecting a single MYB transcription factor, HaMYB111, through accumulation of ultraviolet (UV)-absorbing flavonol glycosides in ligules (the 'petals' of sunflower inflorescences). Different patterns of ultraviolet pigments in flowers are strongly correlated with pollinator preferences. Furthermore, variation for floral ultraviolet patterns is associated with environmental variables, especially relative humidity, across populations of wild sunflowers. Ligules with larger ultraviolet patterns, which are found in drier environments, show increased resistance to desiccation, suggesting a role in reducing water loss. The dual role of floral UV patterns in pollinator attraction and abiotic response reveals the complex adaptive balance underlying the evolution of floral traits.

Keywords: abiotic stress; adaptation; evolutionary biology; floral pigmentation; genetics; genomics; pollination; sunflower; sunflower (helianthus annuus); transcription factors.

Plain language summary

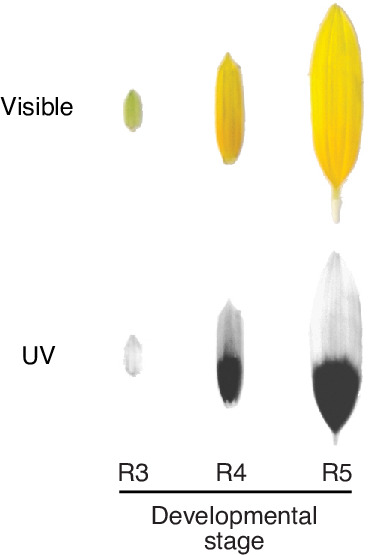
Flowers are an important part of how many plants reproduce. Their distinctive colours, shapes and patterns attract specific pollinators, but they can also help to protect the plant from predators and environmental stresses. Many flowers contain pigments that absorb ultraviolet (UV) light to display distinct UV patterns – although invisible to the human eye, most pollinators are able to see them. For example, when seen in UV, sunflowers feature a ‘bullseye’ with a dark centre surrounded by a reflective outer ring. The sizes and thicknesses of these rings vary a lot within and between flower species, and so far, it has been unclear what causes this variation and how it affects the plants. To find out more, Todesco et al. studied the UV patterns in various wild sunflowers across North America by considering the ecology and molecular biology of different plants. This revealed great variation between the UV patterns of the different sunflower populations. Moreover, Todesco et al. found that a gene called HaMYB111 is responsible for the diverse UV patterns in the sunflowers. This gene controls how plants make chemicals called flavonols that absorb UV light. Flavonols also help to protect plants from damage caused by droughts and extreme temperatures. Todesco et al. showed that plants with larger bullseyes had more flavonols, attracted more pollinators, and were better at conserving water. Accordingly, these plants were found in drier locations. This study suggests that, at least in sunflowers, UV patterns help both to attract pollinators and to control water loss. These insights could help to improve pollination – and consequently yield – in cultivated plants, and to develop plants with better resistance to extreme weather. This work also highlights the importance of combining biology on small and large scales to understand complex processes, such as adaptation and evolution.


Conflict of interest statement

MT, NB, AK, II, GO, ÓD, SH, LM, MJ, JL, BB, LR No competing interests declared

Figures

Figure 1.
Figure 1.. Diversity for floral ultraviolet (UV) pigmentation patterns in wild sunflowers.
(a) Geographical distribution of sampled populations for H. annuus and (b) H. petiolaris. Yellow/orange dots represent different populations, overlaid grey dot size is proportional to the population mean ligule ultraviolet proportion (LUVp). (c) Range of variation for floral UV pigmentation patterns in the two species. Scale bar = 2 cm. (d) LUVp values distribution for H. annuus and (e) H. petiolaris subspecies.
Figure 1—figure supplement 1.
Figure 1—figure supplement 1.. Floral ultraviolet (UV) patterns in wild sunflower species and cultivated sunflower.
(a) Visible and UV images of inflorescences from five wild sunflower species, and ligules of six cultivated sunflower lines. Variation in floral UV patterns was found within all these species. Scale bar = 1 cm. (b) UV images of inflorescences from 16 wild sunflower (sub-)species and for the outgroup Phoebanthus tenuifolius. Images are not to scale. (c) Species tree for 31 annual and perennial sunflower species and P. tenuifolius, adapted from Figure 1 Stephens et al., 2015. The size of the black dot to the right of each species name is proportional to the average size of bullseye patterns measured for that species or subspecies (Figure 1—source data 1). For the species in (a), excluding H. anomalus, bullseye values are averages for ≥42 individuals (see also Figure 1—figure supplement 3). For H. anomalusthe species in (b), bullseye values are for single individuals or averages for up to three individuals. Two taxa in the original species tree, H. petiolaris and H. neglectus, were renamed to H. petiolaris ssp. petiolaris and H. petiolaris ssp. fallax to reflect the current understanding of their identities.
Figure 1—figure supplement 2.
Figure 1—figure supplement 2.. Partial ultraviolet (UV) absorbance in the distal part of ligules in H. annuus.
(a) The distal part of ligules displays partial levels of UV absorbance in ~46% of H. annuus individuals (excluding individuals that have completely UV-absorbing ligules). Scale bar = 1 cm. (b) Partial UV absorbance in the distal part of ligules is more common in individuals with larger (unmodified) ligule ultraviolet proportion (LUVp). Difference is significant for p=1.72 × 10–117 (Mann–Whitney U-tests, W = 401818, two-sided; completely UV-reflecting: n = 760 individuals; partially UV-absorbing: n = 614 individuals). Boxplots show the median, box edges represent the 25th and 75th percentiles, whiskers represent the maximum/minimum data points within 1.5× interquartile range outside box edges. The presence of this partial UV absorbance was incorporated in the LUVp values used for genome-wide association studies (GWAS) (see ‘Ultraviolet and infrared photography’); while this improved the strength of the association with the Chr15_LUVp SNP in GWAS (from p=8.52e–19 to p=5.81e–25), it did not change the overall pattern. Similarly, ignoring UV absorbance in the tip of ligules had only a minor effect on the average LUVp values for genotypic classes at the Chr15_LUVp SNP (Figure 1—source data 2).
Figure 1—figure supplement 3.
Figure 1—figure supplement 3.. Ligule ultraviolet proportion (LUVp) variation in wild sunflower species and cultivated sunflower.
LUVp values for individuals of four wild sunflower species and of the cultivated sunflower association mapping (SAM) population, and allele frequencies at the Chr15_LUVp SNP. ANN, wild H. annuus (n = 1589 from 110 populations); PET, H. petiolaris (n = 351 individuals from 40 populations); ARG, H. argophyllus (n = 105 individuals from 27 populations); NIV, H. niveus (n = 42 individuals from nine populations); SAM, cultivated H. annuus (n = 275 individuals). Letters identify groups that are significantly different for p<0.001 (one-way ANOVA with post-hoc Tukey HSD test, F = 247, df = 4). Exact p-values for pairwise comparisons are reported in Figure 1—source data 2.
Figure 2.
Figure 2.. A single locus explains most of the variation in floral ultraviolet (UV) patterning in H. annuus.
(a) Ligule ultraviolet proportion (LUVp) genome-wide association studies (GWAS). (b) Zoomed-in Manhattan plot for the chromosome 15 LUVp peak in H. annuus. Red lines represent 5% Bonferroni-corrected significance. GWAS were calculated using two-sided mixed models. Number of individuals: n = 563 individuals (H. annuus); n = 159 individuals (H. petiolaris petiolaris). Only positions with -log10 p-value >2 are plotted. HaMYB111 is the only annotated feature in the genomic interval shown in Figure 1b; the single-nucleotide polymorphism (SNP) with the strongest association to LUVp (Chr15_LUVp SNP) is highlighted in red. Linkage disequilibrium (LD) decays rapidly in wild H. annuus (average R2 at 10 kbp is ~0.035; Todesco et al., 2020), and all SNPs significantly associated with LUVp in H. annuus are included in the depicted region. The chromosome 15 association in H. petiolaris petiolaris is distinct from the one in H. annuus as it is located ~20 Mbp downstream of HaMYB111. (c) Geographical distribution of Chr15_LUVp SNP allele frequencies in H. annuus. L, large; S, small allele. (d) LUVp associated with different genotypes at Chr15_LUVp SNP in natural populations of H. annuus grown in a common garden. All pairwise comparisons are significant for p<10–16 (one-way ANOVA with post-hoc Tukey HSD test, F = 438, df = 2; n = 563 individuals). LUVp values for the individuals in the GWAS populations and genotype data for Chr15_LUVp SNP are reported in Figure 1—source data 2. (e) LUVp associated with different genotypes at Chr15_LUVp SNP in H. annuus F2 populations grown in the field or in a greenhouse (GH). Measurements for the parental generations are shown: squares, grandparents (field-grown); empty circles, F1 parents (GH-grown; Figure 2—figure supplement 2). Boxplots show the median, box edges represent the 25th and 75th percentiles, whiskers represent the maximum/minimum data points within 1.5× interquartile range outside box edges. Differences between genotypic groups are significant for p=0.0057 (Pop. 1 Field, one-way ANOVA, F = 5.73, df = 2; n = 54 individuals); p=0.0021 (Pop. 2 Field, one-way ANOVA, F = 7.02, df = 2; n = 50 individuals); p=0.00015 (Pop. 1 GH, one-way ANOVA, F = 11.13, df = 2; n = 42 individuals); p=0.054 (Pop. 2 GH, one-way ANOVA, F = 3.17, df = 2; n = 38 individuals). p-Values for pairwise comparisons for panels (d) and (e) are reported in Figure 2—source data 1.
Figure 2—figure supplement 1.
Figure 2—figure supplement 1.. Ligule ultraviolet proportion (LUVp) genome-wide association study (GWAS) in H. petiolaris fallax (n = 193 individuals).
The red line represents 5% Bonferroni-corrected significance. GWAS were calculated using two-sided mixed models. Only positions with -log10 p-value >2 are plotted.
Figure 2—figure supplement 2.
Figure 2—figure supplement 2.. Floral ultraviolet (UV) patterns in the parental lines of F2 populations.
UV images of ligules of the parental lines for the F2 populations shown in Figure 2e and their F1 progeny. A pair of F1 plants was selected and crossed for each population to generate the F2 progeny.
Figure 2—figure supplement 3.
Figure 2—figure supplement 3.. Ligule ultraviolet proportion (LUVp) genome-wide association study (GWAS) in unfiltered H. annuus datasets.
LUVp GWAS in H. annuus using an unfiltered variants dataset in a 100 kbp region surrounding HaMYB111 (n = 563 individuals). Relaxing variant filtering parameters, to capture more of the polymorphisms at the HaMYB111 locus, resulted in an almost 50-fold increase in the number of variants in this region, from 142 to 6949. Regions in which no single-nucleotide polymorphisms (SNPs) are reported contain highly repetitive sequences and were masked before read mapping. As remapping to the improved HA412v2 reference assembly of the complete H. annuus set of >222M unfiltered variants would have been computationally intensive, positions are shown based on the original XRQv1 reference assembly. The red line represents 5% Bonferroni-corrected significance. GWAS were calculated using two-sided mixed models.
Figure 3.
Figure 3.. MYB111 is associated with floral ultraviolet (UV) pigmentation patterns and flavonol accumulation in sunflower and Arabidopsis.
(a) UV chromatograms (350 nm) for methanolic extracts of the upper and lower third of ligules with intermediate UV patterns, and (b) of ligules with large and small floral UV patterns. Peak areas are proportional to the total amount of absorbance at 350 nm explained by the corresponding compounds in the extracts. Relevant peaks are labelled: M, myricetin; QG, quercetin glucoside; QdG, quercetin diglucoside; Q3OG, quercetin-3-O-glucoside (co-elutes with quercetin-glucoronide); QMG, quercetin malonyl-glucoside; CQA, di-O-caffeoyl quinic acid (Figure 3—source data 1). (c) Expression levels of AtMYB111 in Arabidopsis. RNAseq data were obtained from Klepikova et al., 2016. RPKM, reads per kilobase of transcript per million mapped reads. (d) Arabidopsis petals. HaMYB111 from H. annuus plants with small or large ligule ultraviolet proportion (LUVp) was introduced into the Arabidopsis myb111 mutant under the control of a constitutive promoter (p35ScaMV) or of the promoter of the Arabidopsis homolog (pAtMYB111). Scale bar = 1 mm. (e) UV chromatograms (350 nm) for methanolic extracts of petals of Arabidopsis lines. Upper panel: wild-type Col-0 and mutants. Bottom panel: p35ScaMV::HaMYB111 lines in myb111 background. Relevant peaks are labelled: KRGRR, kaempferol-rhamnoside-glucoside-rhamnoside-rhamnoside; QGR, quercetin-rhamnoside-glucoside; KRG, kaempferol-rhamnoside-glucoside; IRG, isorhamnetin-rhamnoside-glucoside; QX, quercetin-xyloside. (Figure 3—source data 1). (f) Expression levels of HaMYB111 in the XRQ line of cultivated sunflower. RNAseq data were obtained from Badouin et al., 2017. (g) Pigmentation patterns in ligules of wild H. annuus at different developmental stages: R3, closed inflorescence bud; R4, inflorescence bud opening; R5, inflorescence fully opened. (h) Expression levels in the UV-absorbing base (grey) and UV-reflecting tip (yellow) of mature (mat; collected from inflorescences at R5 stage) and developing (dev; collected from inflorescences at R4 stage) ligules for HaMYB111 and (i) HaFLS1, one of its putative targets. One representative individual with intermediate LUVp values was chosen for each species. Each bar represents average expression over three technical replicates for a biological replicate (different inflorescence from the same individual). For each gene, expression data are normalized to the average expression levels in the base of developing ligules of H. annuus. (j) HaMYB111 expression levels in ligules of field-grown wild H. annuus with contrasting floral UV pigmentation patterns. Expression data are normalized to the average expression levels across all the samples. The difference between the two groups is significant for p=0.009 (Welch t-test, t = 2.81, df = 27.32, two-sided; n = 24 individuals for the large LUVp group; n = 22 individuals for the small LUVp group). Similar correlations are observed when HaMYB111 expression levels are compared to individuals’ LUVp values or their genotype at the Chr15_LUVp SNP (see Figure 3—source data 2). Boxplots show the median, box edges represent the 25th and 75th percentiles, whiskers represent the maximum/minimum data points within 1.5× interquartile range outside box edges.
Figure 3—figure supplement 1.
Figure 3—figure supplement 1.. Stages of ligule development in H. petiolaris.
Figure 3—figure supplement 2.
Figure 3—figure supplement 2.. Coding sequence alignment for HaMYB111.
Representation of a sequence alignment for coding sequences of HaMYB111 alleles from 15 H. annuus individuals from the genome-wide association study (GWAS) panel and of the two HaMYB111 alleles used to complement the Arabidopsis myb111 mutant (Figure 3d) compared to the cultivated sunflower reference XRQ, in light blue (Badouin et al., 2017). Alleles from sunflower lines with large ultraviolet (UV) patterns and carrying the L allele at the Chr15_LUVp single-nucleotide polymorphism (SNP) are highlighted in grey; alleles from lines with small UV patterns and carrying the S allele at the Chr15_LUVp SNP are highlighted in yellow. Letters ‘a’ or ‘b’ at the end of the sample name identify alleles from a same individual. Polymorphisms compared to the reference XRQ sequence are highlighted: SNPs (green); deletions (orange); insertions (blue). Extensive sequence and structural variation across H. annuus individuals was found in intron regions as well as in the putative promoter region of HaMYB111. While the vast majority of the polymorphisms in introns or in the proximal promoter region (from the Chr15_LUVp SNP to the transcription start) did not appear to correlate with ligule ultraviolet proportion (LUVp) values or with genotypes at the Chr15_LUVp SNP, several large polymorphisms associated with both were found in the distal promoter region, upstream of the Chr15_LUVp SNP. However, the distal promoter region could be amplified and sequenced in its entirety only from a subset of sunflower lines carrying the L allele at Chr15_LUVp SNP, precluding a conclusive determination of a link between this sequence variation and functional diversity between alleles of HaMYB111. Additionally, given that the promoter region had to be split in two large regions (proximal and distal), with limited overlap, to be amplified before Sanger sequencing, we cannot exclude the presence of more complex rearrangements in the region. Alignments for HaMYB111 coding and genomic sequences, and for the proximal and distal promoter regions, are provided as Supplementary files 1-4.
Figure 4.
Figure 4.. Accumulation of ultraviolet (UV) pigments in flowers affects pollinator visits and transpiration rates.
(a) Rates of pollinator visitation measured in Vancouver in 2017 (p=0.017; Mann–Whitney U-tests, W = 150, two-sided; n = 143 pollinator visits) and (b) 2019 (differences between ligule ultraviolet proportion [LUVp] categories are significant for p=0.0058, Kruskal–Wallis test, χ2 = 14.54, df = 4; n = 1390 pollinator visits). Letters identify groups that are significantly different for p<0.05 in pairwise comparisons, Wilcoxon rank sum test. Exact p-values are reported in Figure 4—source data 1–4. Boxplots show the median, box edges represent the 25th and 75th percentiles, whiskers represent the maximum/minimum data points within 1.5× interquartile range outside box edges. (c) Correlation between average LUVp for different populations of H. annuus and summer UV radiation (R2 = 0.01, p=0.12, n = 110 populations) or (d) summer average temperature (R2 = 0.44, p=2.4 × 10⁻¹⁵, n = 110 populations). Grey areas represent 95% confidence intervals. (e) Sunflower inflorescences pictured in the visible, UV, and infrared (IR) range. In the IR picture, a bumblebee is visible in the inflorescence with large LUVp (right; the warmer abdomen of the bee is visible as a bright yellow spot under the asterisk). The higher temperature in the centre (disc) of the inflorescence with small LUVp does not depend on ligule UV patterns (Figure 4—figure supplement 3). These inflorescences belong to two of the plants that were used for the pollination preference experiments reported in (a) and are representative of the differences in floral UV patterns between LUVp categories in that experiment. (f) H. annuus ligules after having been exposed to sunlight for 15 min. (g) Five pairs of ligules from different sunflower lines were exposed to sunlight for 15 min, and their average temperature was measured from IR pictures. (h) Correlation between average LUVp in H. annuus populations and summer relative humidity (RH) (R2 = 0.51, p=1.4 × 10⁻¹⁸, n = 110 populations). The grey area represents the 95% confidence interval. (i) Rate of water loss from ligules and (j) leaves of wild H. annuus plants with large or small LUVp. Values reported are means ± standard error of the mean. n = 16 inflorescences (ligules) or 15 plants (leaves). Three detached ligules and one or two leaves for each individual were left to air-dry and weighed every hour for 5 hr, after they were left to air-dry overnight (o.n.), and after they were incubated in an oven to remove any residual humidity (oven-dry). Asterisks denote significant differences (p<0.05, two-sided Welch t-test; exact p-values are reported in Figure 4—source data 1–4). (k) Genotype-environment association (GEA) for summer average temperature (Av. T) and summer RH in the HaMYB111 region. The dashed orange line represents Bayes factor (BFis) = 10 deciban (dB). GEAs were calculated using two-sided XtX statistics. n = 71 populations.
Figure 4—figure supplement 1.
Figure 4—figure supplement 1.. Pollinator visits in the 2019 field experiment divided by category of pollinators.
Individual measurements of pollinator visitation rates, colour-coded by pollinator type. Lines represent LOESS regressions, and shaded areas are 95% confidence intervals (n = 1390 total pollinator visits; n = 1103 bees visits; n = 244 bumblebees visits). ‘Bees’ were exclusively honey bees; ‘bumblebees’ included several Bombus species. Most of the other visits were from Megachile bees (34 visits, 2.4% of the total); syrphid flies and butterflies accounted for the remaining visits (nine visits, 0.6% of the total). In the 2017 field experiment, pollinators were overwhelmingly bumblebees. The only other pollinators recorded were syrphid flies, which visited inflorescences with large ligule ultraviolet proportion (LUVp) seven times (7.9% of total visits on these inflorescences) and inflorescences with small LUVp two times (3.7% of total visits on these inflorescences).
Figure 4—figure supplement 2.
Figure 4—figure supplement 2.. Correlations between ligule ultraviolet proportion (LUVp) and environmental variables in H. annuus.
(a) Spearman correlation heatmap for LUVp and environmental variables in wild H. annuus populations. Source data for this figure are reported in Figure 1—source data 1. (b) Effects of relative humidity on the correlation between average temperature and LUVp. Regression lines are shown for three values of summer relative humidity: the mean value for the distribution of summer relative humidity values across populations, and values at ±1 standard deviation from the mean. Shaded areas represent 95% confidence intervals. The colour of individual data points is proportional to summer relative humidity values in that population. The strength of the negative correlation between LUVp and temperature increases with relative humidity, consistent with the proposed positive effect on heat stress resistance of increased transpiration from ligules with smaller floral UV patterns being advantageous only in humid climates.
Figure 4—figure supplement 3.
Figure 4—figure supplement 3.. Inflorescence temperature time series.
Infrared images of east-facing inflorescences of sunflowers with large (ligule ultraviolet proportion [LUVp] = 1) or small (LUVp < 0.15) floral UV patterns taken in the summer of 2017. No additional difference was observed in pictures taken more than 3 hr after sunrise. While no difference in temperature was observed in ligules, the centre (disc) of the inflorescence was consistently warmer in plants with small LUVp. However, this effect is independent of ligule UV patterns since it persists in inflorescences in which ligules were removed (rightmost column). Pollinator visits were severely reduced for inflorescences with ligules removed. Bumblebees can be seen on the disc of inflorescences with large LUVp in the leftmost column of pictures, at 5–10 min and 2 hr. Temperature values outside of the 10–40°C interval are shown in tan (<10°C) or green (>40°C).
Figure 4—figure supplement 4.
Figure 4—figure supplement 4.. Correlations between ligule ultraviolet proportion (LUVp) and other floral characteristics.
(a) Correlation between LUVp and flower head diameter (n = 572 individuals), (b) flower disc diameter (n = 576 individuals), or (c) relative ligule size (flower head diameter/flower disc diameter; n = 573 individuals) in wild H. annuus plants grown in a common garden experiment in Vancouver, BC, Canada, in the summer of 2016 (Todesco et al., 2020). (d) Correlation between relative ligule size and summer relative humidity across 59 populations of H. annuus. Shaded areas represent the 95% confidence interval. Source data for this figure are reported in Figure 1—source data 1 and Figure 1—source data 2. No obvious genetic correlation between LUVp and flower size was observed in H. annuus; in genome-wide association studies (GWAS), HaMYB111 was not associated with any of the floral characteristics we measured (flower head diameter; disc diameter; ligule length; ligule width; relative ligule size; see Todesco et al., 2020). Additionally, no significant association was found between ligule length and LUVp (R2 = 0.0024, p=0.1282), and only a very weak positive association was found between inflorescence size and LUVp (R2 = 0.0243, p=0.00013; panel a). However, a stronger positive correlation was observed between LUVp and disc size (the disc being the central part of the sunflower inflorescence, composed of the fertile florets; R2 = 0.1478. p=2.78 × 10⁻²¹; panel b). As a consequence a negative correlation was observed between LUVp and relative ligule size (i.e., the length of the ligule relative to the diameter of the whole inflorescence; R2 = 0.1216, p=1.46 × 10⁻¹⁷; panel c). Given inflorescences of the same size, plants with large LUVp values therefore tend to have smaller ligules and larger discs. Since the disc of sunflower inflorescences is uniformly UV-absorbing, this would further increase the size of the UV-absorbing region in these inflorescences. While it possible that this is connected with regulation of transpiration (meaning that plants with larger LUVp would further reduce transpiration from ligules by having smaller ligules – relative ligule size is also positively correlated with summer humidity; R2 = 0.2536, p=2.86 × 10⁻⁵; panel d), there are many other fitness-related factors that could determine inflorescence size, and disc size in particular (e.g., seed size, floret and seed number).
Figure 4—figure supplement 5.
Figure 4—figure supplement 5.. Correlations between ligule ultraviolet proportion (LUVp) and environmental variables in H. petiolaris.
(a) Correlation between average LUVp for different populations of H. petiolaris and summer UV radiation (R2 = 0.11, p=0.02), (b) summer average temperature (R2 = 0.69, p=10–11), or (c) summer relative humidity (R2 = 0.47, p=4.4 × 10⁻⁷). Grey areas represent the 95% confidence interval. (d) Spearman correlation heatmap for LUVp and environmental variables. Source data for this figure are reported in Figure 1—source data 1. (e) Effects of relative humidity on the correlation between average temperature and LUVp. Regression lines are shown for three values of summer relative humidity: the mean value for the distribution of summer relative humidity values across populations, and values at ±1 standard deviation from the mean. Shaded areas represent 95% confidence intervals. The colour of individual data points is proportional to summer relative humidity values in that population. While interactions between relative humidity and average temperature show the same general trend as for H. annuus (stronger correlation between average summer temperature and LUVp for higher levels of relative humidity), the effect is much weaker, possibly due to the smaller geographical area covered by the H. petiolaris populations in our collections (see Figure 1a and b).
Author response image 1.

Comment in

References

    1. Atamian HS, Creux NM, Brown EA, Garner AG, Blackman BK, Harmer SL. Circadian regulation of sunflower heliotropism, floral orientation, and pollinator visits. Science. 2016;353:587–590. doi: 10.1126/science.aaf9793. - DOI - PubMed
    1. Badouin H, Gouzy J, Grassa CJ, Murat F, Staton SE, Cottret L, Lelandais-Brière C, Owens GL, Carrère S, Mayjonade B, Legrand L, Gill N, Kane NC, Bowers JE, Hubner S, Bellec A, Bérard A, Bergès H, Blanchet N, Boniface M-C, Brunel D, Catrice O, Chaidir N, Claudel C, Donnadieu C, Faraut T, Fievet G, Helmstetter N, King M, Knapp SJ, Lai Z, Le Paslier M-C, Lippi Y, Lorenzon L, Mandel JR, Marage G, Marchand G, Marquand E, Bret-Mestries E, Morien E, Nambeesan S, Nguyen T, Pegot-Espagnet P, Pouilly N, Raftis F, Sallet E, Schiex T, Thomas J, Vandecasteele C, Varès D, Vear F, Vautrin S, Crespi M, Mangin B, Burke JM, Salse J, Muños S, Vincourt P, Rieseberg LH, Langlade NB. The sunflower genome provides insights into oil metabolism, flowering and Asterid evolution. Nature. 2017;546:148–152. doi: 10.1038/nature22380. - DOI - PubMed
    1. Beckmann M, Václavík T, Manceur AM, Šprtová L, von Wehrden H, Welk E, Cord AF, Tatem A. glUV: a global UV-B radiation data set for macroecological studies. Methods in Ecology and Evolution. 2014;5:372–383. doi: 10.1111/2041-210X.12168. - DOI
    1. Bock DG, Kantar MB, Rieseberg L. Population GGenomics of SSpeciation and AAdaptation in SSunflowers. Springer; 2020. - DOI
    1. Bolger AM, Lohse M, Usadel B. Trimmomatic: a flexible trimmer for Illumina sequence data. Bioinformatics. 2014;30:2114–2120. doi: 10.1093/bioinformatics/btu170. - DOI - PMC - PubMed

Publication types