Review
. 2022 Jan;12(1):e696.
doi: 10.1002/ctm2.696.

Spatial omics: Navigating to the golden era of cancer research

Affiliations
Review

Spatial omics: Navigating to the golden era of cancer research

Yingcheng Wu et al. Clin Transl Med. 2022 Jan.

Abstract

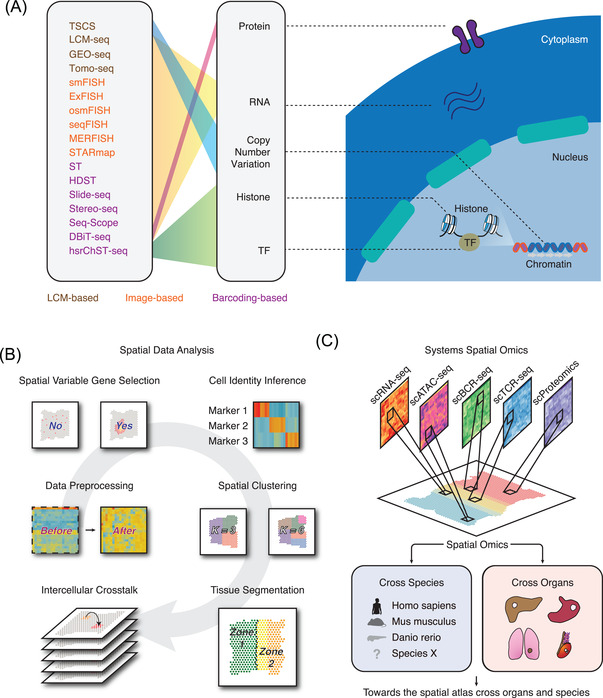
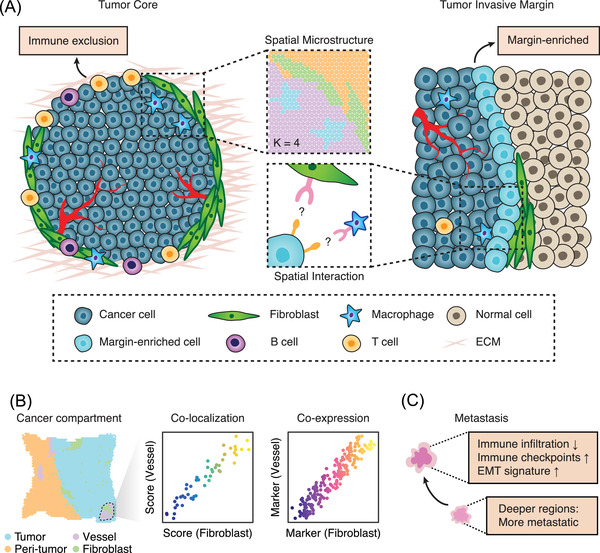
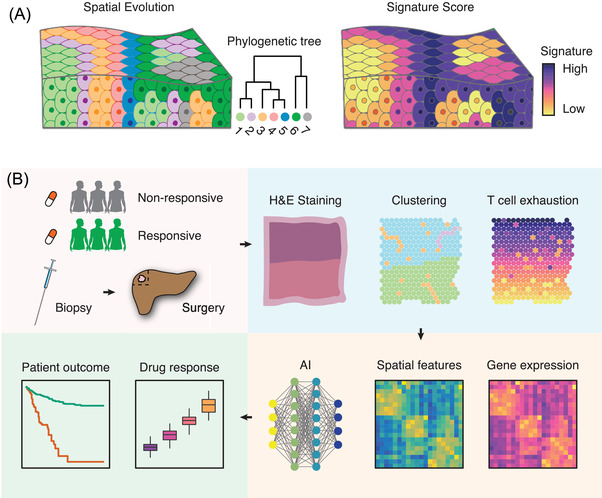
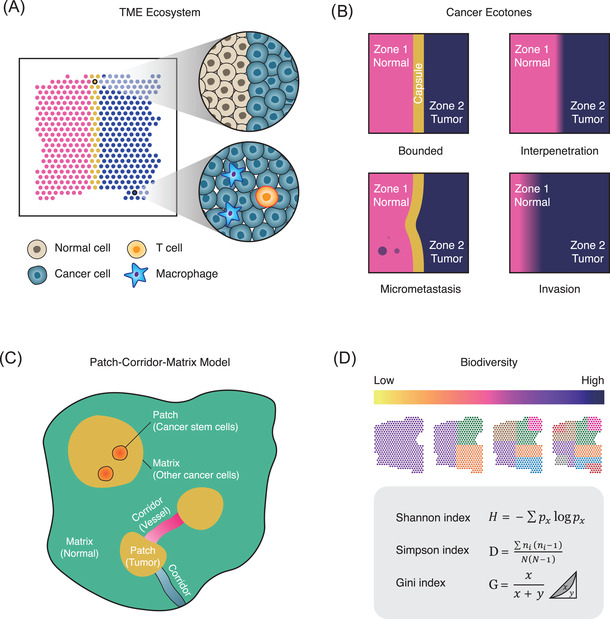
The idea that tumour microenvironment (TME) is organised in a spatial manner will not surprise many cancer biologists; however, systematically capturing spatial architecture of TME is still not possible until recent decade. The past five years have witnessed a boom in the research of high-throughput spatial techniques and algorithms to delineate TME at an unprecedented level. Here, we review the technological progress of spatial omics and how advanced computation methods boost multi-modal spatial data analysis. Then, we discussed the potential clinical translations of spatial omics research in precision oncology, and proposed a transfer of spatial ecological principles to cancer biology in spatial data interpretation. So far, spatial omics is placing us in the golden age of spatial cancer research. Further development and application of spatial omics may lead to a comprehensive decoding of the TME ecosystem and bring the current spatiotemporal molecular medical research into an entirely new paradigm.

Keywords: cancer ecology; single-cell RNA-seq; spatial omics; tumour microenvironment.


Conflict of interest statement

The author declares that there is no conflict of interest that could be perceived as prejudicing the impartiality of the research reported.

Figures

FIGURE 1
FIGURE 1
Spatial omics can decode the three‐dimensional structure of tumour microenvironment. (A) Summary of published spatial omics technologies. The brown text represents the LCM‐based technologies. The orange text represents the imaging‐based technologies. The purple text represents the barcoding‐based technologies. TF, transcription factor; LCM, laser capture microdissection. (B) The data analysis strategies which can be adopted in spatial omics data treatment. (C) Spatial omics can be utilised to study cancer samples across different species and distinct organs. Integrating of spatial omics and other omics techniques can systematically decode the structure of tumour microenvironment. scRNA‐seq, single‐cell RNA‐seq; scATAC‐seq, single cell assay for transposase‐accessible chromatin‐seq; scBCR‐seq, single cell B‐cell receptor‐seq; scTCR‐seq, single‐cell T‐cell receptor‐seq; mIHC, multiplex immunohistochemistry
FIGURE 2
FIGURE 2
The cancer microenvironment spatial structure and compartment revealed by spatial omics. (A) The distinct microenvironment structure of tumour core and tumour margins. ECM, extracellular matrix. (B) Spatial omics can precisely capture the TME compartment such as CAFs and vessel. CAFs, cancer associated fibroblasts. (C) The microenvironment pf primary and metastatic tumour s are largely different revealed by spatial studies
FIGURE 3
FIGURE 3
The spatial evolution of cancer cells and the potential clinical application of spatial omics. (A) Spatial genomics and transcriptomics allows the discovery pf evolution and their specific signature of cancer cells. (B) Spatial omics can be potentially used to predict the drug response and the clinical outcomes in the clinical setting. EMT, epithelial‐to‐mesenchymal transition; CAF, cancer‐associated fibroblasts
FIGURE 4
FIGURE 4
Building up the interdisciplinary link between ecology and oncology. (A) The TME is an ecosystem composed of diversified species such as immune cells and cancer cells. (B) The proposed models for describing different cancer ecotone patterns. The bounded pattern refers to equal and homogeneous interface (capsule) between tumour and adjacent normal tissues. The interpenetration pattern refers to the cancer cell infiltration into the adjacent normal tissues. The micrometastasis pattern refers to the mini cancer cell invasion into the adjacent normal tissues. The invasion pattern refers to the invasive cancer cell infiltration into the adjacent normal tissues. (C) The patch–corridor–matrix model for modelling the spatial tumour heterogeneity. (D) Methods for quantifying the spatial biodiversity inside the tumour microenvironment

References

    1. Dagogo‐Jack I, Shaw AT. Tumour heterogeneity and resistance to cancer therapies. Nat Rev Clin Oncol. 2018;15(2):81–94. 10.1038/nrclinonc.2017.166 - DOI - PubMed
    1. Yuan Y. Spatial heterogeneity in the tumor microenvironment. Cold Spring Harb Perspect Med. 2016;6(8):a026583.10.1101/cshperspect.a026583 - DOI - PMC - PubMed
    1. Smith EA, Hodges HC. The spatial and genomic hierarchy of tumor ecosystems revealed by single‐cell technologies. Trends Cancer. 2019;5(7):411–425. 10.1016/j.trecan.2019.05.009 - DOI - PMC - PubMed
    1. Jin MZ, Jin WL. The updated landscape of tumor microenvironment and drug repurposing. Signal Transduct Target Ther. 2020;5(1):166. 10.1038/s41392-020-00280-x - DOI - PMC - PubMed
    1. Quail DF, Joyce JA. Microenvironmental regulation of tumor progression and metastasis. Nat Med. 2013;19(11):1423–1437. 10.1038/nm.3394 - DOI - PMC - PubMed

Publication types

LinkOut - more resources